
INTRODUCTION
The Warburg effect, first reported by Otto Warburg [1], is an aberrant metabolic profile of most tumors characterized by a high glycolytic rate, despite the abundance of O2. The Warburg effect confers numerous advantages to tumor cells, including enhanced proliferation, invasion and cell death resistance [2]. The mechanism underlying this effect is defective mitochondrial ATP synthesis associated to H+-ATP synthase dysfunction [3], resulting in enhanced anaerobic glycolysis. Another consequence of defective H+-ATP synthase activity that has not been addressed is the possible influence of the changes in mitochondrial potential (ΔΨ) to intracellular Ca2+ homeostasis. Intracellular Ca2+ is involved in several cell physiological processes including those underlying cancer hallmarks such as cell proliferation, migration, invasion and cell survival [4]. In addition, mitochondria are critical players in intracellular Ca2+ homeostasis in health and disease [5]. Mitochondria take up Ca2+ through the mitochondrial Ca2+ uniporter (MCU), a recently cloned, Ca2+-activated, Ca2+ channel located at the inner mitochondrial membrane [6, 7]. The concentration of free Ca2+ inside the mitochondrial matrix ([Ca2+]mit) is the same as in the cytosol in resting conditions (100 nM) [5] and, therefore, there is no chemical gradient across the inner mitochondrial membrane. However, the ΔΨ of about –180 mV results in a large driving force that enables mitochondrial Ca2+ uptake through the MCU [5]. Moreover, the ability of mitochondria to buffer entering Ca2+ may modulate the slow, Ca2+-dependent inactivation of Ca2+-release activated Ca2+ channels (CRAC) involved in store operated Ca2+ entry (SOCE) [8, 9] as well as of IP3 receptor channels responsible for Ca2+ release from intracellular stores at the endoplasmic reticulum (ER) [10].
SOCE is a ubiquitous Ca2+ influx pathway involved in many different cell functions in essentially all types of cells [11]. This pathway, first proposed by James W. Putney in 1986 [12], is activated after agonist-induced release of Ca2+ from intracellular stores at the ER by IP3 and/or ryanodine receptors. The decrease in ER Ca2+ levels is sensed by stromal interaction proteins (STIM), particularly STIM1, [13] that oligomerize and interact with plasma membrane channels Orai1 [14] and/or transient receptor potential (TRP) channels [15]. In some cell types, regulation of SOCs and SOCE by mitochondria depends on the Ca2+ buffering capacity of mitochondria that may prevent the slow, Ca2+-dependent inactivation of CRAC [8, 9]. However, whether mitochondria control equally SOCs in normal and tumor cells has not been addressed.
Using well established cell models of normal colonic (NCM460) cells and colon cancer (HT29) cells [16], we have reported recently that SOCE and the underlying store-operated currents (SOCs) are dramatically enhanced in human colon cancer cells compared with their normal counterparts [17]. Interestingly, increases in both SOCE and SOCs contributes to colon cancer hallmarks [17]. SOCE is also enhanced in a series of cancers including breast, prostate, hepatoma, glioblastoma, etc. and contribute to aberrant cell migration, invasion and survival [18]. In our established cell models, we found that differences in SOCs and SOCE are mediated, at least in part, by changes in expression of molecular players including STIM1, Orai and TRPC1 [17]. However, whether mitochondria contribute to differences in SOCE between normal colonic and colon cancer cells remains to be addressed.
We have reported that aspirin metabolite salicylate and other non-steroidal anti-inflammatory drugs (NSAIDs) may depolarize mitochondria and inhibit SOCE in different cell types including colon cancer cells [19–22]. However, the effect of mitochondrial uncouplers on SOCs in colon cancer cells relative to normal colonic cells has not been investigated. These data are relevant as overwhelming evidence suggest that aspirin and other NSAIDs may prevent colon cancer and are considered for colon cancer chemoprevention in high risk individuals [23, 24].
Accordingly, we have investigated control of SOCs by mitochondria in normal and colon cancer cells. Our results indicate that mitochondria modulate differentially SOCs in normal and colon cancer cells. In normal cells, mitochondria are critical for SOC activity but currents inactivate regardless of mitochondrial status. In contrast, in colon cancer cells, mitochondria are not required for SOC activation but are essential to prevent the slow, Ca2+-dependent inactivation. These effects are likely due to the larger capability of tumor cell mitochondria to take up Ca2+ probably because of the Warburg effect. Finally, we show that selected NSAIDs counteract the effects of the Warburg effect and promote the slow, Ca2+ dependent inactivation of SOCs, thus providing a mechanism for colon cancer prevention by these compounds.
RESULTS
Store-operated Ca2+ entry is larger in colon cancer cells than in normal colonic cells and differentially sensitive to FCCP
We have investigated SOCE and the effect of mitochondrial depolarization on SOCE in normal colonic and colon cancer cells. For this end, we used NCM460 and HT29 cells that have been previously characterized as models of normal colonic and colon cancer cells, respectively [16]. Initially, role of mitochondria in SOCE was evaluated observing the effects of mitochondrial uncoupler carbonyl cyanide–4-trifluoromethoxy phenylhydrazone (FCCP) on SOCE in both normal and cancer cells. FCCP was added in the presence of oligomycin, to prevent the ATP synthase to work in reverse mode. Calcium imaging experiments show (Figure 1A) that, consistently with our previous results [17], SOCE is much larger in colon cancer cells than in normal colonic cells. Mitochondrial depolarization with FCCP inhibits significantly SOCE in tumor cells and nearly abolishes it in normal cells (Figure 1B, 1C). As reported previously in other cell types, mitochondria depolarization limits the driving force for mitochondrial Ca2+ uptake [8, 9], thus unmasking their contribution to SOCE. These results suggest that mitochondria may control differentially SOCE in normal colonic and colon cancer cells. However, calcium imaging permits only an indirect measure of SOCE and FCCP may have effects on plasma membrane potential. To avoid these shortcomings we investigated SOCs directly using the voltage-clamp configuration of patch-clamp electrophysiology.
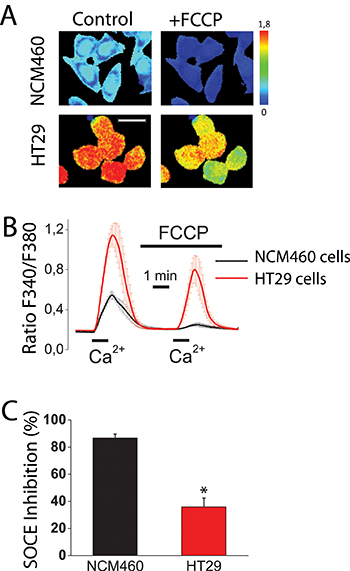
Figure 1: Mitochondria control store-operated Ca2+ entry (SOCE) in normal colonic cells and colon cancer cells. Effect of mitochondrial depolarization with FCCP (10 μM) on SOCE in NCM460 and HT29 cells. Fura2-loaded cells were treated with thapsigargin (1 μM, 10 min) off the record in Ca2+-free medium to deplete intracellular Ca2+ stores. Cells were then subjected to fluorescence imaging and stimulated with Ca2+ containing medium to induce SOCE. (A) Pictures show Ca2+ images in pseudocolor of NMC460 and HT29 cells stimulated with extracellular Ca2+ in the absence (Control) or the presence of the mitochondrial uncoupler FCCP. Images correspond to maximum Ca2+ peaks induced by SOCE before (Control) and after (FCCP) treatment with FCCP. Bar scale correspond to 15 μm. (B) Traces are average Ratio F340/F380 recordings (mean ± S.E.) from 5–6 independent experiments in normal (black) and colon cancer (red) cells, respectively. (C) Percent inhibition of SOCE induced by FCCP (mean ± SEM) in normal (NCM460) and colon cancer cells (HT29 cells. Data are from 5–6 independent experiments, respectively. *p < 0.05.
Mitochondria influence SOCs maximal amplitude in normal colonic cells but not the slow, Ca2+-dependent inactivation
SOCs were activated by depletion of intracellular Ca2+ stores with thapsigargin in three different conditions of intracellular Ca2+ buffering: (1) strong intracellular Ca2+ buffer (EGTA 20 mM) which prevents slow Ca2+-dependent inactivation of SOCs, (2) weak Ca2+ buffer (EGTA 0.2 mM), and (3) weak Ca2+ buffer (EGTA 0.2 mM) supplemented with a mitochondrial cocktail (2 mM pyruvic acid, 2 mM malic acid, and 1 mM NaH2PO4) previously reported for studying mitochondrial control of SOCs [9]. Although weak Ca2+ buffer resembles the physiological buffering, it is necessary supplementing it with the mitochondrial cocktail designed to preserve the full energetic capacity of mitochondria in patch-clamped cells [9]. Figure 2A–2C show representative examples of current/voltage (I/V) relationships of SOCs recorded in the three above mentioned conditions of intracellular Ca2+ buffering in normal colonic NCM460 cells. Individual plots display currents obtained from a single cell at maximum amplitude (peak) and at the end of recording period (end). Currents in normal colonic cells were functionally similar to the Ca2+-release activated currents (Icrac) reported in other cell types. Currents activated maximally in strong intracellular Ca2+ buffer (–2.2 ± 0.7 pA/pF, n = 18 cells) and showed no slow inactivation in these conditions (Figure 2D–2F). In weak Ca2+ buffer, current maximal amplitude was smaller (–0.9 ± 0.2 pA/pF, n = 16 cells) than in strong buffer and showed slow inactivation (Figure 2D). In the weak Ca2+ buffer supplemented with mitochondrial cocktail, current amplitude increased (-1.8 ± 0.3 pA/pF, n = 24 cells) but showed also slow inactivation (Figure 2D). Average data of current amplitudes and inactivation are shown in Figure 2E and 2F, respectively. The extent of slow inactivation was calculated for each single cell as the percent of current amplitude decrease at the end of recording compared with its maximum value. These results indicate that mitochondria in normal colonic NCM460 cells influence ISOC maximal amplitude but they are unable to prevent the slow Ca2+-dependent inactivation even in the presence of the mitochondrial cocktail.
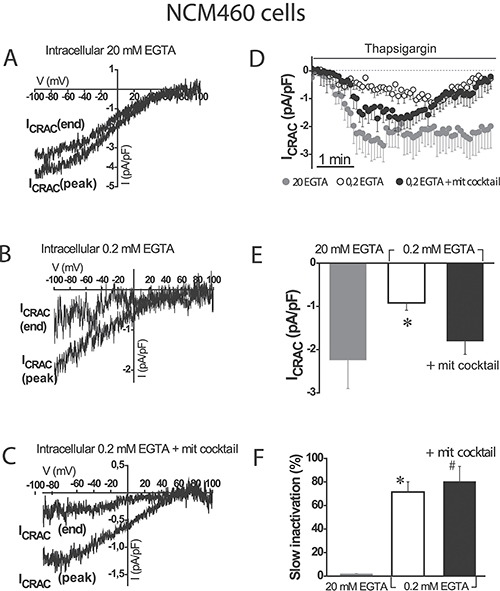
Figure 2: Mitochondria modulate activation of store-operated currents (SOCs) but are not able to prevent the slow, Ca2+-dependent inactivation in normal colonic cells. I-V relationships of store-operated currents at peak and at the end of the recording period, activated by thapsigargin 1 μM were recorded in NCM460 in intracellular medium containing strong Ca2+ buffer (20 mM EGTA) (A), physiological Ca2+ buffer (0.2 mM EGTA) (B) or physiological Ca2+ buffer supplemented with a mitochondrial cocktail containing (in mM) 2 pyruvic acid, 2 malic acid, and 1 NaH2PO4 and intended to maintain efficient mitochondrial respiration (0.2 mM EGTA + mitochondrial cocktail) (C, D) Average time course recordings of ISOC at –80 mV in NCM460 cells (n = 18–24). (E) Maximal current amplitude of ISOC in NCM460 (mean ± S.E., n = 18–24, *p < 0.05). (F) Slow inactivation of current recordings (%) F. *p < 0.05 vs. control; #p < 0.5 vs. physiological buffer.
To support further the above view, we tested the effects of the mitochondrial uncoupler FCCP on SOC amplitude and inactivation in normal colonic cells. Figure 3 shows that mitochondrial depolarization with FCCP, even in the presence of the mitochondrial cocktail, nearly abolished SOC activity in normal cells (–0.6 ± 0.2 pA/pF, n = 10 cells). In addition, slow inactivation of SOCs in normal cells was not prevented by FCCP. These results confirm that mitochondria are essential for current maximal amplitude in normal colonic cells under weak intracellular Ca2+ buffering, similar as those found in physiological conditions; however, mitochondria in normal NCM460 cells, either energized or not, are not capable of preventing the slow, Ca2+-dependent inactivation of these currents.
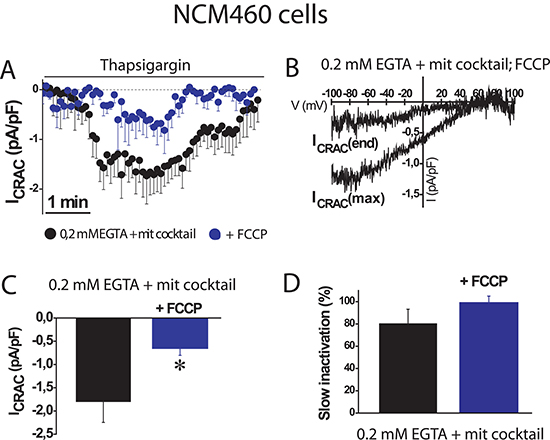
Figure 3: FCCP prevents SOC activation in normal colonic cells. ISOC is activated with 1 μM thapsigargin, physiological Ca2+ buffer (0.2 mM EGTA) and mitochondrial cocktail (2 pyruvic acid, 2 malic acid, and 1 NaH2PO4). (A, B) Average time course recordings of ISOC at -80 mV in NCM460 cells (n = 16) treated with 100 nM FCCP. (C, D) Maximal current amplitude of ISOC in NCM460 (C, mean ± S.E., n = 10-24, *p < 0.05). Slow inactivation of these recordings.
Mitochondria prevents Ca2+ dependent inactivation of SOCs in colon cancer cells
We next investigated the role of mitochondria in control of SOCs in human colon carcinoma cells. As reported previously [17], SOCs in HT29 colon cancer cells are larger than in NCM460 normal colon cells. We found that in colon cancer HT29 cells, inward SOCs activated maximally (–4.6 ± 0.7 pA/pF and 6.8 ± 1.4 pA/pF, n = 31 cells) in strong intracellular Ca2+ buffer with no slow inactivation (Figure 4A, 4D). However, in weak intracellular Ca2+ buffer, SOCs do not reach the maximal amplitude (–2 ± 0.5 pA/pF, n = 15 cells) as the observed in strong Ca2+ buffer. In addition, in these conditions of weak Ca2+ buffer, SOCs display slow inactivation (Figure 4B, 4D). When weak Ca2+ buffer was supplemented with the mitochondrial cocktail, SOC activity increased (–3.2 ± 0.6 pA/pF, n = 13 cells) and most importantly, the mitochondria energization prevented the slow inactivation of the inward component of SOCs (Figure 4C, 4D). Interestingly, the outward component of SOCs was not affected by intracellular Ca2+ buffering at all. Average data on effects of different buffering conditions on current amplitude and inactivation of SOC are shown in Figure 4E and 4F. Data suggest that, in contrast to normal cell mitochondria, tumor cell mitochondria efficiently prevent the slow, Ca2+-dependent inactivation of SOCs. However, mitochondria have a lesser influence on the maximal current amplitude than in normal colonic cells.
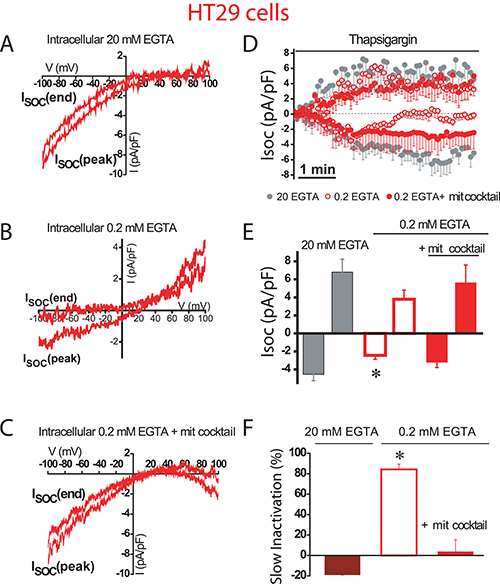
Figure 4: Mitochondria prevents slow, Ca2+-dependent inactivation of SOCs in colon cancer cells. Store-operated currents activated by thapsigargin 1 μM were recorded in HT29 cells in intracellular medium containing strong Ca2+ buffer (20 mM EGTA) (A), physiological Ca2+ buffer (0.2 mM EGTA) (B) or physiological Ca2+ buffer supplemented with a mitochondrial cocktail (2 pyruvic acid, 2 malic acid, and 1 NaH2PO4) intended to maintain efficient mitochondrial respiration (0.2 mM EGTA and mitochondrial cocktail) (C, D)Average time course recordings of ISOC at –80 mV in HT29 cells (n = 13-31). (E) Maximal current amplitude of ISOC (mean ± S.E., n = 13–31, *p < 0.05). (F) Slow inactivation of these recordings. *p < 0.05.
To confirm the role of mitochondria in colon cancer cells, we studied next the effects of FCCP on SOCs using weak Ca2+ buffer supplemented with mitochondrial cocktail (Figure 5). FCCP had no significant effect on SOC maximal amplitude (–3.1 ± 0.6 pA/pF, n = 13 cells) in tumor cells. However, mitochondria depolarization with FCCP promoted the slow inactivation (Figure 5A–5D) by more than 75% of the maximal current. Consistently, the pro-inactivating effects of FCCP were abolished in the presence of strong intracellular Ca2+ buffer (Figure 5E, 5F) indicating that slow inactivation of inward SOCs depends on the ability of tumor cell mitochondria to buffer efficiently Ca2+.
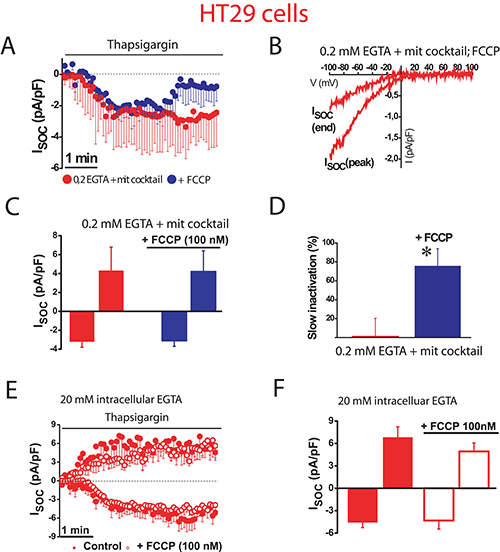
Figure 5: Mitochondrial depolarization promotes SOC inactivation in colon cancer cells. ISOC is activated with 1 μM thapsigargin, physiological Ca2+ buffer (0.2 mM EGTA) and mitochondrial cocktail (2 pyruvic acid, 2 malic acid, and 1 NaH2PO4). (A, B). Average time course recordings of ISOC at –80 mV in HT29 cells (n = 13) treated with 100 nM FCCP. (C) Maximal current amplitude of ISOC in HT29 cells (mean ± S.E., n = 13, *p < 0.05). (D) Slow inactivation of these recordings in HT29 cells (*p < 0.05). (E) Average time course recordings of ISOC at –80 mV in HT29 cells in strong Ca2+ buffer (20 mM EGTA) (n = 12) in the absence and the presence of 100 nM FCCP. (F) Maximal current amplitude of ISOC in HT29 cells in these conditions (mean ± S.E., n = 12, *p < 0.05).
Mitochondrial Ca2+ uptake and mitochondrial potential are increased in colon cancer cells relative to normal cells
We investigated next the ability of mitochondria from normal colonic and colon cancer cells to take up Ca2+. For this end, cells were transfected with a plasmid containing a Ca2+ probe targeted to mitochondria (mitGA) [25]. Then cells were subjected to bioluminescence imaging to monitor mitochondrial Ca2+ concentration ([Ca2+]mit) after stimulation. Figure 6A shows that extracellular Ca2+ added to intact cells previously treated with thapsigargin (to activate SOCE) increases [Ca2+]mit in both normal colonic and colon cancer cells. The rise in [Ca2+]mit is significantly larger in colon cancer cells than in normal colonic cells (Figure 6A, 6B). This is actually expected as SOCE is much larger in colon cancer cells than in normal cells (Figure 1). However, these data indicate that mitochondria sense Ca2+ entering through SOCs in both normal and colon cancer cells. We also tested the effects of physiological stimulation with ATP, an agonist that promotes Ca2+ release from intracellular stores, on mitochondrial Ca2+ uptake (Figure 6C). Again the rise in mitochondrial Ca2+ uptake induced by ATP was larger in cancer cells than in normal colonic cells (Figure 6C, 6D). However, we cannot discard that differences in mitochondrial Ca2+ uptake are not due to differences in Ca2+ release induced by ATP between normal and cancer cells [17]. To study possible differences in mitochondrial Ca2+ uptake we treated cells with different concentrations of digitonin to permeate them and then treat the cells with intracellular medium containing a similar concentration of Ca2+ (Figure 6E). We found that intracellular medium containing 5.7 μM Ca2+ increased [Ca2+]mit in both normal and tumor cells being the rise significantly larger in colon cancer cells than in normal colonic cells (Figure 6E, 6F). These results indicate that colon cancer cell mitochondria take up more Ca2+ than normal colonic cell mitochondria. Next we studied possible mechanisms involved in differential mitochondrial Ca2+ uptake.
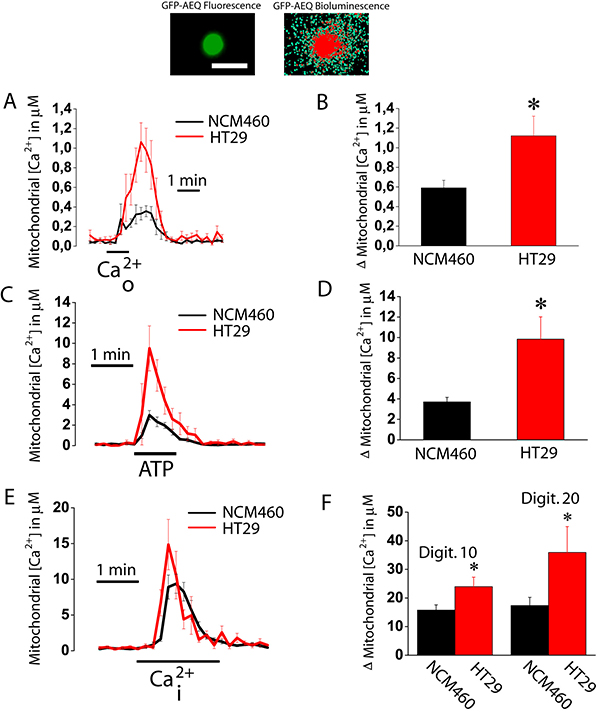
Figure 6: Mitochondrial Ca2+ uptake is larger in colon cancer cells than in normal colonic cells. Normal (NCM460, black recordings) and colon cancer (HT29 cells, red recording) cells were transfected with GFP-AEQmit and mitochondrial [Ca2+] was recorded in individual cells by bioluminescence imaging. Pictures show GFP fluorescence of transfected cells and photonic emissions reflecting mitochondrial [Ca2+] (A). Transfected cells were treated with thapsigargin (1 μM, 10 min) in Ca2+ free medium to deplete intracellular Ca2+ stores. Then cells were subjected to bioluminescence imaging and perfused with Ca2+-containing medium (Ca2+o) to assess the effects of SOCE on mitochondrial Ca2+ uptake. Traces and bars are mean ± SEM recordings of mitochondrial [Ca2+] values and peak heights, respectively, induced by SOCE (A, B). Transfected cells were also stimulated with 100 μM ATP in Ca2+ free medium to assess the effects of ATP-induced Ca2+ release on mitochondrial Ca2+ uptake. Traces and bars are mean ± SEM recordings of mitochondrial [Ca2+] values and peak heights, respectively, induced by ATP-induced Ca2+ release (C, D). Transfected cells were permeabilized in two different conditions, either 10 or 20 μM digitonin in internal medium containing a cytosolic-like Ca2+ concentration and then stimulated with the same medium containing 5.7 μM Ca2+ mimicking a rise in intracellular Ca2+ concentration (Ca2+i). Traces and bars are mean ± SEM recordings of mitochondrial [Ca2+] values and peak heights, respectively, induced by 10 μM Ca2+i (E, F) of at least 5 experiments. Bars show peak heights of these recordings (mean ± SEM, n ≥ 5, *p < 0.05).
Mitochondrial Ca2+ uptake takes place through the mitochondrial Ca2+ uniporter (MCU). Accordingly, we studied possible differences in expression of MCU between normal and tumor cells. As shown in Figure 7A, 7B, expression of MCU and its modulatory protein MICU1 are similar in normal and tumor cells at the mRNA level, being mRNA for MCU much more abundant than for MICU1. Therefore, we tested expression of MCU at the protein level using western blotting. Figure 7C, 7D shows that MCU protein expression is similar in normal and tumor cells. Thus, it is unlikely that differences in mitochondrial Ca2+ uptake between normal and colon cancer cells are due to differences in expression of MCU and/or its modulatory regulator MICU1.
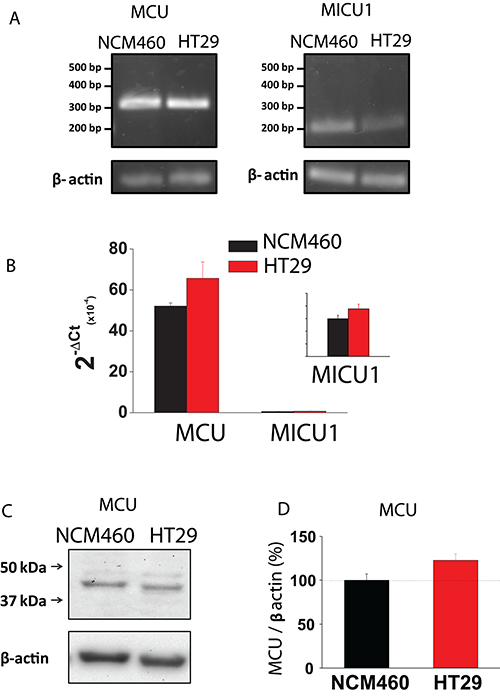
Figure 7: MCU and MICU1 expression levels are similar in NCM460 and HT29 cells. (A, B) mRNA expression of MCU and MICU1 in normal and tumor cells. Pictures show specific bands of RT-PCR products (A). Bars are mRNA levels normalized to β-actin obtained by qRT-PCR (B, mean ± S.E., n ≥ 3, *p < 0,05). (C, D) Protein expression of MCU in NCM460 and HT29. Pictures show specific bands of western-blotting products (C). Bars are protein levels normalized to β-actin in HT29 cells relative to NCM460 cells (D, mean ± S.E., n = 3, *p < 0.05).
The other critical determinant of mitochondrial Ca2+ uptake in addition to MCU is ΔΨ, the driving force for Ca2+ transport from cytosol to mitochondria, two compartments with similar Ca2+ concentration at rest (about 100 nM). We asked therefore for possible differences in ΔΨ between normal and colon cancer cells. For this end, we used fluorescence imaging of cells treated with TMRM, a fluorescence probe that accumulates inside mitochondria according to ΔΨ [20, 26]. As shown in Figure 8, colon cancer cells accumulate much more TMRM than normal cells consistently with enhanced ΔΨ in tumor cells. These results are consistent with previous observations in most tumor cells that display increased ΔΨ associated to the Warburg effect [27]. Thus, when taken together, our data suggest that the larger mitochondrial Ca2+ uptake of colon cancer cells relative to normal cells is likely due to enhanced ΔΨ associated to the Warburg effect.
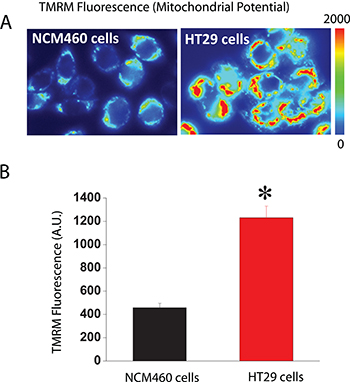
Figure 8: Mitochondrial potential (ΔΨ) is larger in colon cancer cells than in normal colonic cells. Normal and colon cancer cells were incubated with the mitochondrial potential probe TMRM (50 nM, 15 min) before fluorescence imaging using the rhodamine filters. (A) Pictures reflecting mitochondrial potential coded in pseudocolor. (B) Bars show mean ± SEM of 6 independent experiments (*p < 0.05). Black bar, normal cells. Red bar, colon cancer cells.
Selected NSAIDs depolarize mitochondria and inhibit mitochondrial Ca2+ uptake in colon cancer cells
To support further the above view, we targeted ΔΨ using a series of non-steroidal anti-inflammatory drugs (NSAIDs) that, acting as mild mitochondria uncouplers [28], may depolarize mitochondria and hence modulate mitochondrial Ca2+ uptake, SOCs and SOCE in colon cancer cells. Figure 9 shows that classic NSAIDs sulindac sulphide and indomethacin, as well as R-flurbiprofen, an enantiomer of flurbiprofen lacking anti-inflammatory activity, decreased TMRM fluorescence in colon cancer cells in a dose-dependent manner, consistently with mitochondria depolarization. These results are consistent with previous observations of mitochondrial depolarization induced by these compounds in other cells types [20–22] including neurons [29–31]. Furthermore, bioluminescence recordings of [Ca2+]mit in colon cancer cells treated with digitonin and intracellular medium containing 5.7 μM Ca2+ revealed that the same NSAIDs inhibit mitochondrial Ca2+ uptake at the same concentrations that depolarize mitochondria and to a similar extent than low concentrations of FCCP (Figure 10). These results are consistent with the important role of ΔΨ in mitochondrial Ca2+ uptake reported previously [20]. As NSAIDs counteracted the effects of the Warburg effect on ΔΨ we asked next for the effects of these compounds on SOCs.
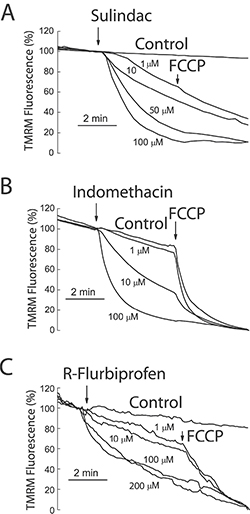
Figure 9: NSAIDs depolarize mitochondria in colon cancer cells. HT29 colon cancer cells were incubated with the mitochondrial potential probe TMRM (50 nM, 15 min) before fluorescence imaging using the rhodamine filters. Cells were continuously perfused with standard external medium. Cells were treated with medium containing solvent (Control) or different concentrations of sulindac sulphide (A), indomethacin (B) and R-flurbiprofen (C). In some cases, FCCP 10 μM was added to collapse ΔΨ. Data are average recordings normalized to the value before addition of treatments and representative of 3 independent experiments for each treatment.
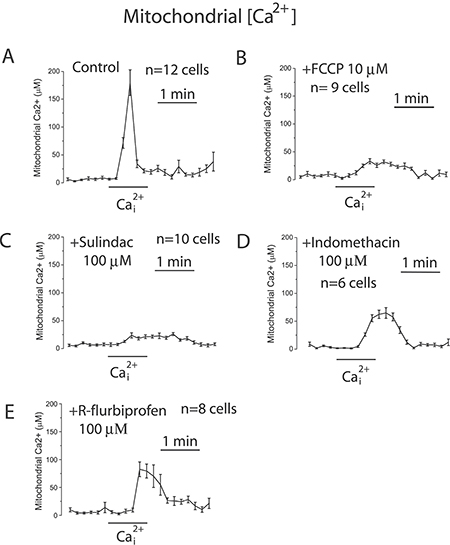
Figure 10: NSAIDs inhibit mitochondrial Ca2+ uptake in colon cancer cells. HT29 cells were transfected with mutated GFP-AEQ targeted to mitochondria. Next day cells were incubated with celenterazine and then subjected to bioluminescence imaging for monitoring mitochondrial [Ca2+]. Cells were incubated in digitonin in intracellular medium containing 200 nM [Ca2+] and then stimulated with 5.7 μM to induce mitochondrial Ca2+ uptake in medium containing solvent (A), 100 nM FCCP (B), or 100 μM sulindac sulphide (C), or 100 μM (Indomethacin) (D), or 100 μM (R-flurbiprofen) (E). Traces are mean ± SEM recordings of mitochondrial [Ca2+] induced of transfected cells identified by the GFP fluorescence corresponding to 8-12 individual cells recorded in 3 to 5 independent experiments for each treatment.
Selected NSAIDs promote SOC inactivation and inhibit SOCE and cell proliferation in normal and colon cancer cells
The effects of selected NSAIDs on SOCs were investigated in colon cancer cells using patch-clamp electrophysiology. We found that the aspirin metabolite salicylate, sulindac, indomethacin and R-flurbiprofen decreased SOCs amplitude and/or promoted SOCs inactivation in colon cancer cells (Figure 11A–11F) consistently with the effects of these compounds on ΔΨ and mitochondrial Ca2+ uptake [20]. Furthermore, the effects of NSAIDs on SOCs were removed by increasing the intracellular Ca2+ buffering capacity. These results indicate that NSAIDs do not inhibit SOCs directly but instead they promote their slow, Ca2+-dependent inactivation.
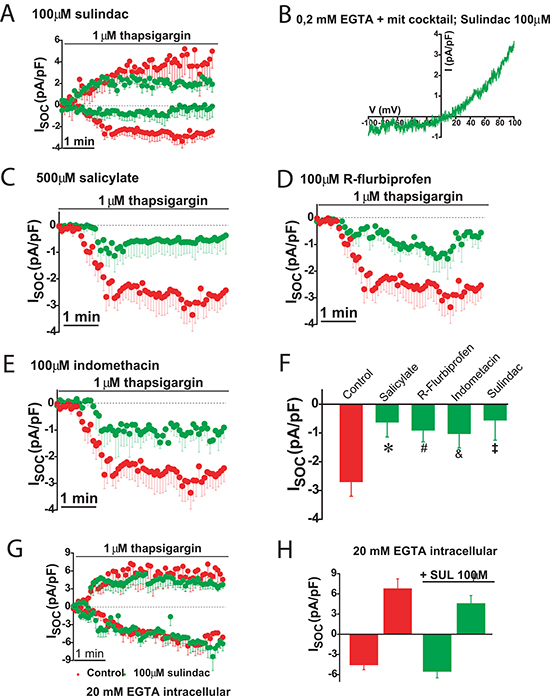
Figure 11: NSAIDs and FCCP promotes slow dependent inactivation in colon cancer cells. Thapsigargin activated SOCs were recorded in HT29 cells in physiological buffer (0.2 mM EGTA + mitochondrial cocktail) and the presence of either solvent (red recordings) or in the presence of 100 μM sulindac sulphide (green recordings, (A). I-V relationship of a SOC recorded in a representative cell showing inward and outward component in the presence of sulindac (B). SOCs were also recorded in HT29 cells in the presence of solvent (red recordings) or different NSAIDs (green recordings) including 500 μM salicylate (C), 100 μM R-flurbiprofen (D) or 100 μM indomethacin (E). Data are mean ± SEM values of current density (pA/pF) recorded in 10 to 14 cells. (F) shows mean ± SEM values or peak current in control cells and cells treated with the different NSAIDs. *p < 0.05. (G) shows currents recorded in high intracellular Ca2+ buffer (20 mM EGTA) in the presence of solvent (red recording) or 100 μM sulindac sulphide (green recording). Data are mean ± SEM values of 14 different cells. (H) shows current density values for inward and outward components of control cells and cells treated with sulindac sulphide.
We tested also the effects of selected NSAIDs on SOCE and cell proliferation in colon cancer cells and normal cells. Figure 12 shows that NSAIDs inhibit SOCE in colon cancer cells in a dose dependent manner. Again these effects were reproduced by R-flurbiprofen lacking anti-inflammatory activity but showing the same mitochondria depolarizing activity. The same compounds inhibited cell proliferation in colon cancer cells in a dose-dependent manner (Figure 13) consistently with the role of SOCE in cell proliferation in colon cancer cells [17].
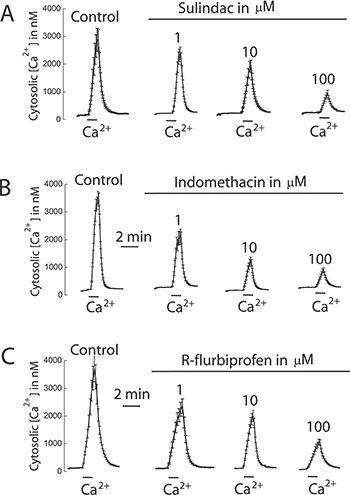
Figure 12: NSAIDs inhibit SOCE in colon cancer cells. HT29 cells were incubated with Fura4F/AM (4 μM, 60 min) at room temperature. Then cells were treated with thapsigargin (1 μN, 10 min) in Ca2+ free medium and then subjected to fluorescence imaging for monitoring of cytosolic [Ca2+]. Addition of 1 mM Ca2+ induce large increases in [Ca2+]cyt corresponding to SOCE. Cells were treated with solvent or different concentrations of sulindac sulphide (A), indomethacin (B) or R-flurbiprofen (C). Recordings are representative mean ± SEM values of [Ca2+]cyt of different cell batches treated with solvent or different concentrations of the above mentioned compounds. Data are representative of at least three independent experiments with each compound.
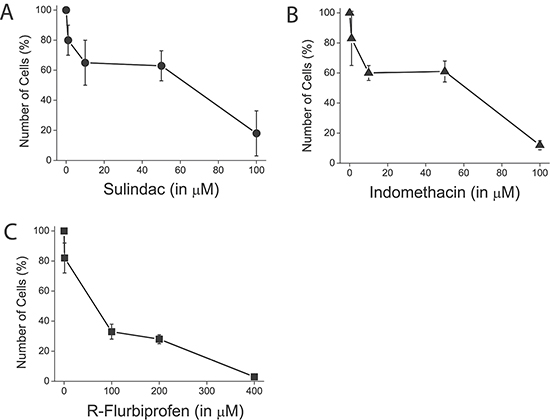
Figure 13: NSAIDs inhibit colon cancer cell proliferation. HT29 cells were plated in culture medium containing solvent of different concentrations of sulindac sulphide (A), indomethacin (B) and R-flurobiprofen (C) and the number of cells was estimated at plating and after 96 h. The number of cells at the end of the 96 h period is shown as a percent value (mean ± SEM) of the number of cells at plating. *p < 0.05. Percent of dead cells was lower than 5 % in all cases as shown by trypan blue staining.
As in normal colonic cells SOCE and SOCs are also modulated by mitochondria and involved in cell proliferation, we tested also the NSAIDs on SOCE and cell proliferation in these cells. In NCM460 cells, SOCE is nearly abolished by SOCE antagonist 2-APB and sulindac sulphide, the stronger mitochondrial uncoupler (Figure 14). Consistently, NCM460 cell proliferation was largely prevented by both 2-APB and sulindac sulphide. Other NSAIDs like salicylate and R-flurbiprofen inhibited cell proliferation to a lower extent consistently with their lower depolarizing capability (Figure 14).
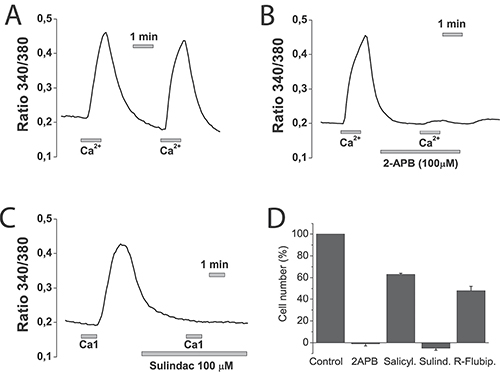
Figure 14: NSAIDs inhibit SOCE and cell proliferation in normal NCM460 cells. NCM460 cells were loaded with fura2/AM and treated with thapsigargin for depleting intracellular Ca2+. Then cells were subjected to Ca2+ imaging for monitoring of SOCE. Cells were perfused in Ca2+-free medium and then exposed to two consecutive, 1 min pulses of medium containing 1 mM Ca2+. To test the effects of selected compounds cells, before the second 1 mM calcium pulses, cells were treated with solvent (A), 100 μM 2APB (B) or 100 μM sulindac sulphide (C). Data are representative recordings of at least three independent recording. (D) NCM460 cells were plated in culture medium containing solvent or 2-APB (100 μM), salicylate (500 μM), sulindac sulphide (100 μM) or R-flurbiprofen (100 μM) and the number of cells was estimated at plating and after 96 h. The number of cells at the end of the 96 h period is shown as a percent value (mean ± SEM) of the number of cells at plating. *p < 0.05. Percent of dead cells was lower than 10% in all cases except for sulindac sulphide that amounted 14 ± 2 % as shown by trypan blue staining.
DISCUSSION
We have reported recently that colon cancer cells show a remarkable remodeling of intracellular Ca2+ homeostasis that contributes to cancer hallmarks including enhanced cell proliferation, cell invasion and resistance to cell death. Most salient features of remodeling are increased SOCE and enhanced and modified SOCs along the partial depletion of intracellular Ca2+ stores [17]. Another signature of most tumor cells is the Warburg effect by which affected tumor cells rely mostly on anaerobic glycolysis for energy production because of inhibition of oxidative phosphorylation [1, 2]. However, although mitochondrial ATP synthesis is prevented in most tumor cells, mitochondria actually display enhanced ΔΨ [27]. Mechanisms for enhanced ΔΨ are not completely understood but lack or inhibition of the H+-ATP synthase that dissipates ΔΨ during aerobic ATP synthesis probably plays a pivotal role in this regard [3]. Regardless of the mechanism, as ΔΨ constitutes the driving force for mitochondrial Ca2+ uptake and this process has been involved in control of SOCE, it is possible that colon cancer mitochondria modulate SOCE in a different way than normal cell mitochondria. We show that, consistently with enhanced ΔΨ of tumor cells, mitochondria from colon cancer cells take up more Ca2+ than mitochondria of normal cells and efficiently prevent the slow, Ca2+-dependent inactivation of SOCs, thus enhancing and sustaining SOCE in colon cancer cells. Mitochondria are also relevant for SOCs in normal cells but in a different fashion. In normal cells, mitochondria are not able to prevent the slow, Ca2+-dependent inactivation of CRAC channels and currents inactivate regardless of mitochondrial status. Therefore, mitochondria modulate differentially SOCs in normal and colon cancer cells. Nevertheless, we must acknowledge that these results have been obtained in two cell lines representing normal and colon cancer cells and they should be confirmed also in normal and colon cancer cells obtained for patients.
Mitochondrial Ca2+ uptake depends on multiple factors including 1) Ca2+ transport by the MCU and regulatory proteins, 2) ΔΨ, the driving force for mitochondrial Ca2+ uptake and 3) the relative proximity and/or coupling between mitochondria and Ca2+ channels in the plasma membrane and/or the ER. Our results indicate that MCU levels are similar in normal and colon cancer cells. However, as consequence of the Warburg effect, tumor cells display a much larger driving force for mitochondrial Ca2+ uptake that may contribute to explain enhanced mitochondrial Ca2+ uptake observed in tumor cells. In addition to ΔΨ, differential sensing by mitochondria of Ca2+ microdomains formed near SOC channels may also contribute to differences in mitochondrial Ca2+ uptake and hence, SOCE. In this regard, the larger SOCE observed in tumor cells and increased expression of associated molecular players as Orai1, TRPC1 and Stim1, likely allows formation of larger Ca2+ domains near mitochondria. Inasmuch as the MCU is a Ca2+-activated, Ca2+ channel [6, 7], high Ca2+ domains in tumor cells should lead to more efficient mitochondrial Ca2+ uptake [32] followed by prevention of the ensuing slow, Ca2+-dependent inactivation of SOCs. In normal colonic cells, however, the lower expression of Stim1 and Orai1 result in diminished SOCE, less capable of promoting high Ca2+ domains, thus limiting mitochondrial Ca2+ uptake, particularly in the face of a decreased ΔΨ of normal cell´s mitochondria. Notice in this regard that, if a very high intracellular Ca2+ buffer is used for recording of SOCs in normal cells, currents do not inactivate suggesting that SOC inactivation in normal cells is because of lack of enough Ca2+ buffering capacity by surrounding mitochondria rather than channels being intrinsically inactivating. However, mitochondrial Ca2+ uptake is required for maximal SOC activity in normal cells since, in physiological buffer, currents are extremely small and inactivating. Therefore, in normal cells, mitochondria are necessary for SOC activity but currents inactivate. In contrast, in tumor cells, mitochondria are able to prevent the slow, Ca2+-dependent inactivation of SOCs. This effect may help to sustain increased SOCE over time. In fact, increased expression of molecular players involved in SOCE, particularly Orai1 and Stim1, may not be enough to sustain Ca2+ in colon cancer cells. Overexpression of these channels may enlarge Ca2+ entry but this favors inactivation and, unless intracellular buffer capacity increases along channel expression, the Ca2+-dependent inactivation would short cut the entry of Ca2+. Our results suggest that this extra buffering capacity may be provided by the enhanced ΔΨ linked to the Warburg effect, the metabolic signature of most tumor cells.
Mitochondrial location relative to the plasma membrane (where SOCs are) and ER (where the gating mechanism for SOC opening is started) might influence SOC activation and inactivation differentially in normal and colon cancer cells. For example, mitochondria located close to ER could exert local modulation of SOCE [33]. Mitochondrial Ca2+ buffering at their interface with ER might decrease Ca2+ refill of stores, thus sustaining SOCE for longer periods of time [34]. However, there is evidence about opposite effect, i.e. mitochondria support stores refilling by releasing Ca2+ close to SERCA pumps in the ER [35, 36]. Although paradoxical, it has been proposed that mitochondrial may play both roles in different temporal windows. Whereas mitochondrial Ca2+ buffering modulates activation and sustains SOCE, mitochondrial release of Ca2+ close to SERCA sites promotes refill of stores inactivating SOCE [37].
Even more relevant may be mitochondria close to plasma membrane that can take up Ca2+ entering through plasma membrane Ca2+ channels. This has been studied in detail in T cells where activation of SOCE leads to redistribution of mitochondria towards plasma membrane [38]. Moreover, in these cells, mitochondria display preference to translocate close to immunological synapses, and allow higher Ca2+ influx in specific microdomains. Interestingly, those regions rich in mitochondria have higher Ca2+ influx [39]. If this is a general mechanism, it will be expected that linking mitochondria to plasma membrane could generate higher SOCE in the whole cell. Surprisingly, in endothelial cells, the artificial redistribution of mitochondria towards the plasma membrane decreased SOCE [40]. Furthermore, in HeLa cells, close contact of mitochondria to Ca2+ influx channels is not required for SOCE modulation [41]. These data indicate that although in immune cells localization of mitochondria is crucial to modulate SOCE, this may not apply similarly to other cell types. Interestingly, the adenomatous polyposis coli (APC), a protein responsible for familial adenomatous polyposis that plays also a rate-limiting role in the majority of sporadic colorectal cancers, is a mitochondrial protein that binds the Miro/Milton motor complex involved in mitochondria transport to the plasma membrane [42]. Thus, APC deficits linked to colon cancer may influence mitochondrial control of SOCE. Further research is required to address whether mitochondria localization and/or coupling to ER and/or plasma membrane may influence differentially SOCE in normal and colon cancer cells
A novel mechanism of mitochondria control of SOCE has been recently revealed mediated by the mitochondrial Na+/Ca2+ exchanger NCLX [43]. According to this model, store-associated activation of Na+ influx across the plasma membrane is essential for activation of the mitochondrial Na+/Ca2+ exchanger (NCLX) that enables Ca2+ extrusion from mitochondria. In the absence of Na+ influx, lack of mitochondrial Ca2+ clearance promotes reactive oxygen species (ROS) and oxidation of cysteine C195 in Orai1, leading to SOC inactivation. Interestingly, SOCs in colon cancer cells, but not in normal cells, involve Na+ currents mediated by TRPC1 that form a channel complex with Orai1 [17, 44], thus allowing Na+ influx. Accordingly, it is temptying to speculate whether this redox mechanism mediated by NCLX may contribute to sustain SOCE in colon cancer cells, but not in normal cells. Further research is required to support this possibility.
The important role of mitochondria in sustaining SOCs and SOCE in colon cancer cells may have important therapeutic implications. In this scenario, we can expect that targeting enhanced ΔΨ could reverse the sustaining effects of tumor mitochondria, thus leading to transient SOCs and decreased SOCE. We show here that this is indeed the case for several NSAIDs that, working as mild mitochondrial uncouplers, depolarize partially mitochondria and inhibit mitochondrial Ca2+ uptake, thus leading to slow SOC inactivation and inhibition of SOCE and cell proliferation. Consistently, the slow inactivation achieved by these compounds is only observed in weak Ca2+ buffer but not in strong Ca2+ buffer, a condition that prevents the slow, Ca2+-dependent inactivation of SOCs regardless of mitochondrial functional status. Therefore, the above data exclude the possibility that NSAIDs acted by inhibiting channels directly and indicate that they, instead, NSAIDs favor the Ca2+-dependent inactivation in a mitochondria-dependent fashion.
Overwhelming evidence indicate that aspirin and other NSAIDs may protect against colon cancer and some of these compounds are actually under consideration for colon cancer chemoprevention in high risk individuals by the U.S. Preventive Services Task Force [23]. A few years ago, we suggested that salicylate, the major aspirin metabolite, could prevent mitochondrial Ca2+ uptake and inhibit SOCE in a similar way [19, 20]. Now we provide direct electrophysiological evidence that salicylate and other NSAIDs, including sulindac and indomethacin, promote the slow Ca2+-dependent inactivation of SOCs in colon cancer cells. These effects are not related to the anti-inflammatory properties of these compounds as they are also mimicked by structural analogues like R-flurbiprofen lacking anti-inflammatory activity. In addition, these effects depend on the ability of NSAIDs to prevent mitochondrial Ca2+ uptake working as mild mitochondrial uncouplers [28]. Consistently, effects of NSAIDs are abolished in strong Ca2+ buffer where SOCs do not inactivate regardless of the functional mitochondrial status. Our results do not exclude that aspirin and other NSAIDs may prevent cancer acting on additional targets as, for instance, inhibition of COX2 in selected tumors.
In summary, we conclude that mitochondria and changes in ΔΨ related to the Warburg effect, the metabolic signature of most tumor cells, prevent the slow, Ca2+-dependent inactivation of store-operated currents in colon cancer cells but not in normal cells, thus sustaining and enhancing store-operated Ca2+ entry and related cancer hallmarks. These effects are largely counteracted by selected NSAIDs that promote SOC inactivation in a mitochondria-dependent manner. Thus, the Warburg effect may contribute to tumor cell growth by promoting Ca2+ remodeling in colon cancer.
MATERIALS AND METHODS
Materials
HT29 cells were donated by Dr. J.C. Fernández-Checa (CSIC, Barcelona, Spain). NCM460 cells were obtained from INCELL Corporation (San Antonio, TX, USA). Dulbecco’s Modified Eagle’s Medium (DMEM), Penicillin, streptomycin, L-glutamine and fetal bovine serum were from Lonza (Basel, Switzerland). M3:10TM medium was from INCELL Corporation (San Antonio, TX, USA). Detachin was from Gelantis (San Diego, CA, USA). Fura2/AM and Fura4F/AM were from Invitrogen (Carlsbad, CA, USA). AINEs and 2-APB are from Sigma-Aldrich (Madrid, Spain). 2-APThapsigargin is from Alomone Labs (Jerusalem, Israel). Anti β-actin was from ABcam (Cambridge, UK) anti MCU is from Santa Cruz Biotechnology (Dallas, TX, USA). SYBR green I was from Kappa Biosystems (Boston, MA, USA). Primers were obtained from Thermo Scientific (Ulm, Germany). mitGA plasmid was kindly donated by P. Brület (CNRS, France).
Cell culture
Cells were cultured in DMEM 1 g/L glucose or in M3:10TM media as reported previously [15]. Culture media were supplemented with 1% Penicillin-Strepromycin, 1% L-glutamine and 10% fetal bovine serum. Cells were maintained in standard conditions (37°C, 10% CO2) and subcultured once a week. All cells were used at passages 3 to 10.
Cytosolic Ca2+ imaging
[Ca2+]cyt was monitored as reported previously [15] by fluorescence imaging of cells using an inverted Zeiss Axiovert microscope equipped with a OrcaER Hamamatsu digital camera (Hamamatsu Photonics France). Cells were loaded with Fura2/AM or Fura4F/AM (4 μM, 60 min) in saline external medium (SEM) containing (in mM): 145 NaCl, 5 KCl, 1 CaCl2, 1 MgCl2, glucose 10, Hepes/Na+ 10 (pH 7.42). Cells were continuously perfused with SEM at 37ºC and epi-illuminated alternately at 340 and 380 nm using band pass filters located in a filter wheel. Light emitted above 520 nm at both excitation lights was filtered by a dichroic mirror and collected every 5–10 s with a 40x, 1.4 NA, oil objective. For SOCE, previously to Ca2+ imaging, cells were washed twice and treated with thapsigargin (1 μM, 10 min) in SEM without Ca2+ and containing 0.5 mM EGTA. Then, cells were placed in the stage of an inverted microscope and perfused with SEM without Ca2+. To activate SOCE, cells were exposed to SEM containing 1 mM Ca2+. For treatment, cells were perfused with NSAIDs and FCCP in Ca2+-free SEM for 5 min and then perfusion was switched to SEM containing NSAID and Ca2+. Fura2 was used to compare effects of FCCP on SOCE in normal and colon cancer cells. However, to assess the effects of NSAIDs on the large SOCE observed in colon cancer cells, Fura4F, a dye with lower affinity for Ca2+, was used instead.
Cell proliferation
Cells were plated in 6 well plates at a density of 10 × 105 cells and incubated with supplemented DMEM or the same medium contained test substances. Cells in wells were counted in triplicate at time 0 h and after 72, or 96 h using a hemocytometer. Cell viability was estimated using trypan blue staining.
Electrophysiological recordings
SOCs were recorded using a Port-a-patch planar patch-clamp system (Nanion Technologies, Munich, Germany) in the whole-cell, voltage-clamp configuration, at room temperature (20 ± 2ºC) as reported previously [15]. Cultured cells (3–5 days after plating) were detached with Detachin and suspended at a cell density of 1–5 × 10⁶ cells/mL in external recording solution containing (in mM): 145 NaCl, 2.8 KCl, 2 MgCl2, 10 CaCl2, 10 HEPES, 10 D-glucose (pH = 7.4). Suspended cells were placed on the NPC© chip surface, and the whole cell configuration was achieved. Internal recording solution containing (in mM): 50 CsCl, 60 CsF, 10 NaCl, 10 HEPES, 2 Na+-ATP (pH = 7.2, adjusted with CsOH) was deposited in recording chips, having resistances of 3–5 MΩ. SOCs were activated with thapsigargin included in the intracellular solution. Physiological Ca2+ buffering was emulated using 0.2 mM of EGTA in the intracellular solution, namely weak Ca2+ buffer. To maintain mitochondria in an energized status, weak Ca2+ buffer was supplemented with a cocktail containing 2 mM pyruvic acid, 2 mM malic acid, and 1mM NaH2PO4 [9]. In a set of experiments, strong Ca2+ buffer internal solution containing 20 mM of EGTA was used. SOCs were assessed using voltage ramps (–100 to + 100 mV in 200 ms) applied every 5 s, from a holding potential of 0 mV and acquired with an EPC-10 patch-clamp amplifier (HEKA). Immediately after the whole-cell configuration was established, the cell capacitance and the series resistances (< 10 MΩ) were measured. During records, these two parameters were measured, and if exceed ≥ 10% respect to the initial value, the experiment was discontinued. Leak currents were eliminated by subtracting the average of the first five ramp currents (obtained just after whole cell configuration was reached) to all subsequent currents. Inward and outward current amplitudes were measured at –80 mV and +80 mV, respectively. Data were normalized respect to cell capacitance. Liquid junction potential and capacitive currents were cancelled using the automatic compensation of the EPC-10. Data were filtered at 10 kHz and sampled at 5 kHz.
Bioluminescence imaging of mitochondrial [Ca2+]
Cells were transfected with the mitGA plasmid [25] using a Nucleofector II device (Amaxa Biosystems, Cologne, Germany) as reported previously [19, 20]. This plasmids contain wild type aequorin targeted to mitochondria and a GFP sequence to select transfected neurons for bioluminescence imaging. After 24 h, cells were incubated for 2 h with 4 μM coelenterazine at room temperature. This incubation time is required for the reconstitution of aequorin enzyme, thus enabling Ca2+-dependent light emission. Then, cells were washed and placed into a perfusion chamber thermostated to 37ºC under a Zeiss Axiovert S100 TV microscope. For bioluminescence imaging, cells were perfused at 5–10 ml/min with test solutions based on the standard perfusing solution described above prewarmed at 37ºC. At the end of each experiment, cells were permeabilized with 0.1 mM digitonin in SEM containing 10 mM CaCl2, added here to release all the residual aequorin counts. Bioluminescence images were taken with a Hamamatsu VIM photon counting camera handled with an Argus-20 image processor. Photonic emissions were integrated for 10 s periods. Photons were quantified using the Hamamatsu Aquacosmos software. Photonic emissions were converted to mitochondria free Ca2+ concentration ([Ca2+]mit) values as reported previously [19, 20, 32].
Mitochondrial potential and mitochondrial depolarization
Cells were loaded with TMRM (10 nM, 30 min) at room temperature and placed on a Zeiss Axiovert 100 TV inverted microscope. For comparison of ΔΨ in NCM460 and HT29 cells, cells were loaded in parallel and TMRM fluorescence images were captured using exactly the same imaging parameters. Then, cells were treated with FCCP 10 μM to collapse mitochondrial potential. After 10 min, a fluorescence image was taken to be used as background image. For monitoring effects of NSAIDs on ΔΨ, TRMR-loaded cells were subjected to fluorescence imaging at 5 s intervals. At the end of the experiment, cells were treated with FCCP 10 μM for 10 min before capturing a fluorescence image to be used as background fluorescence for cells. Fluorescence intensity from regions of interest corresponding to individual cells were average and the average value after collapse of the mitochondria potential with FCCP was substracted from each region of interest. Fluorescence values from individual cells were normalized (expressed as the percentage value of fluorescence before addition of NSAIDs) and averaged. To quantify mitochondrial depolarization, the effect of NSAIDs or FCCP on the ratio of TMRM fluorescence in mitochondria relative to that surrounding cytosol was calculated as reported previously [17, 18].
Quantitative real-time PCR
Total cellular RNA was isolated from cells using Trizol reagent (Invitrogen, Carlbads, CA, USA). Extracted RNA integrity was tested by electrophoresis on agarose gels and the purity and concentration were determined by spectrophotometry. RNA was reverse transcribed using a High Capacity cDNA Reverse Transcription Kit (Applied Biosystems, Foster City, CA, USA) and the cDNA diluted prior to PCR amplification. Primers used are shown in Table 1 and were designed using Primer-BLAST except for β-actin oligonucleotides that were taken from ref. 15. Real-time, quantitative PCR was performed using a SYBR green I detection in a LightCycler rapid thermal cycler (Roche, Mannheim, Germany). The PCR protocol started with 5 min at 95°C followed by 45 cycles of 15 s at 95°C, 20 s at 57°C or at 60 °C and 5 s at 72°C. β-actin was used as housekeeping gene. The data were normalized by PCR analysis of β-actin. Melting curves were used to determine the specificity of PCR products (Data not shown).
Table 1: Primers used for PCR experiments
Name |
Primers (5→3) |
Predicted size (pb) |
|---|---|---|
MCU |
F: TCCTGGCAGAATTTGGGAGC |
320 |
MICU1 |
F: CTCGCAGCCTCCCTAAGATG |
215 |
β-actin |
F: TACGCCAACACAGTGCTGTCTGG |
206 |
MCU and MICU1 primers were designed using BLAST-primer software and â-actin primers were taken from ref. 15. F: forward. R: reverse.
Western blotting
Total protein was extracted from cells and used to quantify expression of MCU. Whole-cell lysate was obtained using RIPA buffer (20 mM Tris–HCl, pH 7.8, 150 mM NaCl, 1% Triton X-100, 1% deoxycholic acid, 1 mM EDTA, 0.05% SDS) supplemented with the Halt™ Protease and Phosphatase Inhibitor Cocktail (100X) from ThermoFisher Scientific (ref #1861281) (Waltham, MC, USA). Protein concentrations were determined by a Bradford protein assay. Proteins were fractionated by SDS-PAGE, electroblotted onto PVDF membranes and probed with the antibodies at dilution 1/200 except the anti-β-actin that was used at dilution 1/5000. The antibody against MCU (SC-246071) has been previously characterized [45] was visualized by addition of goat anti-rabbit IgG or rabbit anti-mouse IgG. Detection was performed using Pierce ECL Western Blotting substrate (Thermo Scientific) and VersaDoc Imaging System (BioRad, Munich, Germany). Quantification of protein expression was carried out using Quantity One software (BioRad, Munich, Germany).
Statistics
When only 2 means were compared, student’s t test was used. For more than 2 groups, statistical significance was assessed by ANOVA and compared using Bonferroni’s multiple comparison tests. Differences were considered significant at p < 0.05.
Author contributions
Carlos Villalobos conceived the idea for the project, analyzed the results and wrote the paper with Miriam Hernández-Morales, Diego Sobradillo and Lucía Núñez. Miriam Hernández-Morales designed and performed all patch. clamp experiments and analyzed the results. Diego Sobradillo and Ruth Ana Valero designed and conducted all imaging and cell proliferation experiments and analyzed the results. Diego Sobradillo and Eva Muñoz performed bioluminescence imaging experiments and analyzed them. Diego Sobradillo and Daniel Ubierna designed and carried out qRT-PCR and western blotting experiments and analyzed the results. Mary P. Moyer developed and provided NCM460 cells.
ACKNOWLEDGMENTS
This work was supported by grant BFU2015-70131R from Ministerio de Economía y Competitividad, Spain to CV and LN and grant VA145U13 from Regional Government of Castilla y León, Spain to LN. DS and DU were supported by predoctoral fellowships from the JAE program (CSIC, Spain) and Junta de Castilla y León, Spain, respectively. We thank expert techical support by David del Bosque. The plasmid for mitochondria-targeted aequorin fused to GFP was a kind gift from Prof. P. Brulet (CNRS, France).
CONFLICTS OF INTEREST
The authors disclose no conflicts of interest.
REFERENCES
1. Warburg O. Origin of cancer cells. Oncologia 1956; 9:75–83.
2. Potter M, Newport E, Morten KJ. The Warburg effect: 80 years on. Biochem Soc Trans. 2016; 44:1499–1505.
3. García-Bermúdez J, Cuezva JM. The ATPase Inhibitory Factor 1 (IF1): A master regulator of energy metabolism and of cell survival. Biochim Biophys Acta. 2016; 1857:1167–1182.
4. Roderick HL, Cook SJ. Ca2+ signalling checkpoints in cancer: remodelling Ca2+ for cancer cell proliferation and survival. Nat Rev Cancer. 2008; 8:361–375.
5. Campanella M, Pinton P, Rizzuto R. Mitochondrial Ca2+ homeostasis in health and disease. Biol Res. 2004; 37:653–660.
6. Baughman JM, Perocchi F, Girgis HS, Plovanich M, Belcher-Timme CA, Sancak Y, Bao XR, Strittmatter L, Goldberger O, Bogorad R, Koteliansky V, Mootha VK. Integrative genomics identifies MCU as an essential component of the mitochondrial calcium uniporter. Nature. 2011; 476:341–345.
7. De Stefani D, Raffaello A, Teardo E, Szabo I, Rizzuto R. A forty-kilodalton protein of the inner membrane is the mitochondrial calcium uniporter. Nature. 2011; 476:336–40.
8. Hoth M, Fanger CM, Lewis RS. Mitochondrial regulation of store-operated calcium signaling in T lymphocytes. J Cell Biol. 1997; 137:633–648.
9. Gilabert JA, Parekh AB. Respiring mitochondria determine the pattern of activation and inactivation of the store-operated Ca2+ current ICRAC. EMBO J. 2000; 19:6401–6407.
10. Gilabert JA, Bakowski D, Parekh AB. Energized mitochondria increase the dynamic range over which inositol 1,4,5-trisphosphate activates store-operated calcium influx. EMBO J. 2001; 20:2672–2679.
11. Parekh AB, Putney JW Jr. Store-operated calcium channels. Physiol Rev. 2005; 85:757–810.
12. Putney JW Jr. A model for receptor-regulated calcium entry. Cell Calcium. 1986; 7:1–12.
13. Liou J, Kim ML, Heo WD, Jones JT, Myers JW, Ferrell JE Jr, Meyer T. STIM is a Ca2+ sensor essential for Ca2+-store-depletion-triggered Ca2+ influx. Curr Biol. 2005; 15:1235–1241.
14. Feske S, Gwack Y, Prakriya M, Srikanth S, Puppel SH, Tanasa B, Hogan PG, Lewis RS, Daly M, Rao A. A mutation in Orai1 causes immune deficiency by abrogating CRAC channel function. Nature. 2006; 441:179–185.
15. Cheng KT, Ong HL, Liu X, Ambudkar IS. Contribution and regulation of TRPC channels in store-operated Ca2+ entry. Curr Top Membr. 2013; 71:149–179.
16. Alcarraz-Vizán G, Sánchez-Tena S, Moyer MP, Cascante M. Validation of NCM460 cell model as control in antitumor strategies targeting colon adenocarcinoma metabolic reprogramming: trichostatin A as a case study. Biochim Biophys Acta. 2014; 1840:1634–1639.
17. Sobradillo D, Hernández-Morales M, Ubierna D, Moyer MP, Núñez L, Villalobos C. A reciprocal shift in transient receptor potential channel 1 (TRPC1) and stromal interaction molecule 2 (STIM2) contributes to Ca2+ remodeling and cancer hallmarks in colorectal carcinoma cells. J Biol Chem. 2014; 289:28765–28782.
18. Prevarskaya N, Ouadid-Ahidouch H, Skryma R, Shuba Y. Remodelling of Ca2+ transport in cancer: how it contributes to cancer hallmarks? Philos Trans R Soc Lond B Biol Sci. 2014; 369:20130097.
19. Núñez L, Valero RA, Senovilla L, Sanz-Blasco S, García-Sancho J, Villalobos C. Cell proliferation depends on mitochondrial Ca2+ uptake: inhibition by salicylate. J Physiol (Lond). 2006; 571:57–73.
20. Valero RA, Senovilla L, Núñez L, Villalobos C. The role of mitochondrial potential in control of calcium signals involved in cell proliferation. Cell Calcium. 2008; 44:259–269.
21. Muñoz E, Valero RA, Quintana A, Hoth M, Núñez L, Villalobos C. Non-steroidal anti-inflammatory drugs inhibit vascular smooth muscle cell proliferation by enabling the Ca2+-dependent inactivation of Ca2+ release-activated Ca2+/Orai channels normally prevented by mitochondria. J Biol Chem. 2011; 286:16186–16196.
22. Muñoz E, Hernández-Morales M, Sobradillo D, Rocher A, Núñez L, Villalobos C. Intracellular Ca2+ remodeling during the phenotypic journey of human coronary smooth muscle cells. Cell Calcium. 2013; 54:375–385.
23. Chubak J, Kamineni A, Buist DSM, Anderson ML, Whitlock EP. Aspirin use for the prevention of colorectal cancer: an updated systematic evidence review for the U.S. preventive services task force (2015) Rockville (MD): Agency for Healthcare Research and Quality (US); 2015 Sep.
24. Drew DA, Cao Y, Chan AT. Aspirin and colorectal cancer: the promise of precision chemoprevention. Nat Rev Cancer. 2016; 6:173–186.
25. Rogers KL, Stinnakre J, Agulhon C, Jublot D, Shorte SL, Kremer EJ, Brûlet P. Visualization of local Ca2+ dynamics with genetically encoded bioluminescent reporters. Eur J Neurosci. 2005; 21:597–610.
26. Criddle DN, Murphy J, Fistetto G, Barrow S, Tepikin AV, Neoptolemos JP, Sutton R, Petersen OH. Fatty acid ethyl esters cause pancreatic calcium toxicity via inositol trisphosphate receptors and loss of ATP synthesis. Gastroenterology. 2006; 130:781–793.
27. Bonnet S, Archer SL, Allalunis-Turner J, Haromy A, Beaulieu C, Thompson R, Lee CT, Lopaschuk GD, Puttagunta L, Bonnet S, Harry G, Hashimoto K, Porter CJ, et al. A mitochondria-K+ channel axis is suppressed in cancer and its normalization promotes apoptosis and inhibits cancer growth. Cancer Cell. 2007; 11:37–51.
28. Scatena R, Bottoni P, Botta G, Martorana GE, Giardina B. The role of mitochondria in pharmacotoxicology: a reevaluation of an old, newly emerging topic. Am J Physiol Cell Physiol 2007; 293:C12–21.
29. Sanz-Blasco S, Valero RA, Rodríguez-Crespo I, Villalobos C, Núñez L. Mitochondrial Ca2+ overload underlies Aß oligomers neurotoxicity providing an unexpected mechanism of neuroprotection by NSAIDs. PLoS ONE. 2008; 3:e2718.
30. Calvo M, Sanz-Blasco S, Caballero E, Villalobos C, Núñez L. Susceptibility to excitotoxicity in aged hippocampal cultures and neuroprotection by non-steroidal anti-inflammatory drugs: role of mitochondrial calcium. J Neurochem. 2015; 132 :403–417.
31. Calvo-Rodríguez M, García-Durillo M, Villalobos C, Núñez L. Aging enables Ca2+ overload and apoptosis induced by amyloid ß oligomers in rat hippocampal neurons: neuroprotection by non-steroidal anti-inflammatory drugs and R-flurbiprofen in aging neurons. J Alzheimers Dis. 2016; 54:207–221.
32. Villalobos C, Núñez L, Montero M, García AG, Alonso MT, Chamero P, Alvarez J, García-Sancho J. Redistribution of Ca2+ among cytosol and organella during stimulation of bovine chromaffin cells. FASEB J. 2002; 16:343–353.
33. Rizzuto R, Duchen MR, Pozzan T. Flirting in little space: the ER/mitochondria Ca2+ liaison. Sci STKE. 2004; 215 re1.
34. de Brito OM, Scorrano L. Mitofusin 2 tethers endoplasmic reticulum to mitochondria. Nature. 2008; 456:605–610.
35. Arnaudeau S, Kelley WL, Walsh JV Jr, Demaurex N. Mitochondria recycle Ca2+ to the endoplasmic reticulum and prevent the depletion of neighboring endoplasmic reticulum regions. J Biol Chem. 2001; 276:29430–29439.
36. Malli R, Frieden M, Osibow K, Zoratti C, Mayer M, Demaurex N, Graier WF. Sustained Ca2+ transfer across mitochondria is essential for mitochondrial Ca2+ buffering, sore-operated Ca2+ entry, and Ca2+ store refilling. J Biol Chem. 2003; 278:44769–44779.
37. Parekh AB. Mitochondrial regulation of store-operated CRAC channels. Cell Calcium. 2008; 44:6–13.
38. Quintana A, Schwarz EC, Schwindling C, Lipp P, Kaestner L, Hoth M. Sustained activity of calcium release-activated calcium channels requires translocation of mitochondria to the plasma membrane. J Biol Chem. 2006; 281:40302–40309.
39. Schwindling C, Quintana A, Krause E, Hoth M. Mitochondria positioning controls local calcium influx in T cells. J Immunol. 2010; 184:184–190.
40. Naghdi S, Waldeck-Weiermair M, Fertschai I, Poteser M, Graier WF, Malli R. Mitochondrial Ca2+ uptake and not mitochondrial motility is required for STIM1-Orai1-dependent store-operated Ca2+ entry. J Cell Sci. 2010; 123:2553–2564.
41. Frieden M, James D, Castelbou C, Danckaert A, Martinou JC, Demaurex N. Ca2+ homeostasis during mitochondrial fragmentation and perinuclear clustering induced by hFis1. J Biol Chem. 2004; 279:22704–22714.
42. Mills KM, Brocardo MG, Henderson BR. APC binds the Miro/Milton motor complex to stimulate transport of mitochondria to the plasma membrane. Mol Biol Cell. 2016; 27:466–482.
43. Ben-Kasus Nissim T, Zhang X, Elazar A, Roy S, Stolwijk JA, Zhou Y, Motiani RK, Gueguinou M, Hempel N, Hershfinkel M, Gill DL, Trebak M, Sekler I. Mitochondria control store-operated Ca2+ entry through Na+ and redox signals. EMBO J. 2017; 36:797–815
44. Guéguinou M, Harnois T, Crottes D, Uguen A, Deliot N, Gambade A, Chantôme A, Haelters JP, Jaffrès PA, Jourdan ML, Weber G, Soriani O, Bougnoux P, et al. SK3/TRPC1/Orai1 complex regulates SOCE-dependent colon cancer cell migration: a novel opportunity to modulate anti-EGFR mAb action by the alkyl-lipid Ohmline. Oncotarget. 2016; 7:36168–36184.
45. Bondarenko AI, Jean-Quartier C, Parichatikanond W, Alam MR, Waldeck-Weiermair M, Malli R, Graier WF. Mitochondrial Ca2+ uniporter (MCU)-dependent and MCU-independent Ca2+ channels coexist in the inner mitochondrial membrane. Pflugers Arch. 2014; 466:1411–1420.