
INTRODUCTION
Glioma is the most common type of primary central nervous system tumors and has an invariable fatal outcome and dismal prognosis [1, 2]. Despite optimal treatment, the median survival is only 12–15 months for patients with glioblastomas and 2–5 years for patients with anaplastic gliomas [3, 4].
The etiology of glioma is still poorly understood. To date, exposure to ionizing radiation is the only clearly known environmental risk factor, which accounts for only a few cases [5]. In recent years, genome-wide association studies (GWASs) have been carried out to examine the genetic component of susceptibility to glioma. Significant associations were observed between glioma risk and single nucleotide polymorphisms (SNPs) in several genes, including telomerase reverse transcriptase (TERT), regulator of telomerase elongation helicase 1 (RTEL 1), cyclin dependent kinase inhibitor 2A-cyclin dependent kinase inhibitor 2B (CDKN2A-CDKN2B), coiled-coil domain containing 26 (CCDC26), tumor protein p53 (TP53), epidermal growth factor receptor (EGFR), and pleckstrin homology-like domain family B member 1 (PHLDB1) [6–8]. However, additional factors that contribute to glioma susceptibility require further investigation.
Angiogenesis is a critical process in the development of human glioma, which promotes survival, malignancy, and growth of tumor cells. The vascular endothelial growth factor A (VEGFA) gene, which is located on chromosome 6p12 and consists of 9 exons, is one of the most predominant mediators of pathologic angiogenesis. First, endothelial cells are stimulated by VEGF to proliferate and to migrate [9]. Second, expression of anti-apoptotic factors such as B cell CLL/lymphoma 2 (Bcl-2) and survivin is induced by VEGFA [10]. Third, VEGFA has been shown to increase vascular permeability allowing plasma proteins and other circulating macromolecules to cross the endothelium [11, 12]. Finally, numerous studies have demonstrated that VEGFA is also a possible mediator of tumor-induced angiogenesis in glioma [13, 14]. Based on these roles in glioma development, over 30 SNPs in the VEGFA gene have been described. Recent studies have examined the associations of specific SNPs in the VEGFA gene with glioma risk, but the significance of these findings remains unclear.
Due to insufficient population sizes, the statistical power of each study was relatively low, and evidence of the risk associated with each polymorphism was inconclusive. To increase statistical power, we conducted a systematic review and meta-analysis of published studies investigating the associations between VEGFA polymorphisms and glioma susceptibility.
RESULTS
Study characteristics
The search strategy identified 104 studies, but only 9 full-text articles were chosen for further detailed evaluation [15–23]. Five of these studies were excluded, including two that did not investigate the polymorphism of interest [18, 20], one that did not provide exact genotypes [15], and two that investigated the association between VEGFA polymorphisms and the prognosis of glioma [21, 22]. Finally, four studies [16, 17, 19, 23], including 2275 cases and 2475 controls, were included for analysis. The following is the breakdown of the number of studies and individuals that met our eligibility criteria for each polymorphism evaluated: rs3025039, 4 case-control studies with 2275 cases and 2475 controls; rs2010963, 3 case-control studies with 2115 cases and 2155 controls; rs3024994, 2 case-control studies with 1235 cases and 1275 controls; rs1413711, 2 case-control studies with 1235 cases and 1275 controls; rs833069, 2 case-control studies with 1235 cases and 1275 controls; rs3025010, 2 case-control studies with 1235 cases and 1275 controls; rs3025030, 2 case-control studies with 1235 cases and 1275 controls; and rs3025035, 2 case-control studies with 1235 cases and 1275 controls (Table 1). All studies scored a value ≥ 7 (high-quality) as determined in the Newcastle-Ottawa Scale, and all individuals were of Chinese descent.
Table 1: Characteristics of individual studies evaluating association between VEGFA polymorphisms and glioma risk
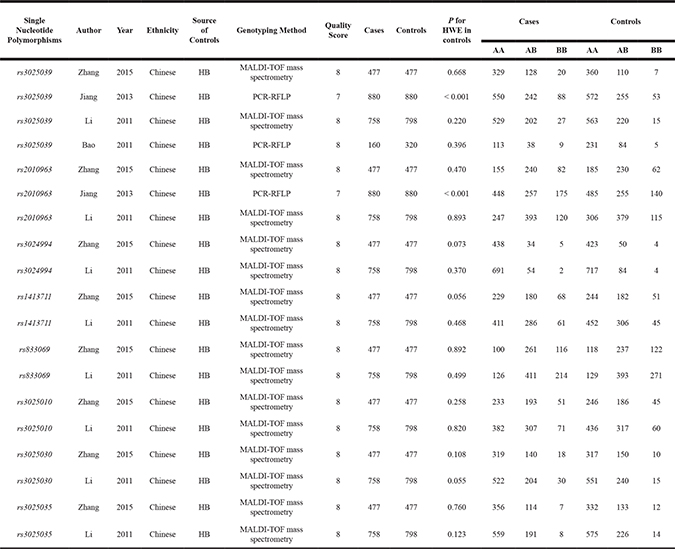
HB, hospital-based; HWE, Hardy-Weinberg Equilibrium; MALDI-TOF, matrix assisted laser desorption ionization time-of-flight; PCR-RFLP, polymerase chain reaction-restriction fragment length polymorphism.
Quantitative synthesis
Heterogeneity among studies, as measured by the Q test and the I2 statistic, was not significant for any VEGFA polymorphism (Table 2). Therefore, the fixed-effect model and the Mantel-Haenszel method were used to calculate the pooled OR.
Table 2: ORs and 95% CI for association of VEGFA polymorphisms with glioma susceptibility under different genetic models
Genetic models |
N |
OR [95% CI] |
P (OR) |
Model (method) |
I-square (%) |
P (H) |
P (Begg) |
P (Egger) |
|---|---|---|---|---|---|---|---|---|
rs3025039 |
||||||||
Allele contrast |
4 |
1.209 [1.088–1.343] |
< 0.001 |
F (M-H) |
0.0 |
0.425 |
0.734 |
0.600 |
Dominant model |
4 |
1.131 [1.000–1.280] |
0.050 |
F (M-H) |
0.0 |
0.455 |
1.000 |
0.713 |
Recessive model |
4 |
1.973 [1.489–2.615] |
< 0.001 |
F (M-H) |
0.0 |
0.456 |
0.089 |
0.047 |
Homozygous model |
4 |
1.982 [1.491–2.635] |
< 0.001 |
F (M-H) |
0.0 |
0.424 |
0.089 |
0.054 |
Heterozygous model |
4 |
1.028 [0.902–1.171] |
0.677 |
F (M-H) |
0.0 |
0.463 |
1.000 |
0.838 |
rs2010963 |
||||||||
Allele contrast |
3 |
1.197 [1.096–1.308] |
< 0.001 |
F (M-H) |
0.0 |
0.837 |
1.000 |
0.450 |
Dominant model |
3 |
1.247 [1.102–1.411] |
< 0.001 |
F (M-H) |
0.0 |
0.764 |
0.296 |
0.382 |
Recessive model |
3 |
1.256 [1.067–1.479] |
0.006 |
F (M-H) |
0.0 |
0.572 |
1.000 |
0.818 |
Homozygous model |
3 |
1.375 [1.153–1.639] |
< 0.001 |
F (M-H) |
0.0 |
0.724 |
1.000 |
0.458 |
Heterozygous model |
3 |
1.197 [1.046–1.369] |
0.009 |
F (M-H) |
0.0 |
0.553 |
1.000 |
0.774 |
rs3024994 |
||||||||
Allele contrast |
2 |
0.698 [0.539–0.904] |
0.006 |
F (M-H) |
0.0 |
0.670 |
1.000 |
- |
Dominant model |
2 |
0.675 [0.514–0.886] |
0.005 |
F (M-H) |
0.0 |
0.847 |
1.000 |
- |
Recessive model |
2 |
0.901 [0.325–2.497] |
0.840 |
F (M-H) |
0.0 |
0.441 |
1.000 |
- |
Homozygous model |
2 |
0.868 [0.313–2.409] |
0.786 |
F (M-H) |
0.0 |
0.442 |
1.000 |
- |
Heterozygous model |
2 |
0.663 [0.501–0.878] |
0.004 |
F (M-H) |
0.0 |
0.958 |
1.000 |
- |
rs1413711 |
||||||||
Allele contrast |
2 |
1.143 [1.010–1.293] |
0.034 |
F (M-H) |
0.0 |
0.768 |
1.000 |
- |
Dominant model |
2 |
1.105 [0.944- 1.293] |
0.213 |
F (M-H) |
0.0 |
0.798 |
1.000 |
- |
Recessive model |
2 |
1.430 [1.083–1.888] |
0.012 |
F (M-H) |
0.0 |
0.833 |
1.000 |
- |
Homozygous model |
2 |
1.455 [1.092–1.940] |
0.011 |
F (M-H) |
0.0 |
0.870 |
1.000 |
- |
Heterozygous model |
2 |
1.037 [0.878–1.225] |
0.666 |
F (M-H) |
0.0 |
0.887 |
1.000 |
- |
rs833069 |
||||||||
Allele contrast |
2 |
0.944 [0.844–1.055] |
0.308 |
F (M-H) |
56.3 |
0.131 |
1.000 |
- |
Dominant model |
2 |
1.077 [0.881–1.316] |
0.471 |
F (M-H) |
32.4 |
0.224 |
1.000 |
- |
Recessive model |
2 |
0.823 [0.691–0.979] |
0.028 |
F (M-H) |
11.2 |
0.288 |
1.000 |
- |
Homozygous model |
2 |
0.924 [0.731–1.167] |
0.505 |
F (M-H) |
44.7 |
0.179 |
1.000 |
- |
Heterozygous model |
2 |
1.166 [0.944–1.439] |
0.155 |
F (M-H) |
0.0 |
0.373 |
1.000 |
- |
rs3025010 |
||||||||
Allele contrast |
2 |
1.125 [0.996–1.270] |
0.059 |
F (M-H) |
0.0 |
0.774 |
1.000 |
- |
Dominant model |
2 |
1.133 [0.969–1.325] |
0.116 |
F (M-H) |
0.0 |
0.875 |
1.000 |
- |
Recessive model |
2 |
1.231 [0.936–1.618] |
0.137 |
F (M-H) |
0.0 |
0.677 |
1.000 |
- |
Homozygous model |
2 |
1.284 [0.968–1.704] |
0.083 |
F (M-H) |
0.0 |
0.679 |
1.000 |
- |
Heterozygous model |
2 |
1.102 [0.934–1.299] |
0.250 |
F (M-H) |
0.0 |
0.959 |
1.000 |
- |
rs3025030 |
||||||||
Allele contrast |
2 |
1.048 [0.906–1.212] |
0.526 |
F (M-H) |
0.0 |
0.959 |
1.000 |
- |
Dominant model |
2 |
0.974 [0.823–1.151] |
0.754 |
F (M-H) |
0.0 |
0.941 |
1.000 |
- |
Recessive model |
2 |
2.037 [1.248–3.324] |
0.004 |
F (M-H) |
0.0 |
0.734 |
1.000 |
- |
Homozygous model |
2 |
1.980 [1.210–3.240] |
0.007 |
F (M-H) |
0.0 |
0.748 |
1.000 |
- |
Heterozygous model |
2 |
0.909 [0.764–1.081] |
0.280 |
F (M-H) |
0.0 |
0.855 |
1.000 |
- |
rs3025035 |
||||||||
Allele contrast |
2 |
0.829 [0.709–0.969] |
0.019 |
F (M-H) |
0.0 |
0.603 |
1.000 |
- |
Dominant model |
2 |
0.824 [0.692–0.981] |
0.030 |
F (M-H) |
0.0 |
0.618 |
1.000 |
- |
Recessive model |
2 |
0.595 [0.313–1.128] |
0.112 |
F (M-H) |
0.0 |
0.932 |
1.000 |
- |
Homozygous model |
2 |
0.567 [0.298–1.078] |
0.084 |
F (M-H) |
0.0 |
0.906 |
1.000 |
- |
Heterozygous model |
2 |
0.843 [0.705–1.007] |
0.059 |
F (M-H) |
0.0 |
0.655 |
1.000 |
- |
OR, odds ratio; CI, confidence intervals; N, number of included studies; F, fixed-effect model; M-H, Mantel-Haenszel method; P (H), P for heterogeneity. P values < 0.05 were considered as statistically significant, and are highlighted in bold font in the table.
The minor allele of VEGFA rs3025039 was related to a significantly increased glioma risk under the allele contrast (OR = 1.209, 95% CI = 1.088–1.343, P < 0.001), recessive (OR = 1.973, 95% CI = 1.489–2.615, P < 0.001), and homozygous models (OR = 1.982, 95% CI = 1.491–2.635, P < 0.001) (Figure 1A). A significant association between polymorphism rs2010963 and glioma susceptibility was observed under all genetic models: allele contrast (OR = 1.197, 95% CI = 1.096–1.308, P < 0.001); dominant (OR = 1.247, 95% CI = 1.102–1.411, P < 0.001); recessive (OR = 1.256, 95% CI = 1.067–1.479, P = 0.006); homozygous (OR = 1.375, 95% CI = 1.153–1.639, P < 0.001); and heterozygous (OR = 1.197, 95% CI = 1.046–1.369, P = 0.009) (Figure 1B). The minor allele of polymorphism rs3024994 was associated with decreased glioma risk under the allele contrast (OR = 0.698, 95% CI = 0.539–0.904, P = 0.006), dominant (OR = 0.675, 95% CI = 0.514–0.886, P = 0.005), and homozygous models (OR = 0.663, 95% CI = 0.501–0.878, P = 0.004). Polymorphism rs3025030 was significantly associated with glioma susceptibility in the recessive (OR = 2.037, 95% CI = 1.248–3.324, P = 0.004) and homozygous models (OR = 1.980, 95% CI = 1.210–3.240, P = 0.007). Moreover, significant impacts of polymorphisms rs1413711 and rs3025035 on glioma susceptibility were observed although neither of the included studies showed any positive associations (Figure 2): for rs1413711, allele contrast (OR = 1.143, 95% CI = 1.010–1.293, P = 0.034), recessive (OR = 1.430, 95% CI = 1.083–1.888, P = 0.012), and homozygous models (OR = 1.455, 95% CI = 1.092–1.940, P = 0.011); for rs3025035, allele contrast (OR = 0.829, 95% CI = 0.709–0.969, P = 0.019) and dominant models (OR = 0.824, 95% CI = 0.692–0.981, P = 0.030). However, no significant associations were identified for polymorphisms rs3025010 or rs833069, except in the recessive model, and glioma susceptibility (Table 2).
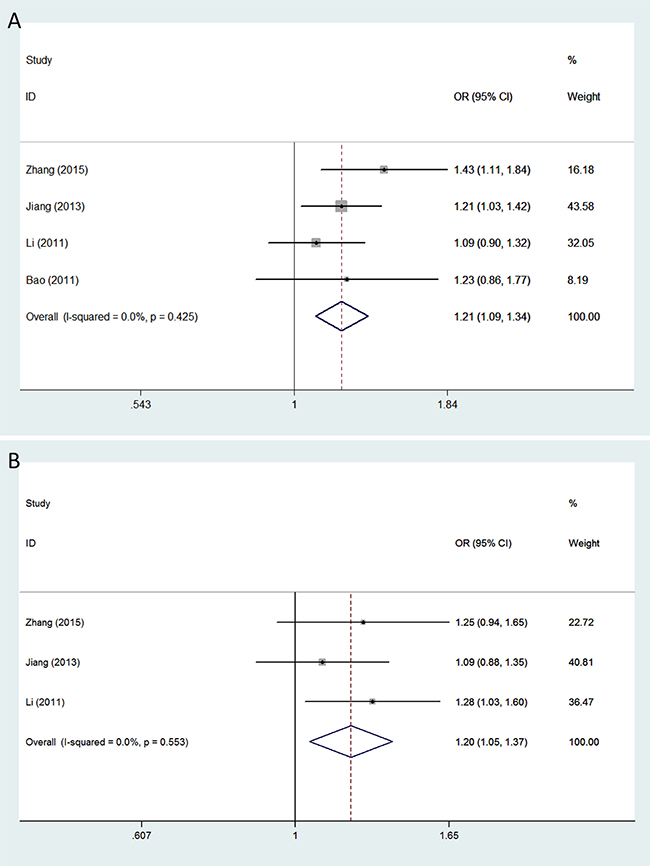
Figure 1: Forest plots of glioma risk associated with VEGFA polymorphisms rs3025039 and rs2010963. Models represented include (A) rs3025039 (allele contrast model) and (B) rs2010963 (heterozygous model). The area of the squares reflects the weight (inverse of the variance). The diamond represents the summary OR and 95% CI.
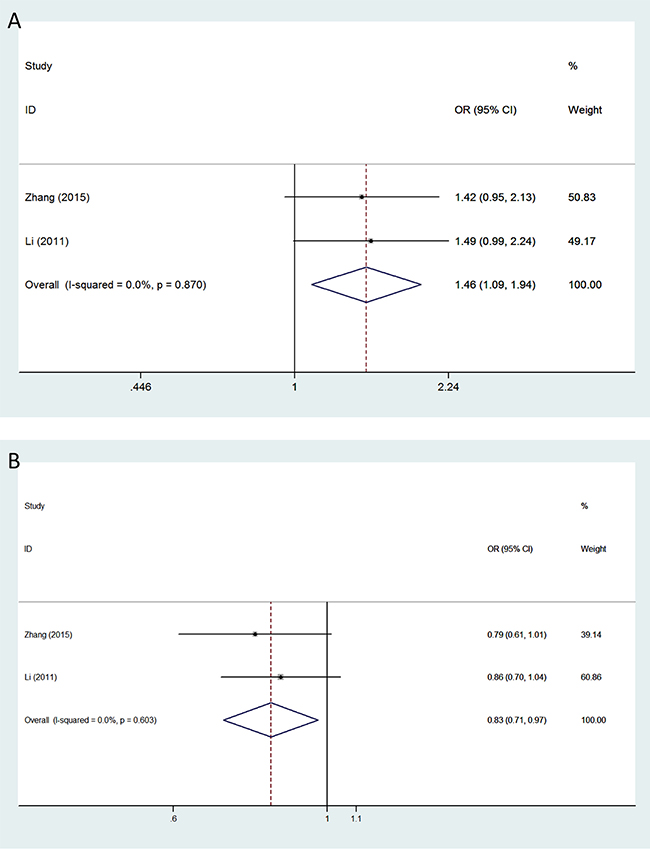
Figure 2: Forest plots of glioma risk in different genetic models associated with VEGFA polymorphisms rs1413711 and rs3025035. Models represented include (A) rs1413711 (homozygous model) and (B) rs3025035 (allele contrast model). The area of the squares reflects the weight (inverse of the variance). The diamond represents the summary OR and 95% CI.
Subgroup analysis
Because of the limited number of eligible studies, stratified analysis on the basis of genotyping method and Hardy-Weinberg equilibrium (HWE) in controls was only performed on rs3025039. A significant association between VEGFA polymorphism rs3025039 and glioma susceptibility was identified in HWE group under the allele contrast (OR = 1.211, 95% CI = 1.053–1.392, P = 0.007), recessive (OR = 2.451, 95% CI = 1.537–3.907, P < 0.001), and homozygous models (OR = 2.482, 95% CI = 1.554–3.964, P < 0.001) (Table 3).
Table 3: Subgroup analyses for association of VEGFA rs3025039 with glioma susceptibility under different genetic models
Subgroups |
N |
OR [95% CI] |
P (OR) |
Model (method) |
I-square (%) |
P (H) |
P (Begg) |
P (Egger) |
|---|---|---|---|---|---|---|---|---|
Allele contrast |
||||||||
Overall |
4 |
1.209 [1.088–1.343] |
< 0.001 |
F (M-H) |
0.0 |
0.425 |
0.734 |
0.600 |
MALDI-TOF mass spectrometry |
2 |
1.207 [1.037–1.404] |
0.015 |
F (M-H) |
64.0 |
0.096 |
- |
- |
PCR-RFLP |
2 |
1.211 [1.047–1.401] |
0.010 |
F (M-H) |
0.0 |
0.919 |
- |
- |
HWE |
3 |
1.211 [1.053–1.392] |
0.007 |
F (M-H) |
28.3 |
0.248 |
- |
- |
Dominant model |
||||||||
Overall |
4 |
1.131 [1.000–1.280] |
0.050 |
F (M-H) |
0.0 |
0.455 |
1.000 |
0.713 |
MALDI-TOF mass spectrometry |
2 |
1.154 [0.971–1.371] |
0.105 |
F (M-H) |
59.9 |
0.114 |
- |
- |
PCR-RFLP |
2 |
1.108 [0.929–1.322] |
0.254 |
F (M-H) |
0.0 |
0.893 |
- |
- |
HWE |
3 |
1.143 [0.974–1.340] |
0.101 |
F (M-H) |
22.3 |
0.276 |
- |
- |
Recessive model |
||||||||
Overall |
4 |
1.973 [1.489–2.615] |
< 0.001 |
F (M-H) |
0.0 |
0.456 |
0.089 |
0.047 |
MALDI-TOF mass spectrometry |
2 |
2.254 [1.350–3.764] |
0.002 |
F (M-H) |
0.0 |
0.444 |
- |
- |
PCR-RFLP |
2 |
1.859 [1.327–2.605] |
< 0.001 |
F (M-H) |
40.8 |
0.194 |
- |
- |
HWE |
3 |
2.451 [1.537–3.907] |
< 0.001 |
F (M-H) |
0.0 |
0.528 |
- |
- |
Homozygous model |
||||||||
Overall |
4 |
1.982 [1.491–2.635] |
< 0.001 |
F (M-H) |
0.0 |
0.424 |
0.089 |
0.054 |
MALDI-TOF mass spectrometry |
2 |
2.297 [1.373–3.843] |
0.002 |
F (M-H) |
0.0 |
0.376 |
- |
- |
PCR-RFLP |
2 |
1.852 [1.315–2.608] |
< 0.001 |
F (M-H) |
37.4 |
0.206 |
- |
- |
HWE |
3 |
2.482 [1.554–3.964] |
< 0.001 |
F (M-H) |
0.0 |
0.504 |
- |
- |
Heterozygous model |
||||||||
Overall |
4 |
1.028 [0.902–1.171] |
0.677 |
F (M-H) |
0.0 |
0.463 |
1.000 |
0.838 |
MALDI-TOF mass spectrometry |
2 |
1.077 [0.901–1.288] |
0.416 |
F (M-H) |
48.8 |
0.162 |
- |
- |
PCR-RFLP |
2 |
0.975 [0.806–1.180] |
0.796 |
F (M-H) |
0.0 |
0.795 |
- |
- |
HWE |
3 |
1.054 [0.893–1.244] |
0.532 |
F (M-H) |
14.5 |
0.310 |
- |
- |
OR, odds ratio; CI, confidence intervals; N, number of included studies; F, fixed-effect model; M-H, Mantel-Haenszel method; P (H), P for heterogeneity; MALDI-TOF, matrix assisted laser desorption ionization time-of-flight; PCR-RFLP, polymerase chain reaction-restriction fragment length polymorphism. P values < 0.05 were considered as statistically significant and are highlighted in bold font in the table.
In the subgroup analysis based on the genotyping method, positive correlations were observed between the rs3025039 polymorphism and glioma susceptibility in both matrix assisted laser desorption ionization time-of-flight (MALDI-TOF) mass spectrometry and polymerase chain reaction-restriction fragment length polymorphism (PCR-RFLP) groups (Table 3).
Sensitivity analysis
To further validate the robustness of the outcomes, we conducted sensitivity analyses by repeating the pooled analysis while sequentially omitting each study included individually for all genetic models. Sequential removal of single studies did not result in significant changes in the combined ORs, suggesting that the results of this meta-analysis were stable and robust (data not shown).
Publication bias
No obvious asymmetry was observed in any of the Begg’s funnel plots, which indicates that publication bias was generally not influencing the results (Figure 3). All P values from the Egger’s and the Begg’s tests are listed in Table 2. The values are consistent with the absence of significant publication bias in the analysis of glioma risk and polymorphisms in most genotype models, except for rs3025039 in the recessive model. However, analysis with the trim and fill method demonstrated that the results of our study did not significantly change after adjusting for publication bias.
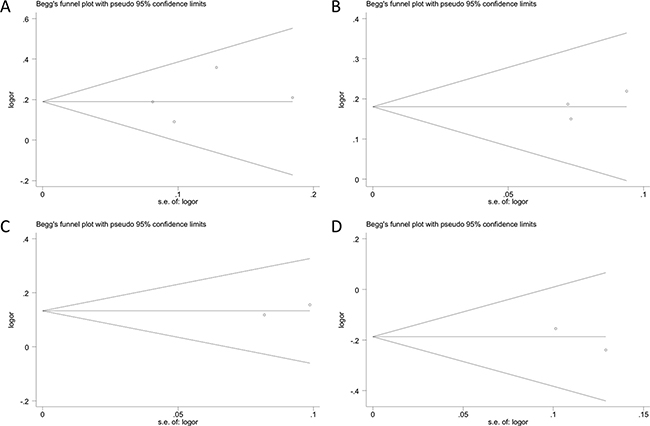
Figure 3: Begg’s funnel plots assessing evidence of publication bias from the eligible studies. Polymorphisms represented include (A) rs3025039, (B) rs2010963, (C) rs1413711, and (D) rs3025035 in allele contrast model. Each circle represents an individual study for the indicated association. No publication bias was observed.
DISCUSSION
In the present study, we assessed the contribution of 8 VEGFA SNPs to the risk of glioma and observed several positive associations at 6 SNPs. The minor alleles of polymorphisms rs3025039, rs2010963, and rs3025030 were associated with increased glioma risk. In contrast, a significant correlation was found between the minor allele of polymorphism rs3024994 and decreased susceptibility to glioma. Finally, polymorphisms rs1413711 and rs3025035 significantly influenced glioma risk, although no positive associations were observed for any of the included studies. These results demonstrate that VEGFA polymorphisms may be associated with glioma risk.
Tumor cells require angiogenesis to deliver nutrients and oxygen to support their rapid growth and high metabolism. VEGFA is an important pro-angiogenic factor for tumor progression because it promotes endothelial cell proliferation and remodels the extracellular matrix in blood vessels [24]. Elevated VEGFA expression is correlated with increased tumor microvessel density [25], high tumor grade, and poor prognosis in gliomas [26–28]. Of particular interest were polymorphisms located in regions of the gene that might possibly affect VEGFA RNA and/or protein levels. The polymorphisms rs2010963 and rs3025039 are located in the 5′-untranslated (5’-UTR) and 3’-untranslated (3′-UTR) regions of the VEGFA gene, respectively. Renner et al. first identified the VEGFA rs3025039 polymorphism and found that the T allele led to significantly lower plasma VEGFA levels in healthy young men [29]. A functional study revealed that variants of rs2010963 led to a higher production of the VEGFA precursor and VEGFA in several cell lines [30]. Such changes in VEGFA expression levels might contribute to glioma development. However, the exact mechanisms by which these polymorphisms affect glioma risk remains unclear.
The genetic variants within conventional regulatory regions, such as the 5′- and 3′-UTRs, have been the focus in most previous studies evaluating risk associations; however, accumulating evidence highlights the importance of intronic VEGFA polymorphisms as markers of disease susceptibility [31, 32]. Variants of rs3024994 and rs3025030 polymorphisms, which are located in intronic regions, were reported to lead to changes in potential binding sites of transcription factors. Such base pair changes may result in aberrant VEGFA expression and ultimately tumorigenesis [17].
No individual eligible studies focused on VEGFA polymorphisms rs1413711 and rs3025035 revealed any statistically significant positive correlations associated with glioma risk. Yet pooled analysis demonstrated that both polymorphisms might be related to glioma risk in Chinese. This discrepancy may result from the limited sample size of individual studies. Pooling of cases through meta-analysis however potentially reveals positive associations by narrowing the 95% CI. The polymorphisms rs1413711 and rs3025035 are also located in intronic regions of the VEGFA gene; however, no functional assay has been performed to investigate whether these polymorphisms influence VEGFA expression or function to date. Therefore, larger, preferably population-based case-control studies, as well as mechanistic studies involving variants of VEGFA on glioma progression, are warranted to validate our findings and to further investigate their roles in the development of glioma.
A sufficient number of cases and controls were pooled from different studies and a more accurate estimation of the associations between VEGFA SNPs and glioma risk compared to individual studies was evaluated. Moreover, we also revealed some positive associations that were not observed in previous work. However, the present study also has several limitations that should be taken into account when interpreting the findings. First, our analysis was limited to articles published in English and individuals of Chinese descent. Language bias may therefore exist, and it remains unclear whether these results can be generalized to other populations. Second, significant publication bias was observed in the analysis of glioma risk and VEGFA rs3025039 in the recessive model. The trim and fill method was carried out to adjust the pooled results. Finally, although subgroup analysis was performed based on genotyping method and HWE in controls, we did not design further analyses to investigate associations between VEGFA SNPs and glioma subtype because of limited data.
In conclusion, the statistical data presented in this study suggest that variants of the VEGFA gene might be important in promoting the development of glioma in Chinese. Subsequent studies with larger sample sizes using different ethnicities are needed to evaluate the association between VEGFA gene polymorphisms and various types of glioma.
MATERIALS AND METHODS
Search strategy
Data analyzed in this meta-analysis were provided by multiple case-control studies systematically identified by searching PubMed, Embase, the Cochrane Library, and OVID databases up to February 25, 2017. The standardized search strategy included the use of MeSH terms (“Vascular Endothelial Growth Factor A”, “Glioma”, and “Polymorphism, Single Nucleotide”) or key words related to polymorphism (polymorphism or polymorphisms or variation or variations or variant or variants or mutation or mutations or genotype or genotypes), the disease (glioma or gliomas or glioblastoma or glioblastomas or astrocytoma or astrocytomas or oligodendroglioma or oligodendrogliomas), or the gene (VEGF or vascular endothelial growth factor).
Inclusion criteria
Inclusion criteria for studies were the following: (1) a case-control or cohort study, (2) contain sufficient data for the evaluation of VEGF polymorphism on glioma risk, (3) published in English, and (4) performed in humans.
Data extraction
Two reviewers (P. Z. and A. C.) independently selected studies and extracted the following data from each study: first author’s surname, publication year, ethnicity, glioma types, numbers of cases and controls, and the genotype distributions of cases and controls. Any disagreements were resolved by discussion with a third investigator (Q. Q.).
Quality assessment
According to the Newcastle-Ottawa Scale and Agency for Healthcare Research and Quality (http://www.ohri.ca/programs/clinical_epidemiology/oxford.asp), the quality of the eligible studies was separately evaluated by two investigators (P. Z. and A. C.). Any disagreements were resolved by consensus through discussion.
Statistical analysis
We used STATA software 11.0 (STATA Corp., College Station, TX, USA) for all statistical analyses. The pooled odds ratios (OR) and 95% confidence intervals (CI) were calculated to evaluate the strength of associations between VEGFA polymorphisms and glioma risk under allele contrast (B vs A), dominant (BB + AB vs AA), recessive (BB vs AB + AA), homozygous (BB vs AA), and heterozygous models (AB vs AA). Between-study heterogeneity was assessed by the I2 statistic and Q test with P < 0.05 and I2 > 50% indicating evidence of heterogeneity. The fixed-effect (Mantel-Haenszel method) or random-effects model (DerSimonian-Laird method) was used to calculate the pooled effect estimates in the presence or absence of heterogeneity. Sensitivity analysis was conducted by sequentially excluding each study to assess the stability of the results. The Begg’s and the Egger’s tests were performed to assess publication bias. All tests were two-tailed, and P-values < 0.05 were considered statistically significant.
ACKNOWLEDGMENTS AND FUNDING
This study was supported by the Natural Science Foundation of China (grants 81572487, 81402060, and 81502164), the Shandong Provincial Foundation for Distinguished Young Scholars (grants BS2014YY033 and BS2012YY016), the Special Foundation for Taishan Scholars (grants ts20110814 and tshw201502056), the Department of Science & Technology of Shandong Province (grants 2015GGE27101 and 2015ZDXX0801A01), the Fundamental Research Funds of Shandong University (2016JC019), the China Postdoctoral Science Foundation (2014M551916), and the Norwegian Centre for International Cooperation in Education (SIU)(UTF-2014/10047).
CONFLICTS OF INTEREST
The authors declare no conflicts of interest.
REFERENCES
1. Ostrom QT, Bauchet L, Davis FG, Deltour I, Fisher JL, Langer CE, Pekmezci M, Schwartzbaum JA, Turner MC, Walsh KM, Wrensch MR, Barnholtz-Sloan JS. The epidemiology of glioma in adults: a “state of the science” review. Neuro Oncol. 2014; 16:896–913.
2. Ostrom QT, Gittleman H, Farah P, Ondracek A, Chen Y, Wolinsky Y, Stroup NE, Kruchko C, Barnholtz-Sloan JS. CBTRUS statistical report: Primary brain and central nervous system tumors diagnosed in the United States in 2006–2010. Neuro Oncol. 2013; 15:ii1–56.
3. Stupp R, Mason WP, van den Bent MJ, Weller M, Fisher B, Taphoorn MJ, Belanger K, Brandes AA, Marosi C, Bogdahn U, Curschmann J, Janzer RC, Ludwin SK, et al. Radiotherapy plus concomitant and adjuvant temozolomide for glioblastoma. N Engl J Med. 2005; 352:987–996.
4. Wen PY, Kesari S. Malignant gliomas in adults. N Engl J Med. 2008; 359:492–507.
5. Ohgaki H, Kleihues P. Epidemiology and etiology of gliomas. Acta Neuropathol. 2005; 109:93–108.
6. Shete S, Hosking FJ, Robertson LB, Dobbins SE, Sanson M, Malmer B, Simon M, Marie Y, Boisselier B, Delattre JY, Hoang-Xuan K, El Hallani S, Idbaih A, et al. Genome-wide association study identifies five susceptibility loci for glioma. Nat Genet. 2009; 41:899–904.
7. Wrensch M, Jenkins RB, Chang JS, Yeh RF, Xiao Y, Decker PA, Ballman KV, Berger M, Buckner JC, Chang S, Giannini C, Halder C, Kollmeyer TM, et al. Variants in the CDKN2B and RTEL1 regions are associated with high-grade glioma susceptibility. Nat Genet. 2009; 41:905–908.
8. Sanson M, Hosking FJ, Shete S, Zelenika D, Dobbins SE, Ma Y, Enciso-Mora V, Idbaih A, Delattre JY, Hoang-Xuan K, Marie Y, Boisselier B, Carpentier C, et al. Chromosome 7p11.2 (EGFR) variation influences glioma risk. Hum Mol Genet. 2011; 20:2897–2904.
9. Bernatchez PN, Soker S, Sirois MG. Vascular endothelial growth factor effect on endothelial cell proliferation, migration, and platelet-activating factor synthesis is Flk-1-dependent. J Biol Chem. 1999; 274:31047–31054.
10. Dvorak HF, Brown LF, Detmar M, Dvorak AM. Vascular permeability factor/vascular endothelial growth factor, microvascular hyperpermeability, and angiogenesis. Am J Pathol. 1995; 146:1029–1039.
11. Nagy JA, Benjamin L, Zeng H, Dvorak AM, Dvorak HF. Vascular permeability, vascular hyperpermeability and angiogenesis. Angiogenesis. 2008; 11:109–119.
12. Miletic H, Niclou SP, Johansson M, Bjerkvig R. Anti-VEGF therapies for malignant glioma: treatment effects and escape mechanisms. Expert Opin Ther Targets. 2009; 13:455–468.
13. Plate KH, Risau W. Angiogenesis in malignant gliomas. Glia. 1995; 15:339–347.
14. Plate KH, Breier G, Weich HA, Risau W. Vascular endothelial growth factor is a potential tumour angiogenesis factor in human gliomas in vivo. Nature. 1992; 359:845–848.
15. Andersson U, Schwartzbaum J, Wiklund F, Sjostrom S, Liu Y, Tsavachidis S, Ahlbom A, Auvinen A, Collatz-Laier H, Feychting M, Johansen C, Kiuru A, Lonn S, et al. A comprehensive study of the association between the EGFR and ERBB2 genes and glioma risk. Acta Oncol. 2010; 49:767–775.
16. Bao G, Wang M, Guo S, Han Y, Xu G. Vascular endothelial growth factor +936 C/T gene polymorphism and glioma risk in a Chinese Han population. Genet Test Mol Biomarkers. 2011; 15:103–106.
17. Li R, Zhao Y, Fan W, Chen H, Chen Y, Liu Y, Chen G, Zhou K, Huang F, Mao Y, Zhou L, Lu D, Shugart YY. Possible association between polymorphisms of human vascular endothelial growth factor A gene and susceptibility to glioma in a Chinese population. Int J Cancer. 2011; 128:166–175.
18. Xu GZ, Liu Y, Zhang Y, Yu J, Diao B. Correlation between VEGFR2 rs2071559 polymorphism and glioma risk among Chinese population. Int J Clin Exp Med. 2015; 8: 16724–16728.
19. Jiang H, Lian M, Xie J, Li J, Wang M. Three single nucleotide polymorphisms of the vascular endothelial growth factor (VEGF) gene and glioma risk in a Chinese population. J Int Med Res. 2013; 41:1484–1494.
20. Chen H, Wang W, Xingjie Z, Song X, Fan W, Keke Z, Chen G, Zhao Y, Mao Y, Lu D. Association between genetic variations of vascular endothelial growth factor receptor 2 and glioma in the Chinese Han population. J Mol Neurosci. 2012; 47:448–457.
21. Di Stefano AL, Labussiere M, Lombardi G, Eoli M, Bianchessi D, Pasqualetti F, Farina P, Cuzzubbo S, Gallego-Perez-Larraya J, Boisselier B, Ducray F, Cheneau C, Moglia A, et al. VEGFA SNP rs2010963 is associated with vascular toxicity in recurrent glioblastomas and longer response to bevacizumab. J Neurooncol. 2015; 121:499–504.
22. Sjostrom S, Wibom C, Andersson U, Brannstrom T, Broholm H, Johansen C, Collatz-Laier H, Liu Y, Bondy M, Henriksson R, Melin B. Genetic variations in VEGF and VEGFR2 and glioblastoma outcome. J Neurooncol. 2011; 104:523–527.
23. Zhang J, Yang J, Chen Y, Mao Q, Li S, Xiong W, Lin Y, Chen J, Ge J. Genetic Variants of VEGF (rs201963 and rs3025039) and KDR (rs7667298, rs2305948, and rs1870377) Are Associated with Glioma Risk in a Han Chinese Population: a Case-Control Study. Mol Neurobiol. 2015.
24. Sawaji Y, Sato T, Takeuchi A, Hirata M, Ito A. Anti-angiogenic action of hyperthermia by suppressing gene expression and production of tumour-derived vascular endothelial growth factor in vivo and in vitro. Br J Cancer. 2002; 86:1597–1603.
25. Chaudhry IH, O’Donovan DG, Brenchley PE, Reid H, Roberts IS. Vascular endothelial growth factor expression correlates with tumour grade and vascularity in gliomas. Histopathology. 2001; 39:409–415.
26. Knizetova P, Ehrmann J, Hlobilkova A, Vancova I, Kalita O, Kolar Z, Bartek J. Autocrine regulation of glioblastoma cell cycle progression, viability and radioresistance through the VEGF-VEGFR2 (KDR) interplay. Cell Cycle. 2008; 7:2553–2561.
27. Zhou YH, Tan F, Hess KR, Yung WK. The expression of PAX6, PTEN, vascular endothelial growth factor, and epidermal growth factor receptor in gliomas: relationship to tumor grade and survival. Clin Cancer Res. 2003; 9: 3369–3375.
28. Zhang SD, Leung KL, McCrudden CM, Kwok HF. The Prognostic Significance of Combining VEGFA, FLT1 and KDR mRNA Expressions in Brain Tumors. J Cancer. 2015; 6:812–818.
29. Renner W, Kotschan S, Hoffmann C, Obermayer-Pietsch B, Pilger E. A common 936 C/T mutation in the gene for vascular endothelial growth factor is associated with vascular endothelial growth factor plasma levels. J Vasc Res. 2000; 37:443–448.
30. Awata T, Inoue K, Kurihara S, Ohkubo T, Watanabe M, Inukai K, Inoue I, Katayama S. A common polymorphism in the 5′-untranslated region of the VEGF gene is associated with diabetic retinopathy in type 2 diabetes. Diabetes. 2002; 51:1635–1639.
31. Garcia-Closas M, Malats N, Real FX, Yeager M, Welch R, Silverman D, Kogevinas M, Dosemeci M, Figueroa J, Chatterjee N, Tardon A, Serra C, Carrato A, et al. Large-scale evaluation of candidate genes identifies associations between VEGF polymorphisms and bladder cancer risk. PLoS Genet. 2007; 3:e29.
32. Al-Kateb H, Mirea L, Xie X, Sun L, Liu M, Chen H, Bull SB, Boright AP, Paterson AD. Multiple variants in vascular endothelial growth factor (VEGFA) are risk factors for time to severe retinopathy in type 1 diabetes: the DCCT/EDIC genetics study. Diabetes. 2007; 56:2161–2168.