
INTRODUCTION
Short tandem repeats (STRs) are widely distributed in human genome and play a significant role in forensic DNA analysis. Autosomal STRs have been the most common genetic markers in forensic applications and could be used to solve most of the personal identification and paternity testing cases [1, 2]. However, Y-chromosomal STRs (Y-STRs) would be more helpful in some special cases, such as mixed stain detection for sexual-assault cases, the paternal migration history tracing [3], and so on, because STRs on the non-recombining region of Y-chromosome do not participate in meiotic recombination and are unaltered when inherited from father to son [4–6]. At present, autosomal STRs or Y-STRs are often used alone in forensic applications. However, when autosomal STRs and Y-STRs were co-amplification in a single fluorescence multiplex system, they would be useful in both personal identification and paternity testing cases, for those Y-STRs could be helpful in the determination of gender and the reconstruction of paternal lineage [7, 8].
Southern Shaanxi region is the south part of Shaanxi province, covering the area from the south of Qinling Mountains to the north of Ba Mountain with the Han River flowing through from west to east; Southern Shaanxi consists of three cities: Hanzhong, Ankang and Shangluo, from west to east where mainly reside the Han population [9, 10]. To further understand the genetic background of Southern Shaanxi Han population and provide population genetic data for forensic identification, we firstly studied 15 autosomal STR loci and 10 Y-STR loci together in Chinese Han population from Southern Shaanxi region, calculated the forensic parameters, and collected previously published population data with overlapping loci of both autosomal STRs and Y-STRs, to discuss the genetic relationships between the studied population and other populations.
RESULTS AND DISCUSSIONS
The analysis of allelic frequencies and forensic parameters for the 15 autosomal STRs
According to the results of Hardy-Weinberg equilibrium (HWE) tests (presented in Table 1), all the autosomal STR loci showed no deviations from HWE (p>0.05). Tests of linkage disequilibrium (LD) were performed for all pairs of autosomal STR loci and the results were shown in Table 2. No LD was observed at a significance level of 0.0033 (α = 0.05/15) after Bonferroni correction, which indicated these autosomal STR loci were relatively independent. As summarized in Table 3, there were totally 150 alleles found at the 15 autosomal STR loci in the Southern Shaanxi Han population. As summarized in Table 1, the observed heterozygosity (Ho) in the studied population ranged from 0.6075 (TPOX locus) to 0.8411 (D8S1179 and D18S51 loci). The loci D18S51 and TPOX showed the highest and lowest expected heterozygosity (He), respectively. The power of discrimination (PD) and power of exclusion (PE) ranged from 0.7944 (TPOX locus) to 0.9623 (D2S1338 locus); and 0.2999 (TPOX locus) to 0.6774 (D8S1179 and D18S51 loci), respectively. The combined PD and PE were 0.99999999999999998866 and 0.999998491, respectively. All the 15 autosomal STR loci were found to be highly polymorphic in Southern Shaanxi Han population and the high value, which indicated their large potentiality for forensic individual identification.
Table 1: Forensic efficiency parameters of 15 autosomal STR loci in Southern Shaanxi Han (n = 214; 108 males and 106 females)
Loci |
MP |
PD |
PIC |
PE |
TPI |
Ho |
He |
P |
|---|---|---|---|---|---|---|---|---|
D3S1358 |
0.1284 |
0.8716 |
0.6795 |
0.5058 |
1.9815 |
0.7477 |
0.7311 |
0.5469 |
D13S317 |
0.0762 |
0.9238 |
0.7753 |
0.6593 |
2.9722 |
0.8318 |
0.8079 |
0.3396 |
D7S820 |
0.0814 |
0.9186 |
0.7581 |
0.6060 |
2.5476 |
0.8037 |
0.7924 |
0.6354 |
D16S539 |
0.0742 |
0.9258 |
0.7677 |
0.6413 |
2.8158 |
0.8224 |
0.8020 |
0.4141 |
D19S433 |
0.0617 |
0.9383 |
0.7903 |
0.6235 |
2.6750 |
0.8131 |
0.8177 |
0.9201 |
TPOX |
0.2056 |
0.7944 |
0.5485 |
0.2999 |
1.2738 |
0.6075 |
0.6167 |
0.8143 |
TH01 |
0.1652 |
0.8348 |
0.6147 |
0.3808 |
1.5070 |
0.6682 |
0.6629 |
0.8320 |
D2S1338 |
0.0377 |
0.9623 |
0.8432 |
0.6593 |
2.9722 |
0.8318 |
0.8630 |
0.2174 |
CSF1PO |
0.1197 |
0.8803 |
0.6805 |
0.4593 |
1.7833 |
0.7196 |
0.7272 |
0.8481 |
vWA |
0.0717 |
0.9283 |
0.7706 |
0.6060 |
2.5476 |
0.8037 |
0.8047 |
0.9718 |
D5S818 |
0.0812 |
0.9188 |
0.7535 |
0.5973 |
2.4884 |
0.7991 |
0.7897 |
0.6879 |
FGA |
0.0413 |
0.9587 |
0.8361 |
0.6147 |
2.6098 |
0.8084 |
0.8559 |
0.0597 |
D8S1179 |
0.0426 |
0.9574 |
0.8321 |
0.6774 |
3.1471 |
0.8411 |
0.8541 |
0.6524 |
D21S11 |
0.0494 |
0.9506 |
0.8182 |
0.6683 |
3.0571 |
0.8364 |
0.8409 |
0.9216 |
D18S51 |
0.0401 |
0.9599 |
0.8468 |
0.6774 |
3.1471 |
0.8411 |
0.8658 |
0.3338 |
MP, matching probability; PD, power of discrimination; PIC, polymorphism information content; PE, probability of exclusion; TPI, typical paternity index; Ho, observed heterozygosity; He, expected heterozygosity; P, probability values of exact tests for Hardy–Weinberg equilibrium.
Table 2: P-value in pairwise linkage disequilibrium test at 15 autosomal STR loci in the Southern Shaanxi Han
Loci |
D18S51 |
D21S11 |
D8S1179 |
FGA |
D5S818 |
vWA |
CSF1PO |
D2S1338 |
TH01 |
TPOX |
D19S433 |
D16S539 |
D7S820 |
D13S317 |
|---|---|---|---|---|---|---|---|---|---|---|---|---|---|---|
D21S11 |
0.6296 |
|||||||||||||
D8S1179 |
0.5324 |
0.5499 |
||||||||||||
FGA |
0.9829 |
0.9916 |
0.5286 |
|||||||||||
D5S818 |
0.5533 |
0.3886 |
0.1205 |
0.2850 |
||||||||||
vWA |
0.7924 |
0.5526 |
0.6802 |
0.6905 |
0.8789 |
|||||||||
CSF1PO |
0.4312 |
0.0657 |
0.5942 |
0.3433 |
0.1912 |
0.6657 |
||||||||
D2S1338 |
0.2196 |
0.0498 |
0.1329 |
0.5224 |
0.5909 |
0.2480 |
0.1339 |
|||||||
TH01 |
0.2324 |
0.8556 |
0.2354 |
0.0941 |
0.1334 |
0.1961 |
0.5523 |
0.7025 |
||||||
TPOX |
0.7221 |
0.8615 |
0.9330 |
0.5244 |
0.4134 |
0.0419 |
0.2683 |
0.0599 |
0.6112 |
|||||
D19S433 |
0.8361 |
0.6447 |
0.4450 |
0.9006 |
0.6020 |
0.5437 |
0.5998 |
0.0914 |
0.5520 |
0.5389 |
||||
D16S539 |
0.1618 |
0.0346 |
0.3984 |
0.4926 |
0.0547 |
0.7402 |
0.7314 |
0.6914 |
0.8953 |
0.6968 |
0.9795 |
|||
D7S820 |
0.2090 |
0.7743 |
0.5845 |
0.6665 |
0.8183 |
0.2245 |
0.5539 |
0.7382 |
0.1664 |
0.7873 |
0.7797 |
0.9245 |
||
D13S317 |
0.3965 |
0.8040 |
0.9324 |
0.8956 |
0.3898 |
0.9323 |
0.8857 |
0.7502 |
0.9283 |
0.7024 |
0.3950 |
0.2245 |
0.9659 |
|
D3S1358 |
0.2112 |
0.3818 |
0.7652 |
0.9047 |
0.2617 |
0.6080 |
0.8065 |
0.2471 |
0.0870 |
0.1014 |
0.1553 |
0.0909 |
0.3529 |
0.8748 |
Table 3: Allele frequency distributions of 15 autosomal STR loci in Southern Shaanxi Han (n = 214; 108 males and 106 females)
Allele |
D3S1358 |
Allele |
FGA |
Allele |
D21S11 |
Allele |
D19S433 |
Allele |
D18S51 |
Allele |
D2S1338 |
Allele |
D5S818 |
|---|---|---|---|---|---|---|---|---|---|---|---|---|---|
14 |
0.0467 |
16 |
0.0023 |
16 |
0.0047 |
11 |
0.0023 |
10 |
0.0023 |
16 |
0.0187 |
7 |
0.0304 |
15 |
0.3341 |
18 |
0.0140 |
28 |
0.0607 |
12 |
0.0491 |
12 |
0.0467 |
17 |
0.0841 |
9 |
0.0701 |
16 |
0.3248 |
19 |
0.0607 |
28.2 |
0.0140 |
12.2 |
0.0070 |
13 |
0.2009 |
18 |
0.0771 |
10 |
0.2126 |
17 |
0.2220 |
20 |
0.0491 |
29 |
0.2336 |
13 |
0.2921 |
14 |
0.1939 |
19 |
0.1916 |
11 |
0.3014 |
18 |
0.0607 |
20.2 |
0.0023 |
30 |
0.2570 |
13.2 |
0.0304 |
15 |
0.1706 |
20 |
0.1192 |
12 |
0.2243 |
19 |
0.0093 |
21 |
0.0864 |
30.2 |
0.0164 |
14 |
0.2360 |
16 |
0.1145 |
21 |
0.0164 |
13 |
0.1472 |
20 |
0.0023 |
21.2 |
0.0047 |
30.3 |
0.0047 |
14.2 |
0.1215 |
17 |
0.0935 |
22 |
0.0514 |
14 |
0.0117 |
Allele |
D13S317 |
22 |
0.1379 |
31 |
0.0981 |
15 |
0.0607 |
18 |
0.0374 |
23 |
0.2033 |
15 |
0.0023 |
8 |
0.2570 |
23 |
0.2593 |
31.2 |
0.0911 |
15.2 |
0.1472 |
19 |
0.0584 |
24 |
0.1706 |
||
9 |
0.1449 |
23.2 |
0.0070 |
31.3 |
0.0023 |
16 |
0.0093 |
20 |
0.0444 |
25 |
0.0584 |
||
10 |
0.1262 |
24 |
0.1776 |
32 |
0.0304 |
16.2 |
0.0397 |
21 |
0.0117 |
26 |
0.0070 |
||
11 |
0.2453 |
24.2 |
0.0164 |
32.2 |
0.1308 |
17 |
0.0023 |
22 |
0.0117 |
27 |
0.0023 |
||
12 |
0.1729 |
25 |
0.1168 |
33 |
0.0023 |
17.2 |
0.0023 |
23 |
0.0023 |
Allele |
TH01 |
||
13 |
0.0537 |
25.2 |
0.0047 |
33.2 |
0.0467 |
Allele |
D8S1179 |
24 |
0.0070 |
6 |
0.1075 |
||
Allele |
D7S820 |
26 |
0.0491 |
34.2 |
0.0047 |
8 |
0.0023 |
25 |
0.0047 |
7 |
0.2570 |
||
7 |
0.0047 |
27 |
0.0117 |
35.2 |
0.0023 |
9 |
0.0023 |
Allele |
CSF1PO |
8 |
0.0444 |
||
8 |
0.1449 |
Allele |
D16S539 |
Allele |
vWA |
10 |
0.1168 |
7 |
0.0070 |
9 |
0.5070 |
||
9 |
0.0701 |
8 |
0.0093 |
14 |
0.2360 |
11 |
0.1005 |
9 |
0.0374 |
9.3 |
0.0444 |
||
9.1 |
0.0047 |
9 |
0.2407 |
15 |
0.0164 |
12 |
0.0888 |
10 |
0.2547 |
10 |
0.0397 |
||
10 |
0.1659 |
10 |
0.1449 |
16 |
0.1799 |
13 |
0.2196 |
11 |
0.1963 |
Allele |
TPOX |
||
10.1 |
0.0047 |
11 |
0.2617 |
17 |
0.2523 |
14 |
0.1846 |
12 |
0.4065 |
8 |
0.5210 |
||
11 |
0.3107 |
12 |
0.1963 |
18 |
0.1729 |
15 |
0.1519 |
13 |
0.0771 |
9 |
0.1192 |
||
12 |
0.2430 |
13 |
0.1238 |
19 |
0.1308 |
16 |
0.1121 |
14 |
0.0117 |
10 |
0.0234 |
||
13 |
0.0467 |
14 |
0.0210 |
20 |
0.0093 |
17 |
0.0187 |
15 |
0.0047 |
11 |
0.3154 |
||
14 |
0.0047 |
15 |
0.0023 |
21 |
0.0023 |
18 |
0.0023 |
23 |
0.0047 |
12 |
0.0210 |
Interpopulation differentiations based on the 15 overlapping autosomal STRs
Fst statistics is one of the most widely used measures for genetic differentiation and plays a central role in genetic studies [11]. Reference populations including Hui [12,13], Uygur [14, 15], Eastern Han (from Zhejiang, China) [16, 17], Salar [18, 19], Miao [20, 21], Tibetan [22, 23], Yi [21, 24], Shandong Han [25, 26], Korean [27, 28], Bangladeshis [29, 30], Serbian [31, 32], Xibe [33, 34], Dong [21, 35], Maonan [21, 36], Moroccan [37, 38], Croatian [39, 40], Nepalese [41, 42], Jilin Han [43, 44] and Liaoning Han [45, 46] were used for population genetic analysis based on the same of autosomal STRs or Y-STR loci, respectively. The pairwise Fst and p values based on 15 STR loci between Southern Shaanxi Han population and other 19 populations were shown in Supplmentary Table 1. The statistically significant differences (p<0.05/15=0.0033 after Bonferroni correction) were found between the Southern Shaanxi Han population and Serbian, Moroccan, Croatian, Miao, Shandong Han, Yi, Bangladeshis, Nepalese, Uygur and Dong populations at 11, 11, 10, 4, 3, 2, 2, 2, 1 and 1 loci, respectively. And then there was no significant difference obtained between Southern Shaanxi Han population and Eastern Han, Liaoning Han, Jilin Han, Hui, Salar, Tibetan, Xibe, Maonan and Korean populations, which indicated there were relatively close genetic distances among them.
Principal component analysis based on the 15 overlapping autosomal STRs
The principal component analysis (PCA) was performed among the Southern Shaanxi Han population and other 19 populations using the allelic frequencies of the 15 overlapping autosomal STR loci. The PCA result was shown in Figure 1. The first and second components accounted for 44.00 and 12.73% of the total variance, respectively; and the cumulative contribution of them was 56.73%, which was over half of the total variance. According to Figure 1, Southern Shaanxi Han was located in left part, close to Eastern Han, Liaoning Han and Jilin Han population. Moroccan, Croatian and Serbian gathered in the right edge of the plot, which were relatively far away from Southern Shaanxi Han.
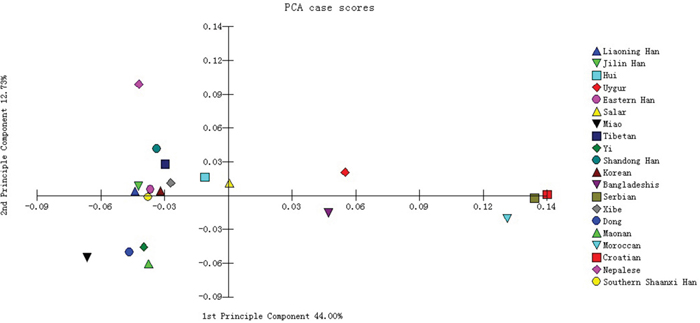
Figure 1: Principal component analysis based on the 15 overlapping autosomal STR loci of Southern Shaanxi Han population and 19 reference populations.
Phylogenetic analysis based on the 15 overlapping autosomal STRs
The neighbor-joining tree (NJ tree) of the Southern Shaanxi Han and other 19 populations based on allelic frequencies of 15 overlapping autosomal STR loci was shown in Figure 2. In the NJ tree, the Southern Shaanxi Han population was also observed to be close with the Eastern Han and Jilin Han population. However, Serbian, Croatian and Moroccan populations were located furthest away from Southern Shaanxi Han population. The phylogenetic result was consistent with the results of above-mentioned PCA.
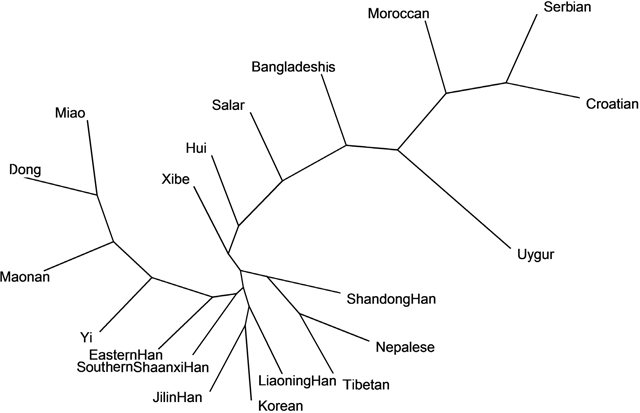
Figure 2: The neighbor-joining tree based on the 15 overlapping autosomal STR loci of Southern Shaanxi Han population and 19 reference populations.
Allelic frequencies and haplotypic diversities of the 10 Y-STR loci
Allelic frequencies and Gene diversity (GD) values of the 10 Y-STR loci in 108 Southern Shaanxi Han male individuals were shown in Table 4, the allelic frequencies ranged from 0.0093 to 0.7407. GD values of all the loci were higher than 0.5 with the exceptions of DYS391 (0.4010) and DYS438 (0.3813) loci. The highest GD value was obtained at loci DYS385a, b with a value of 0.9983. The discriminatory capacity (DC) and haplotypic diversities (HD) values of the 10 Y-STR loci were 0.9259 and 0.9983, respectively. Haplotypic results of the 10 Y-STR loci were shown in Supplmentary Table 2. One hundred different haplotypes were obtained, 94 of which were unique. We compared the 10 Y-STR haplotype data with the haplotype database in YHRD (http://www.yhrd.org) (Released March 01, 2017). Forty-one haplotypes detected in the Southern Shaanxi Han population were found with no matches in 131889 Haplotypes. Sixty-three haplotypes were found with matches in 31445 East Asian-Sino-Tibetan-Chinese and 17 haplotypes were found with matches in 3248 East Asian-Sino-Tibetan-Tibeto-Burman.
Table 4: Allele frequencies and Gene diversities (GD) for the 10 Y-STR loci in Southern Shaanxi Han (n = 108)
Allele |
DYS635 |
DYS456 |
DYS458 |
DYS391 |
DYS392 |
DYS390 |
DYS393 |
DYS438 |
DYS385a,b |
|||
|---|---|---|---|---|---|---|---|---|---|---|---|---|
8 |
0.0185 |
10,12 |
0.0093 |
13,17 |
0.0093 |
|||||||
9 |
0.0185 |
10,17 |
0.0185 |
13,18 |
0.0926 |
|||||||
10 |
0.7407 |
0.0093 |
0.7593 |
11,11 |
0.0370 |
13,19 |
0.0278 |
|||||
11 |
0.2315 |
0.1481 |
0.2130 |
11,12 |
0.0278 |
13,20 |
0.0093 |
|||||
12 |
0.0093 |
0.1481 |
0.5556 |
0.0093 |
11,13 |
0.0093 |
13,21 |
0.0278 |
||||
13 |
0.0093 |
0.0093 |
0.3519 |
0.2593 |
11,16 |
0.0185 |
13,26 |
0.0093 |
||||
14 |
0.2685 |
0.0185 |
0.2685 |
0.1111 |
11,17 |
0.0370 |
14,17 |
0.0185 |
||||
15 |
0.4815 |
0.1296 |
0.0741 |
0.0741 |
11,18 |
0.0093 |
14,18 |
0.0185 |
||||
15 |
0.0093 |
11,19 |
0.0370 |
14,19 |
0.0093 |
|||||||
16 |
0.1574 |
0.1852 |
12,12 |
0.0370 |
14,21 |
0.0093 |
||||||
17 |
0.0741 |
0.2778 |
12,14 |
0.0093 |
14,22 |
0.0093 |
||||||
18 |
0.0093 |
0.2222 |
12,15 |
0.0093 |
15,17 |
0.0093 |
||||||
19 |
0.1389 |
0.1111 |
12,16 |
0.0741 |
15,19 |
0.0093 |
||||||
20 |
0.2778 |
0.0185 |
0.0093 |
12,17 |
0.0185 |
15,20 |
0.0093 |
|||||
21 |
0.2778 |
0.0093 |
12,19 |
0.0926 |
15,22 |
0.0093 |
||||||
22 |
0.2037 |
0.0093 |
0.0093 |
12,20 |
0.0741 |
18,19 |
0.0093 |
|||||
23 |
0.0556 |
0.5093 |
13,13 |
0.1204 |
||||||||
24 |
0.0370 |
0.2407 |
13,14 |
0.0370 |
||||||||
25 |
0.0093 |
0.2222 |
13,15 |
0.0093 |
||||||||
26 |
0.0093 |
13,16 |
0.0278 |
|||||||||
GD |
0.7876 |
0.6719 |
0.8165 |
0.4010 |
0.7617 |
0.6390 |
0.6120 |
0.3813 |
0.9983 |
|||
GD, gene diversity.
Multidimensional scaling analysis based on the 10 Y- STRs
The multidimensional scaling analysis (MDS) analysis was performed among the Southern Shaanxi Han population and 19 other populations based on Rst values at the 10 overlapping Y-STR loci in order to address population relationships, and the result was shown in Figure 3. According to the figure, Southern Shaanxi Han was located in right part, closest to Eastern Han population, Liaoning Han and Jilin Han. The result was similar to the above results of population genetic analyses based on the 15 overlapping autosomal STR loci.
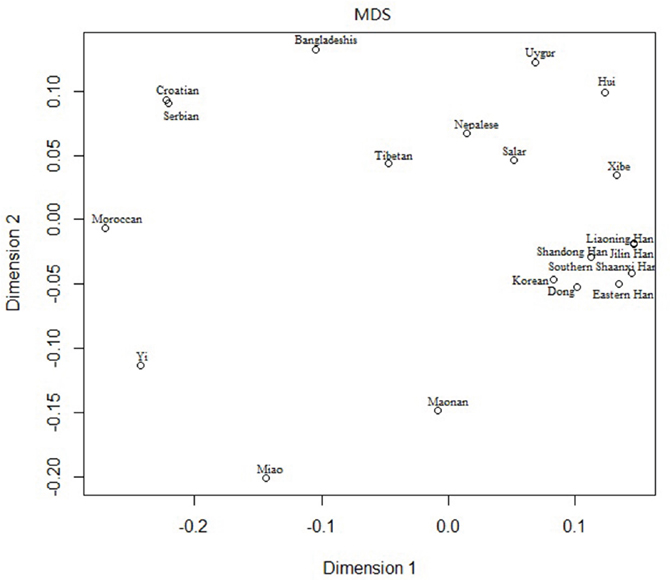
Figure 3: Multidimensional scaling analysis plot of the 20 populations based on the 10 overlapping Y-STR loci.
Phylogenetic analysis based on the 10 Y-STRs
As shown in Figure 4, the genetic relationships of the studied Southern Shaanxi Han and other 19 populations at the 10 overlapping Y-STRs were analyzed by the phylogenetic tree. In the NJ tree, the Southern Shaanxi Han population was also clustered close with the Eastern Han, Liaoning Han, Korean, Shandong Han and Xibe populations. Moreover, Croatian, Serbian, Moroccan and Yi populations were located furthest to Southern Shaanxi Han population. The phylogenetic result was similar to MDS result.
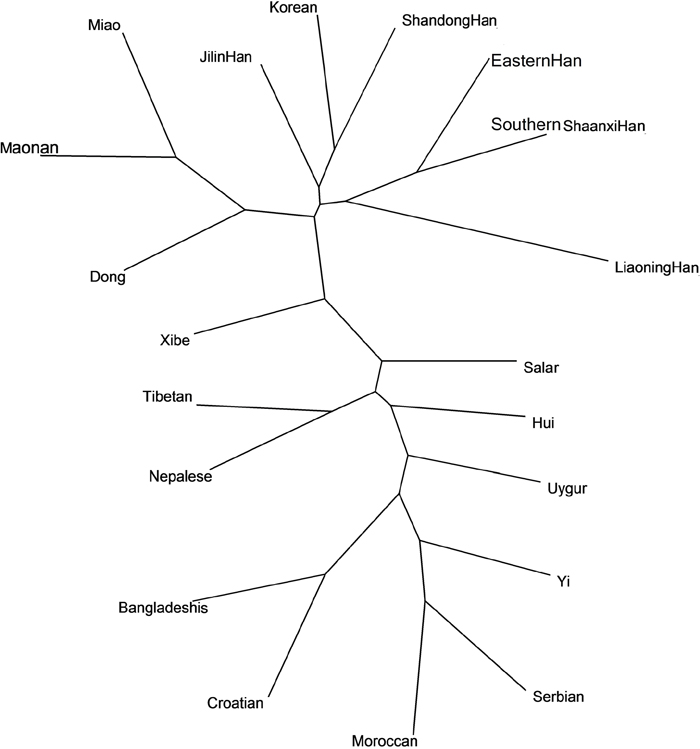
Figure 4: The neighbor-joining tree based on the 10 overlapping Y-STR loci of Southern Shaanxi Han population and 19 reference populations.
Southern Shaanxi Han speak Chinese, which belongs to Sino-Tibetan. Although settling in different areas, Southern Shaanxi Han and Eastern Han have a relatively close genetic relationship. However, for populations from other continents or races, such as Serbian, Moroccan, and Croatian, the genetic relationships with Southern Shaanxi Han would be quite distant because of their different origins and genetic structures. At present, there is little research on Southern Shaanxi Han population; more population genetic studies would help us get a better understanding of this population genetic backgroud in the future.
MATERIALS AND METHODS
Sample collection and DNA extraction
We collected 214 blood samples (108 males and 106 females) from unrelated healthy Han individuals living in the south of Shaanxi province (Southern Shaanxi), China. All the samples were collected according to the criteria for selection as follows: their ancestors within three generations should be unrelated individuals and members of Han ethnic group, with no migration. All volunteers without diseases signed informed consents. The present study followed the human rights and the ethical principle of Xinjiang Medical University and approved by institutional ethics committee, Xinjiang medical university, China. Genomic DNA was extracted using the Chelex-100 method as described by Walsh et al [47].
Multiplex amplification and STR genotyping
The 25 STR loci (D3S1358, D13S317, D7S820, D16S539, D19S433, DYS635, DYS456, TPOX, TH01, D2S1338, CSF1PO, DYS385a,b, DYS458, DYS391, vWA, D5S818, FGA, DYS392, DYS390, D8S1179, D21S11, D18S51, DYS393 and DYS438) and Amelogenin locus were co-amplified in a new single multiplex reaction in a 25μL PCR reaction volume using the Expressmarker 16+10Y fluorescence amplification reagents (AGCU ScienTech Incorporation, Wuxi, Jiangsu, China), according to the manufacturer’s instructions. DNA samples were amplified on a GeneAmp PCR System 9700 Thermal Cycler (Applied Biosystems, Foster City, CA, USA) following the manufacturer’s instructions.
Electrophoresis was performed using an ABI 3130 Genetic Analyzer (Applied Biosystems, Foster City, CA, USA). Fragment sizing was supported using the AGCU Marker SIZ-500 (AGCU ScienTech Incorporation, Wuxi, Jiangsu, China) internal size standard and allelic ladder as basis for comparison. Alleles were identified using the GeneMapper® ID V3.2 (Applied Biosystems, Foster City, CA, USA). The 9948 cell-line (Promega, Madison, WI, USA) DNA was also genotyped using the reagent as control.
Statistical analysis
Fifteen autosomal STRs were statistically analyzed as follows. We calculated the allelic frequencies and tested the Hardy-Weinberg equilibrium using the modified powerstat v1.2 spreadsheet [48]. The linkage disequilibrium of autosomal STRs was analyzed by Genepop v4.0.10 (http://genepop.curtin.edu.au/). The pairwise Fst and p values between the studied Han population and reference populations at 15 overlapping autosomal STR loci were estimated by the program ARLEQUIN v3.1 (http://cmpg.unibe.ch/software/arlequin3). Principal component analysis was performed with MVSP 3.1 (http://www.kovcomp.com) based on allelic frequencies of 15 overlapping autosomal STR loci, which was used to explore the extent of correlation genetic relationships. Neighbor-joining tree based on allelic frequencies of 15 overlapping autosomal STR loci were calculated using the Phylip-3.69 Software (http://evolution.gs.washington.edu/phylip.html). Based on the 10 overlapping Y-STR loci, another NJ tree was obtained by Phylip-3.69 Software (http://evolution.gs.washington. edu/phylip.html). Multidimensional scaling analysis of Y-STR based on Rst values was constructed by statistical software SPSS version 13.0 (SPSS Inc., Chicago, IL). Gene diversity and haplotype diversity were calculated using Nei's formula [49].
CONCLUSION
In summary, the results demonstrated high genetic diversities of the 15 autosomal STR loci and 10 Y-STR loci in the Southern Shaanxi Han population and the studied polymorphic markers were suitable for forensic DNA cases, which could offer a new tool for forensic investigation. In this study, 15 autosome and 10 Y chromosome STR loci were amplified by the multi-color fluorescence technique in a single PCR reaction, and genotyping profile of both autosomal STR and Y chromosome STR loci could be obtained simultaneously. This made it possible for forensic geneticists to get the information of personal identification, gender determination and pedigree investigation in one step, which is a time, labor and cost saving strategy. The results of population differentiation, principal component analysis, multidimensional scaling analysis and phylogenic analysis indicated the Southern Shaanxi Han population had closer genetic relationship with the Eastern Han population and more distant relationships with populations from other races. The present data which combined autosomal STR loci and Y-STR loci will be useful for the enrichment of Chinese genetic information resources and provide valuable forensic data for forensic DNA cases.
Abbreviations
HWE, Hardy-Weinberg equilibrium; LD, linkage disequilibrium; MP, matching probability; PD, power of discrimination; PIC, polymorphism information content; PE, probability of exclusion; TPI, typical paternity index; Ho, observed heterozygosity; He, expected heterozygosity; p, probability values of exact tests for Hardy–Weinberg equilibrium; NJ tree, neighbor-joining tree; PCA, principal component analysis; GD, Gene diversity; HD, haplotype diversity; DC, discriminatory capacity; MDS, Multidimensional scaling analysis.
Authors’ contributions
B.Z. and L.Z. designed the study. X.J., T.M. and J.L. provided human blood samples. Y.W., Y.G. and H.M. conducted the data processing and performed statistical analyses. Y.L. and J.C. wrote the main manuscript text. All authors reviewed the manuscript.
ACKNOWLEDGMENTS
This project was supported by the National Natural Science Foundation of China (NSFC, No. 81525015 and 81460286). The authors would like to thank Jiangwei Yan for helping us to analysis data.
CONFLICTS OF INTEREST
The authors state that they have no conflicts of interest.
REFERENCES
1. Zhu BF, Zhang YD, Shen CM, Du WA, Liu WJ, Meng HT, Wang HD, Yang G, Jin R, Yang CH, Yan JW, Bie XH. Developmental validation of the AGCU 21+1 STR kit: a novel multiplex assay for forensic application. Electrophoresis. 2015; 36:271-276.
2. Meng HT, Zhang LP, Wu H, Yang CH, Chen JG, Wang Y, Yan JW, Wang HD, Zhang YD, Liu WJ, Zhu BF. Genetic diversities of 20 novel autosomal STRs in Chinese Xibe ethnic group and its genetic relationships with neighboring populations. Gene. 2015; 557:222-228.
3. Zhang S, Tian H, Wang Z, Zhao S, Hu Z, Li C, Ji C. Development of a new 26plex Y-STRs typing system for forensic application. Forensic Sci Int Genet. 2014; 13:112-120.
4. Jobling MA, Tyler-Smith C. The human Y chromosome: an evolutionary marker comes of age. Nat Rev Genet. 2003; 4:598-612.
5. Jobling MA, Tyler-Smith C. Fathers and sons: the Y chromosome and human evolution. Trends Genet. 1995; 11:449-456.
6. Shrivastava P, Gupta U, Jain T, Trivedi VB. Y STR haplotype diversity in central Indian population. Ann Hum Biol. 2016; 43:480-487.
7. Li SL. Development of a novel multiplex PCR system with 19 autosomal STR and 4 Y-STR loci. Chinese Journal of Forensic Medicine. 2014; 29: 4-7.
8. Mei HW, Zhang D, Yin CY, Wang LN, Zhang B, Wang ZZ, Wang J, Chen F. [Population Genetic Analysis of 21 Autosomal STR Loci and 1 Y Chromosome STR Loci in Northern Han Nationality]. [Article in Chinese]. Chinese Journal of Forensic Science. 2015; 2: 67-71.
9. Xue PS. A Study on Shaanxi's Historical Population Geography. Shaanxi Normal University. 2000.
10. Ren YT. A Study on the influence of Shaanxi environment on regren Culture. Landbridge Horizon. 2010; 126-127.
11. Ding X, Li M, Gu H, Peng X, Zhang Z, Wu F. Detecting SNP combinations discriminating human populations from HapMap data. IEEE Trans Nanobioscience Mar. 2015; 14:220-228.
12. Wang Z, Huang P, Chen L, Xu Y, He K, Zhu X. Genetic polymorphisms of 15 STR loci in Chinese Hui population. J Forensic Sci. 2005; 50:1508-1509.
13. Guo H, Yan J, Jiao Z, Tang H, Zhang Q, Zhao L, Hu N, Li H, Liu Y. Genetic polymorphisms for 17 Y-chromosomal STRs haplotypes in Chinese Hui population. Leg Med (Tokyo). 2008; 10:163-169.
14. Chen JG, Pu HW, Chen Y, Chen HJ, Ma R, Xie ST, Zhang LP. Population genetic data of 15 autosomal STR loci in Uygur ethnic group of China. Forensic Sci Int Genet. 2012; 6:e178-e179.
15. Liu WJ, Pu HW, Yang CH, Meng HT, Zhang YD, Zhang LP, Yan JW, Wang HD, Ren JW, Sun JY, Liu C, Wang H, Zhu BF. 24 Y-chromosomal STR haplotypic polymorphisms for Chinese Uygur ethnic group and its phylogenic analysis with other Chinese groups. Electrophoresis. 2015; 36:626-632.
16. Gao Y, Zhang Z, Wang Z, Bian S. Genetic data of 15 STR forensic loci in eastern Chinese population. Forensic Sci Int. 2005; 154:78-80.
17. Wu W, Pan L, Hao H, Zheng X, Lin J, Lu D. Population genetics of 17 Y-STR loci in a large Chinese Han population from Zhejiang Province, Eastern China. Forensic Sci Int Genet. 2011; 5:e11-e13.
18. Zhu J, Shen C, Ma Y, He Y, Zhao J, Li X, Liu Y. Genetic polymorphisms of 15 STR in Chinese Salar ethnic minority group. Forensic Sci Int. 2007; 173:210-213.
19. Zhu B, Shen C, Xun X, Yan J, Deng Y, Zhu J, Liu Y. Population genetic polymorphisms for 17 Y-chromosomal STRs haplotypes of Chinese Salar ethnic minority group. Leg Med (Tokyo). 2007; 9:203-209.
20. Deng Q, Xu L, Gong J, Zhou L, Li S, Deng X, Luo G, Xie X. Genetic relationships among four minorities in Guangxi revealed by analysis of 15 STRs. J Genet Genomics. 2007; 34:1072-1079.
21. Liang ZR. Polymorphism of 17 Y-chromatosome short tandem repeats loci in 10 minority populations in Guangxi of China[D]. Guangzhou medical college, master thesis. 2009.
22. Yan J, Shen C, Li Y, Yu X, Xiong X, Mu H, Huang Y, Deng Y, Yu J. Genetic analysis of 15 STR loci on Chinese Tibetan in Qinghai Province. Forensic Sci Int. 2007; 169:e3-e6.
23. Zhu B, Wu Y, Shen C, Yang T, Deng Y, Xun X, Tian Y, Yan J, Li T. Genetic analysis of 17 Y-chromosomal STRs haplotypes of Chinese Tibetan ethnic group residing in Qinghai province of China. Forensic Sci Int. 2008; 175:238-243.
24. Zhu BF, Shen CM, Wu QJ, Deng YJ. Population data of 15 STR loci of Chinese Yi ethnic minority group. Leg Med (Tokyo). 2008; 10:220-224.
25. Han QS, Huang L, Song BL, Sun QD, Guo KJ, Zhang MZ, Li MM, Wang HW, Meng Q. Genetic polymorphisms of 39 STR loci in Shandong Han population. Journal of Forensic Medicine. 2015; 05: 513-516.
26. Yan J, Tang H, Liu Y, Jing Y, Jiao Z, Zhang Q, Gao J, Shang L, Guo H, Yu J. Genetic polymorphisms of 17 Y-STRs haplotypes in Chinese Han population residing in Shandong province of China. Leg Med (Tokyo). 2007; 9:196-202.
27. Kim YL, Hwang JY, Kim YJ, Lee S, Chung NG, Goh HG, Kim CC, Kim DW. Allele frequencies of 15 STR loci using AmpF/STR Identifiler kit in a Korean population. Forensic Sci Int. 2003; 136:92-95.
28. Kim SH, Han MS, Kim W, Kim WY. chromosome homogeneity in the Korean population. Int J Legal Med. 2010; 124:653-657.
29. Hossain T, Hasan MM, Mazumder AK, Momtaz P, Sharmin T, Sufian A, Das SA, Akhteruzzaman S. Population genetic data on 15 autosomal STR loci in Bangladeshi population. Forensic Sci Int Genet. 2014; 13:e4-e5.
30. Alam S, Ali ME, Ferdous A, Hossain T, Hasan MM, Akhteruzzaman S. Haplotype diversity of 17 Y-chromosomal STR loci in the Bangladeshi population. Forensic Sci Int Genet. 2010; 4:e59-e60.
31. Veselinović I, Kubat M, Furac I, Skavić J, Martinović Klarić I, Tasić M. Allele frequencies of the 15 AmpF lSTR Identifiler loci in the population of Vojvodina Province, Serbia and Montenegro. Int J Legal Med. 2004; 118:184-186.
32. Veselinović IS, Zgonjanin DM, Maletin MP, Stojkovic O, Djurendic-Brenesel M, Vukovic RM, Tasić MM. Allele frequencies and population data for 17 Y-chromosome STR loci in a Serbian population sample from Vojvodina province. Forensic Sci Int. 2008; 176:e23-e28.
33. Liu J, Li SY, Yin JY, Zhang W, Gao B, Guo L, Qi R. Genetic analysis of 15 STR loci from a Xibe population in Liaoning, Northeast of China. Ann Hum Biol. 2014; 41:244-248.
34. Guo F, Zhang L, Jiang X. Population genetics of 17 Y-STR loci in Xibe ethnic minority from Liaoning Province, Northeast China. Forensic Sci Int Genet. 2015; 16:86-87.
35. Zhang L. Population data for 15 autosomal STR loci in the Dong ethnic minority from Guizhou Province, Southwest China. Forensic Sci Int Genet. 2015; 16:237-238.
36. Liu C, Liu C, Wang H. Genetic diversity at 15 STR loci in two tribal populations in Southern China. Forensic Sci Int. 2006; 162:28-32.
37. Ossmani HE, Talbi J, Bouchrif B, Chafik A. Allele frequencies of 15 autosomal STR loci in the southern Morocco population with phylogenetic structure among worldwide populations. Leg Med (Tokyo). 2009; 11:155-158.
38. Aboukhalid R, Bouabdellah M, Abbassi M, Bentayebi K, Elmzibri M, Squalli D, Amzazi S. Haplotype frequencies for 17 Y-STR loci (AmpFlSTRY-filer) in a Moroccan population sample. Forensic Sci Int Genet. 2010; 4:e73-e74.
39. Projić P, Skaro V, Samija I, Pojskić N, Durmić-Pasić A, Kovacević L, Bakal N, Primorac D, Marjanović D. Allele frequencies for 15 short tandem repeat loci in representative sample of Croatian population. Croat Med J. 2007; 48:473-477.
40. Pokupcić K, Cukrov S, Klarić IM, Salihović MP, Lauc LB, Blazanović A, Janićijević B. Y-STR genetic diversity of Croatian (Bayash) Roma. Forensic Sci Int Genet. 2008; 2:e11-e13.
41. Ota M, Droma Y, Basnyat B, Katsuyama Y, Asamura H, Sakai H, Fukuhsima H. Allele frequencies for 15 STR loci in Tibetan populations from Nepal. Forensic Sci Int. 2007; 169:234-238.
42. Gayden T, Chennakrishnaiah S, La Salvia J, Jimenez S, Regueiro M, Maloney T, Persad PJ, Bukhari A, Perez A, Stojkovic O, Herrera RJ. Y-STR diversity in the Himalayas. Int J Legal Med. 2011; 125:367-375.
43. Xu XM, Feng Z, Yao J. Population data of 15 autosomal STR loci in Chinese Han population from Jilin Province, Northeast China. Forensic Sci Int Genet. 2017;27:187-188.
44. Han Y, Li L, Liu X, Chen W, Yang S, Wei L, Xia M, Ma T, Jin L, Li S. Genetic analysis of 17 Y-STR loci in Han and Korean populations from Jilin Province, Northeast China. Forensic Sci Int Genet. 2016; 22:8-10.
45. Yao J, Wang LM, Gui J, Xing JX, Xuan JF, Wang BJ. Population data of 15 autosomal STR loci in Chinese Han population from Liaoning Province, Northeast China. Forensic Sci Int Genet. 2016; 23:e20-e21.
46. Guo F. Population genetics for 17 Y-STR loci in Northern Han Chinese from Liaoning Province, Northeast China. Forensic Sci Int Genet. 2017; 20; 29:e35-e37.
47. Walsh PS, Metzger DA, Higuchi R. Chelex 100 as a medium for simple extraction of DNA for PCR-based typing from forensic material. Biotechniques. 1991; 10:506-513.
48. Tereba A. Tools for Analysis of Population Statistics. Profiles in DNA. 1999; 2:14-16.
49. Nei M. Analysis of gene diversity in subdivided populations. Proc Natl Acad Sci U S A. 1973; 70:3321-3323.