
INTRODUCTION
With the aging of the population, the elderly related diseases become increasingly prominent. Alzheimer’s disease (AD) [1], a degenerative disorder of the central nervous system with the loss of memory and dysfunctions of language and behavior, is the most common form of senile dementia. It is predicted that one in eighty-five people will be living with the disease by 2050 [1]. The incidence of AD in senectitude shows the elevated trend year by year. Therefore, the identification and development of novel and revolutionary therapeutic strategies and drugs are definitely needed [2].
The knowledge of protein three-dimensional structures is vitally important for understanding crucial molecular mechanisms [3–7] for rational drug design [8, 9] and computational modeling [10]. Although many studies had been conducted during the last two decades or so (see, e.g., [11–21]), the pathogenesis of AD is still elusive and so far there is no effective prevention and treatment. Nevertheless, there are many hypotheses about its pathogenesis, such as free-radical injury hypothesis [22], amyloid peptide hypothesis [11, 23], cholinergic hypothesis [24] and Tau hyper-phosphorylation hypothesis [25]. Cholinergic hypothesis [24], the oldest one trying to explain the cause of the disease, is one of the most important theory for currently available drug therapies. It supposes that the change of cholinergic system is closely related to the degree of cognitive impairment. Therefore, acetylcholinesterase (AChE) has been considered as an effective target for the treatment of AD [24], and hence acetylcholinesterase inhibitor (AChEI) was also regarded as an important agent for AD therapy.
Several drugs for treating AD in clinical therapy have been investigated including Tacrine [26], Donepezil [27] and Rivastigmine [28]. Although good effects have been achieved by using these drugs, there are some shortcomings, such as: the high cost of synthesis, limited selectivity, weak performance, toxic side effects, et al. [29]. In recent years, with the development of the separation, purification and analysis technology, the research of natural active ingredients for preventing and treating Alzheimer’s Disease has also achieved new progresses [30–32]. Several effective AChEIs such as Huperzine-A [33], Galanthamine [34] and Physostigmine [35] derived from medicinal plants showed that they possessed the advantages of higher inhibitory activity and insignificant toxicity and side effects.
In 2008, Wei et al. [36] discovered four new compounds from the roots of Berchemia, and named them Floribundiquinone A (FA), Floribundiquinone B (FB), Floribundiquinone C (FC), and Floribundiquinone D (FD), respectively. Since FB is easier to acquire, in this study we are mainly focused on the inhibition of FB (Figure 1) for AChE. Both the experimental method (such as fluorescence spectra [37, 38], ultraviolet-visible (UV-vis) absorption spectrometry [39], circular dichroism (CD) spectrum [40]) and theoretical method (such as molecular docking [41–55]) were applied to study and analyze the interaction of FB-AChE and the binding site. Furthermore, the Topomer CoMFA and Ellman [56] were also used to analyze the biological activity of FB.
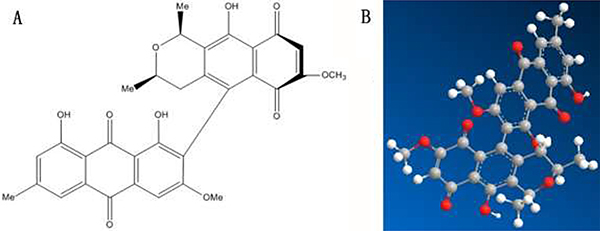
Figure 1: Molecular structures of FB.
RESULTS AND DISCUSSION
The interactions between FB and AChE
Fluorescence quenching of AChE
The fluorescence emission spectra of AChE were recorded at different concentrations of FB with the excitation wavelength of 230nm (Figure 2A) and 280 nm (Figure 2B) at three temperatures (298 K, 303 K and 308 K) and one of them (303 K) is shown in Figure 2. The fluorescence spectra of the polypeptide backbone structure and excited tyrosine and tryptophan are shown in Figure 2A and Figure 2B, respectively. From Figure 2A (230 nm), it can be seen that AChE is with a strong fluorescence emission peak, while FB with very weak intrinsic fluorescence under the same experimental conditions. Besides, the fluorescence intensity of AChE decreases gradually along with the increase of FB concentration. Hence, it can be concluded that the interaction between AChE and FB does exist, and the combination of AChE and FB becomes saturated gradually along with the increase of FB concentration. Under the effect of FB, the maximum emission wavelength of AChE was accompanied by a slight red shift (330 nm→335 nm), proving that FB can induce the microenvironmental change around AChE polypeptide backbone and result in the enhanced of polarity. It can be seen from Figure 2B (280 nm) that there was a strong fluorescence emission peak of AChE as well, and that the intrinsic fluorescence of FB was also very weak under the same experimental conditions. Moreover, the fluorescence intensity of AChE dropped gradually along with the increase of FB concentration, indicating the effect of FB on the tyrosine and tryptophan residues of AChE.
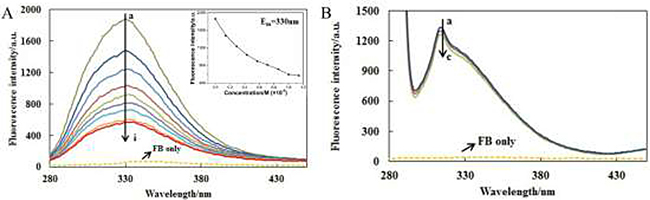
Figure 2: The fluorescence emission spectra of AChE-FB with excitation wavelength of 230 nm (A) and 280 nm (B). CAChE = 5 × 10⁻⁸M,CFB,a→i: 0, 0.14, 0.29, 0.43, 0.57, 0.71, 0.86, 1 and 1.14 × 10⁻⁶M; CFB,a→c: 0, 0.14, and 0.29 × 10⁻⁶M; T = 303 K.
Fluorescence quenching here refers to the quenching between the fluorescent molecules and the solvent molecules. The fluorescence quenching can be classified as static quenching and dynamic quenching. To further confirm the quenching mechanism, we analyzed the fluorescence quenching of AChE at different temperatures (298 K, 303 K and 308 K) with λex = 230 nm by means of the following Ster-Volmer equation

where F0 and F are the fluorescence intensity before and after the quencher, respectively, kq is the rate constant in fluorescence quenching process; [Q] is the concentration of quencher; Ksv is the quenching constant, τ0 is the life expectancy of a fluorescent molecule (generally the 10–8 s) without quencher [57, 58].
The Stern–Volmer curves of the fluorescence quenching of AChE by FB at different temperatures are given in Supplementary Figure 1 of Supporting Information. Shown in Table 1 are the quenching constant Ksv and correlation coefficient of AChE obtained by the linear equation. It has been observed that Ksv is reduced along with the increasing of temperature, and that kq is 22.87 × 10¹⁴, 20.97 × 10¹⁴, 19.11 × 10¹⁴ L/(mols) at 298 K, 303 K and 308 K, respectively. And they are significantly greater than the maximum quenching rate constants of the biomolecule (2.0 × 10¹⁰L/(mols)) [59]. All these results have clearly demonstrated that the fluorescence quenching of AChE by FB is static quenching that may cause the reaction between quenching agent and fluorescent material molecules of the ground state.
Table 1: The quenching constant Ksv and correlation coefficient of AChE
T(K) |
KSV (× 106M−1) |
kq (×1014M−1S−1) |
Ra |
|---|---|---|---|
298 |
22.84 |
22.84 |
0.997 |
303 |
20.97 |
20.97 |
0.994 |
308 |
19.11 |
19.11 |
0.995 |
Ra is the linear correlated coefficient.
UV-vis absorption spectra of FB and AChE system
UV-vis absorption spectroscopy [60, 61] is a simple and effective way for detecting the protein conformational changes and the complex formation. The quenching mechanism of the drug and AChE may be further verified by the UV-vis absorption spectroscopy method.
From Supplementary Figure 2 of Supporting Information, it can be observed that AChE has a strong absorption within the wavelength range of 200 nm-240 nm, the band that reflects the information of protein backbone. The intensity of the absorption peak of AChE at 230 nm is remarkably reduced along with the increase of FB concentration, and the absorption peak has a slight red shift. There is a weak absorption peak at 280 nm, which is mainly the absorption peak of the conjugated double bonds in tyrosine and tryptophan residues of AChE. These results indicate that the interaction of FB with AChE may change the conformation of AChE and the microenvironment, and hence changing the hydrophobicity. Moreover, it has also confirmed that FB does interact with AChE to form a ground-state complex and that the fluorescence quenching is mainly a static quenching process.
Calculation of binding constant and binding sites
Static fluorescence quenching means that fluorescent donor molecule and a fluorescent quencher molecule combine to form a ground state complex with certain structure, while non-fluorescent by intermolecular force would lead to the phenomenon of the decrease of fluorescence. The supposed fluorescence quenching of protein is static quenching. The number of binding sites (nb) can be determined by the following equation

The binding affinity of drugs and AChE was determined by the binding constant. The size of the value would reflect the binding strength, and it would have a direct impact on the distribution and elimination of drugs. Thus, it will have an impact on the intensity and duration of drug action as well.
When , Eq.2 can be used to calculate the binding constant (K) between the drug and the protein [62]; i.e.,

Shown in Supplementary Figure 3 of Supporting Information are (A) the corresponding double logarithmic curve and (B) the modified Stern-Volmer curves. It can be seen from Table 2 that the binding sites of FB are approximately equal to 1, implying that the AChE has a single binding site for FB to bind, and the binding constant is reduced by the temperature increase, coinciding with the change of quenching constant.
Table 2: The binding sites (n) and the binding constant (K) of the inaction of AChE and FB
T(K) |
K (× 106M–1) |
n |
Ra |
|---|---|---|---|
298 |
22.47 |
1.02 |
0.994 |
303 |
19.19 |
1.04 |
0.998 |
308 |
14.72 |
1.10 |
0.998 |
Ra is the linear correlated coefficient.
Fluorescence resonance energy transfer between FB and AChE
According to the Förster theory [63], there is enough overlap between the fluorescence spectra of the donor (AChE) and the UV absorption spectrum of acceptor (FB). When the distance between the donor (AChE) and the acceptor (FB) was less than 7 nm, the non-radiative energy transfer will occur and hence result in fluorescence quenching. The relationships of non-radiative energy transfer efficiency (E), the distance (r) between the donor and the acceptor and the critical energy transfer distance (R0) are as follows
where F0 and F are the fluorescence intensity before and after the quencher reaction; R0 [64] is the critical distance when the non-radiative energy transfer efficiency is 50%; K2 is the dipole spatial orientation factor and its value is taken as 2/3 for random orientations; n is the refractive index of the medium and its value is taken as 1.336 [65] for diluted solution; Φ is the fluorescence quantum yield of the donor and its value is taken as 0.15 [66]; J is the overlap integral of the donor’s fluorescence emission spectrum and the acceptor’s absorption spectrum; Fλ is the fluorescence intensity of AChE on the wavelength at λ, and ελ is the molar absorption coefficient of the acceptor upon the wavelength at λ [64].
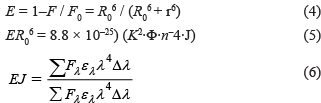
Shown in Figure 3 are (a) the overlap of the fluorescence spectra of AChE and (b) the absorption spectrum of FB . Thus, the corresponding parameters (J = 8.3589 × 10⁻¹⁴ cm3L/mol, R0 = 3.49nm, E = 0.4961, r = 3.502nm) of FB were obtained according to the Eqs.4–6. The distance between the donor (AChE) and the acceptor (FB) was less than 7nm, and 0.5R0 < r < 1.5R0, indicating the possibility of energy transfer between FB and AChE was high [60].
Figure 3: Overlap of the fluorescence spectra of AChE (A) and the absorption spectrum of FB (B).
It is instructive to point out that similar energy transfer via resonance was also been analyzed in protein/DNA systems [67–72] and used to reveal some marvelous biological functions in biomacromolecules [2, 73].
Effect of FB on the AChE conformation
Aforementioned UV and fluorescence experiments showed that FB did affect the main peptide chain of AChE. To further study the effect of FB on the AChE conformation, the effects of FB on the tertiary structure of AChE were investigated by the 3D (three-dimensional) fluorescence spectroscopy. The fluorescence information of the sample can be fully demonstrated by the 3D fluorescence spectra [36]. The 3D fluorescence spectra and its corresponding contour maps of AChE and FB-AChE systems (molar ratio 2: 1) were shown in Figure 4 (A and B) and Supplementary Figure 4. Peak 1 is the endogenous fluorescence peak of AChE when the excitation wavelength was 280 nm, which mainly reflects the spectral characteristics of tyrosine and tryptophan residues. The fluorescence intensity is slightly and gradually decreased after dropping FB with a red shift at about 2nm, indicating that the FB may change the microenvironment around tyrosine and tryptophan residues of AChE and increase the polarity. Peak 2 is endogenous fluorescence peak of AChE when the excitation wavelength was 230 nm, reflecting the fluorescence spectrum of peptide backbone structure. The fluorescence intensity is greatly and gradually reduced after dropping FB with a red shift at about 4nm, implying that the FB may affect the microenvironment around peptide backbone structure. In other words, the microenvironment hydrophobicity around the peptide chain is reduced and the polarity is increased.
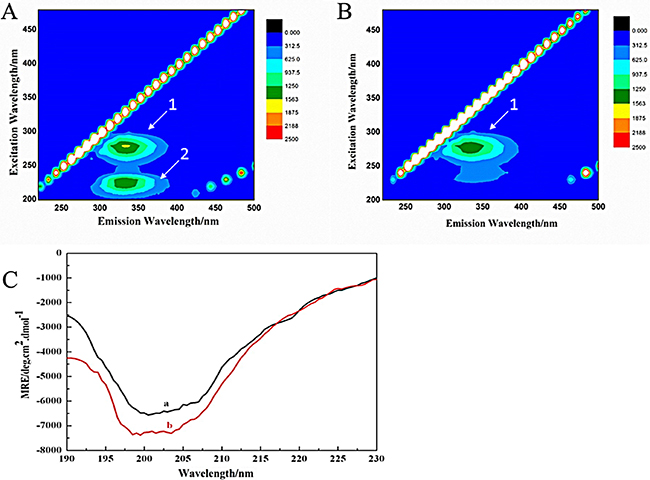
Figure 4: Three-dimensional fluorescence spectra contour maps of AChE (A) and the FB-AChE system (B), the CD spectra (C) of AChE (A) and FB-AChE (B) System.
In this study, we also used the CD [40] to investigate the impact of FB on the secondary structure of AChE due to its binding to latter. And the CD spectra of far-UV between 190–230 nm band was selected that is related to the conformation of AChE. As seen in Figure 4C, the peak of AChE in the vicinity of 200 nmis regarded as characteristic negative peaks of random coil. The CD spectra of AChE was changed after dropping FB. The contents of different secondary structures of AChE were quantitatively analyzed by CONTINLL algorithm using CDPro software (Table 3). The contents of α-helix, β-turn and random coil were increased, but the content of β- folded was decreased. The changes in the secondary structures show a full consistency with the above experimental results.
Table 3: The content of different secondary structures of AChE obtaining by CONTINLL algorithm
Compounds |
H(r) (%) |
H(d) (%) |
S(r) (%) |
S(d) (%) |
Trn (%) |
Unrd (%) |
|---|---|---|---|---|---|---|
AChE |
0.3 |
5.2 |
23.9 |
12.8 |
22.6 |
35.2 |
AChE+FB |
0.9 |
5.8 |
21.4 |
12.6 |
23.1 |
36.2 |
H(r): Regular α- helical structure; H(d): Irregular α- helical structure; S(r): Regular β-sheet structure; S(d): Irregular β-folded structure; Trn: β- turn structure; Unrd: Random coil structure.
Analysis with molecular docking
Molecular docking is a useful vehicle for investigating the interaction of a protein receptor with its ligand and revealing their binding mechanism as demonstrated by a series of studies (see, e.g., [16, 41–43, 46–54, 74–77]). In this study, molecular docking of FB with AChE (PDB ID: 1QTI) was studied by using the Tripos molecular modeling package in SYBYL-X-2.0. The results thus obtained are shown in Figure 5, where we can see that the binding of FB to AChE is mainly through hydrogen bonds and that there are three binding sites between the FB and AChE. Also, FB can interact with TYR121; the latter is one of the peripheral anionic sites (PAS) of the AChE [78]. The clinical drugs such as Tacrine, Rivastigmine and Huperzine A also have a strong interaction with the PAS [79, 80] of AChE. TRP84 is the binding site of choline to AChE, and can hydrolyze Ach thereby to reduce the affinity of enzyme-substrate as well as the enzyme’s activity. Meanwhile, the score of molecular docking was also obtained. The “TotalScore” was 5.9157. Note that it means that the interaction between small molecule and macromolecule is very strong when the “TotalScore” is more than 4. Accordingly, the interaction between FB and AChE is very strong.
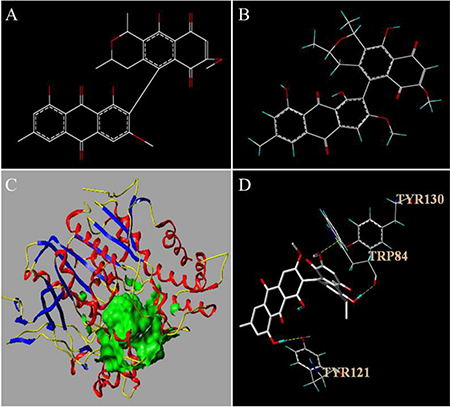
Figure 5: The structure of FB before (A) and after (B) optimization in SYBYL-X-2.0. The active pocket of AChE (C) and the results of the molecular docking (D). In Figure 5C, the ligand is shown in green and the secondary structure of protein is shown in yellow, blue and red ribbon. In Figure 5D, hydrogen bonding depicted in yellow dashed lines.
Analysis of biological activity of FB
Predicting and validating the activity of FB
The training dataset was used to build Topomer CoMFA model by fragmenting them into R1 and R2 groups. And the testing dataset was adopted to evaluate the stability and predictive ability of the model. The experimental and predicted pIC50 values calculated by the model were compared with each other, and their correlations are shown in Table 4. The success rates by the jackknife [81] or LOO cross-validation on the training dataset and testing dataset were 0.990 and 0.899, respectively. And the MRE of the training dataset and testing dataset were 2.88% and 6.40%, respectively. All these results indicate that the Topomer CoMFA model is a very effective predictor. Accordingly, the predicted result pIC50 = 5.95 for FB is quite reliable as well.
Table 4: The experimental pIC50, predicted pIC50, R1, R2 values of TopomerCoMFA model
Compounds |
Exp |
Pred |
R1 |
R2 |
|---|---|---|---|---|
Training dataset |
||||
1 |
8.97 |
9.41 |
1.47 |
2.17 |
2 |
8.59 |
8.56 |
1.47 |
1.32 |
3 |
8.67 |
8.46 |
0.53 |
2.17 |
4 |
9.06 |
8.93 |
0.53 |
2.63 |
5 |
8.39 |
8.35 |
0.53 |
2.05 |
6 |
9.49 |
9.48 |
–2.09 |
5.81 |
7 |
9.52 |
9.46 |
–2.09 |
5.79 |
8 |
5.50 |
5.01 |
–2.09 |
1.34 |
9 |
3.25 |
3.51 |
–2.09 |
–0.17 |
10 |
2.98 |
3.01 |
–2.09 |
–0.67 |
11 |
3.23 |
3.79 |
–2.09 |
0.12 |
12 |
3.36 |
3.86 |
–2.09 |
0.19 |
13 |
3.44 |
3.33 |
–2.09 |
–0.34 |
14 |
5.11 |
4.98 |
–0.83 |
0.06 |
15 |
3.04 |
2.89 |
–2.09 |
–0.79 |
16 |
3.20 |
3.35 |
–2.09 |
–0.32 |
17 |
3.41 |
3.30 |
–2.09 |
–0.37 |
18 |
3.82 |
3.69 |
–2.09 |
0.02 |
19 |
4.99 |
5.03 |
–2.09 |
1.36 |
20 |
5.54 |
5.44 |
–2.09 |
1.76 |
21 |
5.11 |
4.74 |
–2.09 |
1.05 |
22 |
5.20 |
4.91 |
–2.09 |
1.24 |
23 |
5.57 |
5.60 |
–2.09 |
1.92 |
24 |
7.39 |
7.31 |
1.05 |
0.49 |
25 |
8.29 |
8.35 |
0.92 |
1.66 |
26 |
8.28 |
8.25 |
0.92 |
1.56 |
27 |
8.25 |
8.17 |
0.92 |
1.49 |
28 |
7.77 |
7.92 |
0.92 |
1.23 |
29 |
7.05 |
7.09 |
0.92 |
0.40 |
30 |
7.29 |
7.18 |
0.92 |
0.49 |
31 |
7.58 |
7.78 |
0.10 |
1.91 |
32 |
7.68 |
7.85 |
0.10 |
1.99 |
33 |
7.91 |
7.97 |
–2.09 |
4.29 |
34 |
7.93 |
7.74 |
–2.09 |
4.06 |
35 |
8.17 |
8.13 |
–2.09 |
4.46 |
36 |
9.49 |
9.48 |
–2.09 |
5.81 |
37 |
8.85 |
9.13 |
–2.09 |
5.45 |
38 |
7.89 |
7.78 |
1.47 |
0.54 |
39 |
6.89 |
6.77 |
0.46 |
0.54 |
40 |
6.41 |
6.54 |
0.22 |
0.54 |
41 |
5.32 |
5.27 |
–0.09 |
–0.41 |
42 |
6.77 |
6.83 |
1.47 |
–0.41 |
43 |
7.67 |
7.82 |
1.47 |
0.58 |
44 |
9.60 |
9.14 |
1.47 |
1.90 |
45 |
7.49 |
7.74 |
0.53 |
1.45 |
46 |
7.52 |
7.57 |
0.53 |
1.27 |
47 |
8.16 |
8.19 |
0.53 |
1.90 |
Testing dataset |
||||
48 |
9.57 |
9.87 |
1.47 |
2.63 |
49 |
9.17 |
9.29 |
1.47 |
2.05 |
50 |
5.66 |
4.96 |
–2.09 |
1.29 |
51 |
5.47 |
5.52 |
–2.09 |
1.84 |
52 |
5.63 |
5.15 |
–0.67 |
0.06 |
53 |
7.23 |
8.05 |
1.05 |
1.23 |
54 |
7.53 |
7.06 |
0.10 |
1.19 |
55 |
7.56 |
7.28 |
0.10 |
1.41 |
56 |
7.35 |
7.76 |
1.45 |
0.54 |
57 |
6.34 |
6.71 |
0.40 |
0.54 |
58 |
6.54 |
6.22 |
–0.09 |
0.54 |
59 |
5.43 |
5.59 |
0.22 |
–0.41 |
60 |
7.42 |
8.23 |
0.53 |
1.93 |
61 |
7.45 |
8.32 |
0.53 |
2.02 |
FB |
/ |
5.95 |
1.21 |
0.17 |
Subsequently, the Ellman method was used to validate the predicted result. The inhibition ratio of FB in eight different concentrations (2.0, 3.0, 4.0, 5.0, 6.0, 7.0, 8.0 and 9.0 μg/mL) to AChE and the IC50 of FB were calculated and shown Figure 6. The IC50 of Huperzine A as a positive control to AChE was also measured. As an outcome, the half inhibitory concentration of FB and Huperzine A was obtained (IC50FB = 3.478 ± 0.09μg/ml, IC50huperzine = 74.8 ± 0.08 nmol/L), which is quite consistent with the reported result in literature (IC50 = 74.0 ± 0.06 nmol/L) [82]. The pIC50 of FB was obtained (pIC50= 5.22) by calculation, which was in the same order of magnitude with the predicted results.
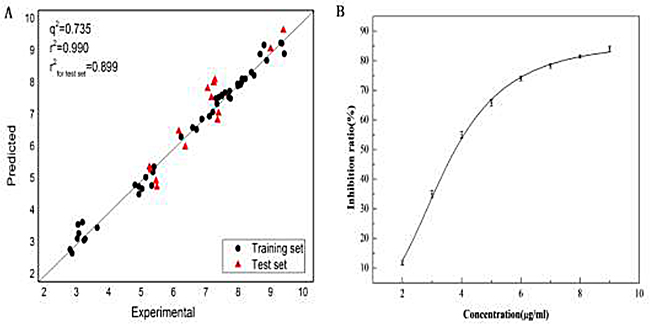
Figure 6: Plot (A) of the experimental data versus the predicted values andtheplot (B) of inhibition ratio at different concentrations of FB to the AChE.
Clues for enhancing biological activity
Based on the 3D contour maps obtained by the Topomer CoMFA model for R1 and R2 of FB, we can analyze how to further enhance the biological activity of FB. Shown in Figure 7 are the steric field contours (yellow and green), and the electrostatic field contours (red and blue). The former indicates that introducing large volume groups can improve the FB’s activity, while the latter that adding the positive-charged groups can improve the FB’s activity.
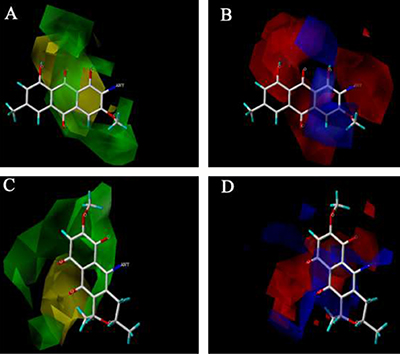
Figure 7: The 3D contour mapsof the TopomerCoMFAmodelfor R1 and R2 of FB. The steric contour maps of R1 (A) and R2 (C); the electrostaticcontour maps of R1 (B) and R2 (D).
MATERIALS AND METHODS
The FB samples (purity ≥ 98%) were purchased from the key chemical laboratory of natural products, Chinese Academy of Sciences. All other reagents were of analytical grade and the experimental water was double distilled water.
The fluorescence spectrum was obtained using F-7000 fluorescence spectrometer (Hitachi High-Technologies Corporation, Japan). An ultra micro-spectrophotometer was used to measure the OD260/OD280 absorbance ratio. The UV-vis absorption spectra were recorded on Cary100 UV-vis spectrophotometer (Varian, Australia). The circular dichroism spectra were measured on J-815 spectropolarimeter (Jasco, Japan). And an iMark microplate reader (BIO-RAD, America) was used to measure the inhibition ratio.
700 μL AChEsolution (pH = 7.4) was added to 1mL quartz cuvette. And 1μL FB solution (1 × 10⁻⁵M, the cumulative volume is less than 10μL) was dropped with micro-injector successively, and the solution was allowed to stand for 8 min to equilibrate. The emission spectra from 250 nm to 450 nm were recorded upon the excitation wavelength range of 230 nm and 280 nm at 298 K, 303 K and 308 K, respectively.
Three-dimensional fluorescence spectra of the AChE and the FB-AChE complexes (1:1, molar ratios) were obtained upon the excitation wavelength range of 200 nm-480 nm and the emission wavelength range of 220 nm-500 nm.
The ultraviolet absorption spectra of the AChE and FB before and after the reaction in the range of 200–800 nm were recorded. And 1μL FB solution (2 × 10⁻⁴ M) was dropped to 3 mL AChE solution (6.7 × 10⁻⁸ M) with micro-injector successively, and the solution was allowed to stand for 4min. In addition, the absorption spectra of FB (5 × 10⁻⁸ M) were recorded.
The CD spectra of AChE upon the far ultraviolet wavelength range of 190 nm–230 nm were measured at room temperature before and after the reaction with FB, respectively. The AChE solution (3.3 × 10⁻⁸ M) was added dropwise 2 × 10⁻⁶ M FB solution. Scanning speed was 50 nm/min, and the slit width was 2.0 nm. The measured data were the average of three measurements. In addition, the changes of the content of AChE in different secondary structure were quantitatively analyzed by means of the CONTINLL algorithms derived from CDPro software.
The protein structure of the AChE (PDB ID: 1QTI) was taken from the protein data bank (http://www.rcsb.org/pdb). The structure of FB was created using ChemDraw. The molecular docking was conducted by using the Tripos molecular modeling package in SYBYL-X-2.0.
The operation of TopomerCoMFA by combining Topomer technique and CoMFA technology can overcome the alignment problem of CoMFA [83]. In this work, a data set containing 61 inhibitors from [84–89] were collected, followed by studying the 3D QSAR of 46 kinds of compounds with the method of TopomerCoMFA by with SYBYL-X-2.0. A total of 61 compounds were randomly divided into a training dataset (47 compounds) and a testing dataset (14 compounds). The 3D QSAR model [90] was built to predict and analyze the biological activity of FB.
The biological activity of FB was measured with the Ellman method according to the following steps.
Sample group: 140 μL PBS buffer solution (0.1M, pH = 8.0), 20 μL sample solution and 20 μL AChE solution (0.28 U/mL) were introduced into the enzyme label plate in turn. The solution was preserved at 4°C for 20 min after mixing. Then 10 μL dithiobis nitrobenzoic acid (DTNB, 7.5 mM) and 10 μL acetylthiocholine (ATCI, 10 mM) were added. After 20 minutes, the absorbance was measured at λ = 405 nm.
Sample-out group: 20 μL enzyme solution was replaced by 20 μL PBS buffer solution (pH = 8.0), ceteris paribus.
Blank group: 20 μL sample solution was replaced by 20 μL PBS buffer solution (pH = 8.0), ceteris paribus.
Completely inhibit groups: substituting 20 μL of the sample solution with 20 μL huperzine solution (100 μg/mL, anhydrous methanol solution to 1 mg/mL as mother liquor, then were diluted using PBS (pH = 8.0)), ceteris paribus.
And the inhibition ratio can be calculated according to the equation below
where R is the inhibition ratio, A1 the absorbance of sample group, A2 the absorbance of sample-out group, A3 the absorbance of blank group, and A4 the absorbance of completely inhibit group.
CONCLUSIONS AND PERSPECTIVE
It is known that several efficient AChEIs have been extracted from medicinal plants. In comparison with the synthetic drugs, those extracted from plants have the following remarkable advantages: stronger activity, higher selectivity, and lower toxicity. Consequently, it is currently a very hot topic and main trend to search for the efficient AChEI from plants.
In this study, the interaction between FB and AChE was investigated. And the fluorescence, UV-vis, and CD spectrum were applied to study the interaction between FB and AChE under the physiological conditions (pH = 7.4). The results clearly demonstrated that the fluorescence quenching of AChE by FB was static quenching. Moreover, there was about one binding site and the distance between the FB and AChE was calculated (r = 3.502 nm). The results of CD and three-dimensional fluorescence indicated that FB could change the microenvironment of AChE. Furthermore, the results of molecular docking showed the binding site and the combining capacity were fully consistent with the experimental observations. It can be concluded from these competing facts that FB can be considered as a potential AChEI.
This study has also provided some useful clues and hints for designing more effective drugs against Alzheimer’s disease through the Topomer CoMFA model such as the big size and positive-charged groups.
As demonstrated in a series of recent publications (see, e.g., [91–107]) in reporting new findings or approaches, user-friendly and publicly accessible web-servers will significantly enhance their impacts [55]; otherwise, their usage would be quite limited [108]. We shall make efforts in our future work to provide a web-server to display the findings reported in this study.”
ACKNOWLEDGMENTS
The authors wish to thank the two anonymous reviewers, whose constructive comments are very helpful for strengthening the presentation of this paper. The present study was supported by National Natural Science Foundation of China (81271384 and 81371623), The National Key research and Development Program of China (grant no. 2016YFD0501101) and High Performance Computing Center Program of Shanghai University.
CONFLICTS OF INTEREST
The authors declare no conflicts of interest.
REFERENCES
1. Brookmeyer R, Johnson E, Ziegler-Graham K, Arrighi HM. Forecasting the global burden of Alzheimer’s disease. Alzheimers Dement. 2007; 3:186–191.
2. Chou KC. An unprecedented revolution in medicinal chemistry driven by the progress of biological science. Curr Top Med Chem. 2017 Apr 14. https://doi.org/10.2174/1568026617666170414145508. [Epub ahead of print].
3. Schnell JR, Chou JJ. Structure and mechanism of the M2 proton channel of influenza A virus. Nature. 2008; 451:591–595.
4. Berardi MJ, Shih WM, Harrison SC, Chou JJ. Mitochondrial uncoupling protein 2 structure determined by NMR molecular fragment searching. Nature. 2011; 476:109–113.
5. OuYang B, Xie S, Berardi MJ, Zhao XM, Dev J, Yu W, Sun B, Chou JJ. Unusual architecture of the p7 channel from hepatitis C virus. Nature. 2013; 498:521–525.
6. Oxenoid K, Dong YS, Cao C, Cui T, Sancak Y, Markhard AL, Grabarek Z, Kong L, Liu Z, Ouyang B, Cong Y, Mootha VK, Chou JJ. Architecture of the Mitochondrial Calcium Uniporter. Nature. 2016; 533:269–273.
7. Dev J, Park D, Fu Q, Chen J, Ha HJ, Ghantous F, Herrmann T, Chang W, Liu Z, Frey G, Seaman MS, Chen B, Chou JJ. Structural Basis for Membrane Anchoring of HIV-1 Envelope Spike. Science. 2016; 353:172–75.
8. Zhou GP, Troy FA 2nd. Characterization by NMR and molecular modeling of the binding of polyisoprenols and polyisoprenyl recognition sequence peptides: 3D structure of the complexes reveals sites of specific interactions. Glycobiology. 2003; 13:51–71.
9. Zhou GP, Huang RB, Troy FA 2nd. 3D structural conformation and functional domains of polysialyltransferase ST8Sia IV required for polysialylation of neural cell adhesion molecules. Protein Pept Lett. 2015; 22:137–148.
10. Zhou GP, Zhong WZ. Perspectives in Medicinal Chemistry. Curr Top Med Chem. 2016; 16:381–382.
11. Carter DB. A model for structure dependent binding of Congo Red to Alzeheimer beta-amyloid fibrils. Neurobiol Aging. 1998; 19:37–40.
12. Chou KC. Modeling the tertiary structure of human cathepsin-E. Biochem Biophys Res Commun. 2005; 331:56–60.
13. Chou KC, Howe WJ. Prediction of the tertiary structure of the beta-secretase zymogen. Biochem Biophys Res Commun. 2002; 292:702–08.
14. Watenpaugh KD, Heinrikson RL. A Model of the complex between cyclin-dependent kinase 5 (Cdk5) and the activation domain of neuronal Cdk5 activator. Biochem Biophys Res Commun. 1999; 259:420–428.
15. Wei DQ, Sirois S, Du QS, Arias HR, Chou KC. Theoretical studies of Alzheimer’s disease drug candidate 3-[(2,4-dimethoxy)benzylidene]-anabaseine (GTS-21) and its derivatives. Biochem Biophys Res Commun. 2005; 338:1059–64.
16. Chou KC. Structural bioinformatics and its impact to biomedical science. Curr Med Chem. 2004; 11:2105–2134.
17. Jones D, Heinrikson RL. Prediction of the tertiary structure and substrate binding site of caspase-8. FEBS Lett. 1997; 419:49–54.
18. Chou JJ, Matsuo H, Duan H, Wagner G. Solution structure of the RAIDD CARD and model for CARD/CARD interaction in caspase-2 and caspase-9 recruitment. Cell. 1998; 94:171–180.
19. Chou JJ, Li H, Salvessen GS, Yuan J, Wagner G. Solution structure of BID, an intracellular amplifier of apoptotic signalling. Cell. 1999; 96:615–624.
20. Tomasselli AG, Heinrikson RL. Prediction of the Tertiary Structure of a Caspase-9/Inhibitor Complex. FEBS Lett. 2000; 470:249–256.
21. Chou KC. Insights from modeling the tertiary structure of human BACE2. J Proteome Res. 2004; 3:1069–72.
22. Harris ME, Hensley K, Butterfield DA, Leedle RA, Carney JM. Direct evidence of oxidative injury produced by the Alzheimer’s beta-amyloid peptide (1–40) in cultured hippocampal neurons. Exp Neurol. 1995; 131:193–202.
23. Hardy J, Selkoe DJ. The amyloid hypothesis of Alzheimer’s disease: progress and problems on the road to therapeutics. Science. 2002; 297:353–56.
24. Bartus RT, Dean RL 3rd, Beer B, Lippa AS. The cholinergic hypothesis of geriatric memory dysfunction. Science. 1982; 217:408–14.
25. Lewczuk P, Esselmann H, Bibl M, Beck G, Maler JM, Otto M, Kornhuber J, Wiltfang L. Tau protein phosphorylated at threonine 181 in CSF as a neurochemical biomarker in Alzheimer’s disease - Original data and review of the literature. J Mol Neurosci. 2004; 23:115–122.
26. Farlow M, Gracon SI, Hershey LA, Lewis KW, Sadowsky CH, Dolan-Ureno J, and The Tacrine Study Group. A controlled trial of tacrine in Alzheimer’s disease. JAMA. 1992; 268:2523–29.
27. Rogers SL, Friedhoff LT. Pharmacokinetic and pharmacodynamic profile of donepezil HCl following single oral doses. Br J Clin Pharmacol. 1998; 46:1–6.
28. Rösler M, Anand R, Cicin-Sain A, Gauthier S, Agid Y, Dal-Bianco P, Stähelin HB, Hartman R, Gharabawi M. Efficacy and safety of rivastigmine in patients with Alzheimer’s disease: international randomised controlled trial. BMJ. 1999; 318:633–38.
29. Zarotsky V, Sramek JJ, Cutler NR. Galantamine hydrobromide: An agent for Alzheimer’s disease. Am J Health Syst Pharm. 2003; 60:446–452.
30. Choi YH, Yon GH, Hong KS, Yoo DS, Choi CW, Park WK, Kong JY, Kim YS, Ryu SY. In vitro BACE-1 Inhibitory Phenolic Components from the Seeds of Psoralea corylifolia. Planta Med. 2008; 74:1405–1408.
31. Lv L, Yang QY, Zhao Y, Yao CS, Sun Y, Yang EJ, Song KS, Mook-Jung I, Fang WS. BACE1 (beta-secretase) inhibitory chromone glycosides from Aloe vera and Aloe nobilis. Planta Med. 2008; 74:540–545.
32. Rauter AP, Branco I, Lopes RG, Justino J, Silva FV, Noronha JP, Cabrita EJ, Brouard I, Bermejo J. A new lupene triterpenetriol and anticholinesterase activity of Salvia sclareoides. Fitoterapia. 2007; 78:474–481.
33. Wang H, Tang XC. Anticholinesterase effects of huperzine A, E2020, and tacrine in rats. Zhongguo Yao Li Xue Bao. 1998; 19:27–30.
34. Scott LJ, Goa KL. Galantamine - A review of its use in Alzheimer’s disease. Drugs. 2000; 60:1095–1122.
35. Yoshida S, Suzuki N. Antiamnesic and cholinomimetic side-effects of the cholinesterase inhibitors, physostigmine, tacrine and NIK-247 in rats. Eur J Pharmacol. 1993; 250:117–124.
36. Wei X, Jiang JS, Feng ZM, Zhang PC. Anthraquinone-benzisochromanquinone dimers from the roots of Berchemia floribunda. Chem Pharm Bull (Tokyo). 2008; 56:1248–52.
37. Brown MP, Royer C. Fluorescence spectroscopy as a tool to investigate protein interactions. Curr Opin Biotechnol. 1997; 8:45–9.
38. Croney JC, Jameson DM, Learmonth RP. Fluorescence spectroscopy in biochemistry: teaching basic principles with visual demonstrations. Biochem Mol Biol Educ. 2001; 29:60–65.
39. Ewing GW. Practical hints on absorption spectrometry (ultraviolet and visible). J Chem Educ. 1969; 46:A122.
40. Gillard RD. Circular dichroism. A review. Analyst (Lond). 1963; 88:825–28.
41. Chou KC, Wei DQ, Zhong WZ. Binding mechanism of coronavirus main proteinase with ligands and its implication to drug design against SARS. (Erratum: ibid., 2003, Vol.310, 675). Biochem Biophys Res Commun. 2003; 308:148–151.
42. Liao QH, Gao QZ, Wei J. Docking and Molecular Dynamics Study on the Inhibitory Activity of Novel Inhibitors on Epidermal Growth Factor Receptor (EGFR). Med Chem. 2011; 7:24–31.
43. Li XB, Wang SQ, Xu WR, Wang RL. Novel Inhibitor Design for Hemagglutinin against H1N1 Influenza Virus by Core Hopping Method. PLoS One. 2011; 6:e28111.
44. Wang JF, Wei DQ. Insights from investigating the interactions of adamantane-based drugs with the M2 proton channel from the H1N1 swine virus. Biochem Biophys Res Commun. 2009; 388:413–417.
45. Zhang T, Wei DQ. A Pharmacophore Model Specific to Active Site of CYP1A2 with a Novel Molecular Modeling Explorer and CoMFA. Med Chem. 2012; 8:198–207.
46. Du QS, Wang S, Wei DQ, Sirois S, Chou KC. Molecular modelling and chemical modification for finding peptide inhibitor against SARS CoV Mpro. Anal Biochem. 2005; 337:262–270.
47. Huang RB, Du QS, Wang CH, Chou KC. An in-depth analysis of the biological functional studies based on the NMR M2 channel structure of influenza A virus. Biochem Biophys Res Commun. 2008; 377:1243–47.
48. Du QS, Huang RB, Wang CH, Li XM. Energetic analysis of the two controversial drug binding sites of the M2 proton channel in influenza A virus. J Theor Biol. 2009; 259: 159–164.
49. Du QS, Huang RB, Wang SQ. Designing inhibitors of M2 proton channel against H1N1 swine influenza virus. PLoS One. 2010; 5:e9388.
50. Wang SQ, Du QS, Huang RB, Zhang DW. Insights from investigating the interaction of oseltamivir (Tamiflu) with neuraminidase of the 2009 H1N1 swine flu virus. Biochem Biophys Res Commun. 2009; 386:432–436.
51. Cai L, Wang Y, Wang JF. Identification of proteins interacting with human SP110 during the process of viral infections. Med Chem. 2011; 7:121–126.
52. Ma Y, Wang SQ, Xu WR, Wang RL. Design novel dual agonists for treating type-2 diabetes by targeting peroxisome proliferator-activated receptors with core hopping approach. PLoS One. 2012; 7:e38546.
53. Wang JF. Insights from modeling the 3D structure of New Delhi metallo-beta-lactamase and its binding interactions with antibiotic drugs. PLoS One. 2011; 6:e18414.
54. Wang JF, Chou KC. Insights into the Mutation-Induced HHH Syndrome from Modeling Human Mitochondrial Ornithine Transporter-1. PLoS One. 2012; 7:e31048.
55. Chou KC. Impacts of bioinformatics to medicinal chemistry. Med Chem. 2015; 11:218–234.
56. Ellman GL, Courtney KD, Andres V Jr, Feather-Stone RM. A new and rapid colorimetric determination of acetylcholinesterase activity. Biochem Pharmacol. 1961; 7:88–95.
57. Bourassaa P, Dubeaua S, Maharvi GM, Fauq AH, Thomas TJ, Tajmir-Riahi HA. Binding of antitumor tamoxifen and its metabolites 4-hydroxytamoxifen and endoxifen to human serum albumin. Biochimie. 2011; 93:1089–1101.
58. Mohammadi F, Bordbar AK, Divsalar A, Mohammadi K, Saboury AA. Interaction of Curcumin and Diacetylcurcumin with the Lipocalin Member β-Lactoglobulin. Protein J. 2009; 28:117–23.
59. Lakowicz JR, Masters BR. Principles of Fluorescence Spectroscopy, Third Edition. J Biomed Opt. 2008; 029901.
60. Bi S, Song D, Tian Y, Zhou X, Liu Z, Zhang H. Molecular spectroscopic study on the interaction of tetracyclines with serum albumins. Spectrochim Acta A Mol Biomol Spectrosc. 2005; 61:629–636.
61. Kandagal PB, Ashoka S, Seetharamappa J, Shaikh SM, Jadegoud Y, Ijare OB. Study of the interaction of an anticancer drug with human and bovine serum albumin: spectroscopic approach. J Pharm Biomed Anal. 2006; 41:393–99.
62. Xie MX, Xu XY, Wang YD. Interaction between hesperetin and human serum albumin revealed by spectroscopic methods. Biochim Biophys Acta. 2005; 1724:215–24.
63. Förster T. Zwischenmolekulare Energiewanderung und Fluoreszenz. Ann Phys. 1948; 437:55–75.
64. Chen X, Qian K, Chen Q. Comparison between loureirin A and cochinchinenin C on the interaction with human serum albumin. Eur J Med Chem. 2015; 93:492–500.
65. Berde CB, Hudson BS, Simoni RD, Sklar LA. Human serum albumin. Spectroscopic studies of binding and proximity relationships for fatty acids and bilirubin. J Biol Chem. 1979; 254:391–400.
66. Epps DE, Raub TJ, Caiolfa V, Chiari A, Zamai M. Determination of the affinity of drugs toward serum albumin by measurement of the quenching of the intrinsic tryptophan fluorescence of the protein. J Pharm Pharmacol. 1999; 51:41–48.
67. Chen NY. The biological functions of low-frequency phonons. Sci Sin. 1977; 20:447–457.
68. Chen NY, Forsen S. The biological functions of low-frequency phonons: 2. Cooperative effects. Chem Scr. 1981; 18:126–132.
69. Chou KC. The biological functions of low-frequency vibrations (phonons). 4. Resonance effects and allosteric transition. Biophys Chem. 1984; 20:61–71.
70. Chou KC. The biological functions of low-frequency vibrations (phonons). VI. A possible dynamic mechanism of allosteric transition in antibody molecules. Biopolymers. 1987; 26:285–295.
71. Mao B. Collective motion in DNA and its role in drug intercalation. Biopolymers. 1988; 27:1795–1815.
72. Chou KC. Low-frequency resonance and cooperativity of hemoglobin. Trends Biochem Sci. 1989; 14:212–213.
73. Chou KC. Review: Low-frequency collective motion in biomacromolecules and its biological functions. Biophys Chem. 1988; 30:3–48.
74. Chou KC. Coupling interaction between thromboxane A2 receptor and alpha-13 subunit of guanine nucleotide-binding protein. J Proteome Res. 2005; 4:1681–1686.
75. Zhou GP, Troy FA. NMR studies on how the binding complex of polyisoprenol recognition sequence peptides and polyisoprenols can modulate membrane structure. Curr Protein Pept Sci. 2005; 6:399–411.
76. Wei DQ, Du QS, Sirois S, Zhong WZ. Review: Progress in computational approach to drug development against SARS. Curr Med Chem. 2006; 13:3263–3270.
77. Wei H, Wang CH, Du QS, Meng J. Investigation into adamantane-based M2 inhibitors with FB-QSAR. Med Chem. 2009; 5:305–317.
78. Bourne Y, Taylor P, Radic Z, Marchot P. Structural insights into ligand interactions at the acetylcholinesterase peripheral anionic site. EMBO J. 2003; 22:1–12.
79. Castro A, Martinez A. Peripheral and dual binding site acetylcholinesterase inhibitors: implications in treatment of Alzheimer’s disease. Mini Rev Med Chem. 2001; 1:267–272.
80. Dvir H, Silman I, Harel M, Rosenberry TL, Sussman JL. Acetylcholinesterase: From 3D structure to function. Chem Biol Interact. 2010; 187:10–22.
81. Zhang CT. Review: Prediction of protein structural classes. Crit Rev Biochem Mol Biol. 1995; 30:275–349.
82. Ronco C, Sorin G, Nachon F, Foucault R, Jean L, Romieu A, Renard PY. Synthesis and structure-activity relationship of Huprine derivatives as human acetylcholinesterase inhibitors. Bioorg Med Chem. 2009; 17:4523–4536.
83. Cramer RD. Topomer CoMFA: A design methodology for rapid lead optimization. J Med Chem. 2003; 46:374–388.
84. Rosini M, Andrisano V, Bartolini M, Bolognesi M, Hrelia P, Minarini A, Tarozzi A, Melchiorre C. Rational approach to discover multipotent anti-Alzheimer drugs. J Med Chem. 2005; 48:360–363.
85. Recanatini M, Cavalli A, Belluti F, Piazzi L, Rampa A, Bisi A, Gobbi S, Valenti P, Andrisano V, Bartolini M, Cavrini V. SAR of 9-amino-1,2,3,4-tetrahydroacridine-based acetylcholinesterase inhibitors: synthesis, enzyme inhibitory activity, QSAR, and structure-based CoMFA of tacrine analogues. J Med Chem. 2000; 43:2007–2018.
86. Rampa A, Piazzi L, Belluti F, Gobbi S, Bisi A, Bartolini M, Andrisano V, Cavrini V, Cavalli A, Recanatini M, Valenti P. Acetylcholinesterase inhibitors: SAR and kinetic studies on ω-[N-methyl-N-(3-alkylcarbamoyloxyphenyl)methyl]aminoalkoxyaryl derivatives. J Med Chem. 2001; 44:3810–20.
87. Camps P, Formosa X, Galdeano C, Gomez T, Munoz-Torrero D, Scarpellini M, Viayna E, Badia A, Clos MV, Camins A, Pallas M, Bartolini M, Mancini F, et al. Novel donepezil-based inhibitors of acetyl- and butyrylcholinesterase and acetylcholinesterase-induced β-amyloid aggregation. J Med Chem. 2008; 51:3588–3598.
88. Piazzi L, Belluti F, Bisi A, Gobbi S, Rizzo S, Bartolini M, Andrisano V, Recanatini M, Rampa A. Cholinesterase inhibitors: SAR and enzyme inhibitory activity of 3-[omega-(benzylmethylamino)alkoxy]xanthen-9-ones. Bioorg Med Chem. 2007; 15:575–585.
89. Elsinghorst PW, Tanarro CM, Gütschow M. Novel heterobivalent tacrine derivatives as cholinesterase inhibitors with notable selectivity toward butyrylcholinesterase. J Med Chem. 2006; 49:7540–7544.
90. Du QS, Huang RB, Wei YT, Du LQ. Multiple Field Three Dimensional Quantitative Structure-Activity Relationship (MF-3D-QSAR). J Comput Chem. 2008; 29:211–219.
91. Xu Y, Ding J, Wu LY. iSNO-PseAAC: Predict cysteine S-nitrosylation sites in proteins by incorporating position specific amino acid propensity into pseudo amino acid composition. PLoS One. 2013; 8:e55844.
92. Chen W, Tang H, Ye J, Lin H. iRNA-PseU: Identifying RNA pseudouridine sites. Mol Ther Nucleic Acids. 2016; 5:e332.
93. Feng P, Ding H, Yang H, Chen W, Lin H. iRNA-PseColl: Identifying the occurrence sites of different RNA modifications by incorporating collective effects of nucleotides into PseKNC. Mol Ther Nucleic Acids. 2017; 7:155–163.
94. Liu B, Yang F. 2L-piRNA: A two-layer ensemble classifier for identifying piwi-interacting RNAs and their function. Mol Ther Nucleic Acids. 2017; 7:267–277.
95. Xu Y, Wen X, Wen LS, Wu LY, Deng NY. iNitro-Tyr: Prediction of nitrotyrosine sites in proteins with general pseudo amino acid composition. PLoS One. 2014; 9:e105018.
96. Chen W, Feng P, Yang H, Ding H, Lin H, Chou KC. iRNA-AI: identifying the adenosine to inosine editing sites in RNA sequences. Oncotarget. 2017; 8:4208–17. https://doi.org/10.18632/oncotarget.13758.
97. Cheng X, Zhao SG, Xiao X, Chou KC. iATC-mHyb: a hybrid multi-label classifier for predicting the classification of anatomical therapeutic chemicals. Oncotarget. 2017 Apr 11. https://doi.org/10.18632/oncotarget.17028. [Epub ahead of print].
98. Qiu WR, Jiang SY, Xu ZC, Xiao X, Chou KC. iRNAm5C-PseDNC: identifying RNA 5-methylcytosine sites by incorporating physical-chemical properties into pseudo dinucleotide composition. Oncotarget. 2017; 8:41178–88. https://doi.org/10.18632/oncotarget.17104.
99. Xu Y, Shao XJ, Wu LY, Deng NY. iSNO-AAPair: incorporating amino acid pairwise coupling into PseAAC for predicting cysteine S-nitrosylation sites in proteins. PeerJ. 2013; 1:e171.
100. Zhang CJ, Tang H, Li WC, Lin H, Chen W, Chou KC. iOri-Human: identify human origin of replication by incorporating dinucleotide physicochemical properties into pseudo nucleotide composition. Oncotarget. 2016; 7:69783–93. https://doi.org/10.18632/oncotarget.11975.
101. Liu LM, Xu Y. iPGK-PseAAC: identify lysine phosphoglycerylation sites in proteins by incorporating four different tiers of amino acid pairwise coupling information into the general PseAAC. Med Chem. 2017 May 15. https://doi.org/10.2174/1573406413666170515120507. [Epub ahead of print].
102. Jia J, Liu Z, Xiao X, Liu B. pSuc-Lys: Predict lysine succinylation sites in proteins with PseAAC and ensemble random forest approach. J Theor Biol. 2016; 394:223–230.
103. Cheng X, Zhao SG, Xiao X. iATC-mISF: a multi-label classifier for predicting the classes of anatomical therapeutic chemicals. Bioinformatics. 2017; 33:341–346.
104. Liu B, Wang S, Long R. iRSpot-EL: identify recombination spots with an ensemble learning approach. Bioinformatics. 2017; 33:35–41.
105. Xu Y, Wang Z, Li C, Chou KC. iPreny-PseAAC: identify C-terminal cysteine prenylation sites in proteins by incorporating two tiers of sequence couplings into PseAAC. Med Chem. 2017 Apr 19. https://doi.org/10.2174/1573406413666170419150052. [Epub ahead of print].
106. Qiu WR, Jiang SY, Sun BQ, Xiao X, Cheng X, Chou KC. iRNA-2methyl: identify RNA 2′-O-methylation sites by incorporating sequence-coupled effects into general PseKNC and ensemble classifier. Med Chem. 2017 Jun 22. https://doi.org/10.2174/1573406413666170623082245. [Epub ahead of print].
107. Cheng X, Xiao X, Chou KC. pLoc-mPlant: predict subcellular localization of multi-location plant proteins by incorporating the optimal GO information into general PseAAC. Mol Biosyst. 2017 Jul 12. https://doi.org/10.1039/c7mb00267j. [Epub ahead of print].
108. Shen HB. Recent advances in developing web-servers for predicting protein attributes. Nat Sci. 2009; 1:63–92.