
INTRODUCTION
Sarcomas are malignant tumors that are characterized by a wide diversity of subtypes with various cytogenetic profiles. Despite major treatment breakthroughs, standard treatment modalities combining chemotherapy, radiotherapy and surgery have failed to improve overall survival [1]. Together, sarcomas affect approximately 11,000 individuals in the United States each year and approximately 200,000 worldwide, arising from multiple lineages and ranging from indolent tumors to those which are highly invasive and metastatic [2]. Recent data reports 5-year survival rates of 66% for bone and soft tissue sarcomas, 53.9% for osteosarcoma, 75.2% for chondrosarcoma and 50.6% for Ewing’s sarcoma [3].
Immune escape is regarded as an important biological process for primary cancer growth and metastasis. Programmed death 1 (PD-1) and programmed death-ligand 1 (PD-L1) have proved to play a predominant role in cancer immune surveillance [4, 5]. In solid tumors, PD-1/PD-L1 blockade has achieved profound progress, showing vast potential for tumor therapy [6–9]. In order to improve survival outcome of patients with sarcoma, the association between PD-L1 expression and prognosis of sarcoma patients has been examined, but the results have been controversial.
In the present study, a meta-analysis was conducted to evaluate the association between PD-L1 expression and clinicopathological characteristics or survival outcomes in bone and soft-tissue sarcoma patients.
RESULTS
Search results
For primary retrieval, a total of 342 citations were identified by searching through three electronic databases, including 64 citations in PubMed, 154 citations in Embase and 124 citations in Web of Science. After removing 122 duplicates, the remaining 220 records were screened during the initial filtering, in which 169 records were excluded after viewing the titles and abstracts. From the remaining 51 articles a further 38 were excluded after viewing the full-text, including 29 articles with insufficient data, two with overlapping patients, six articles that were not relevant and one bioinformatics analysis. Eventually, 13 manuscripts [10–22] containing 14 independent studies were enrolled in the meta-analysis (Figure 1).
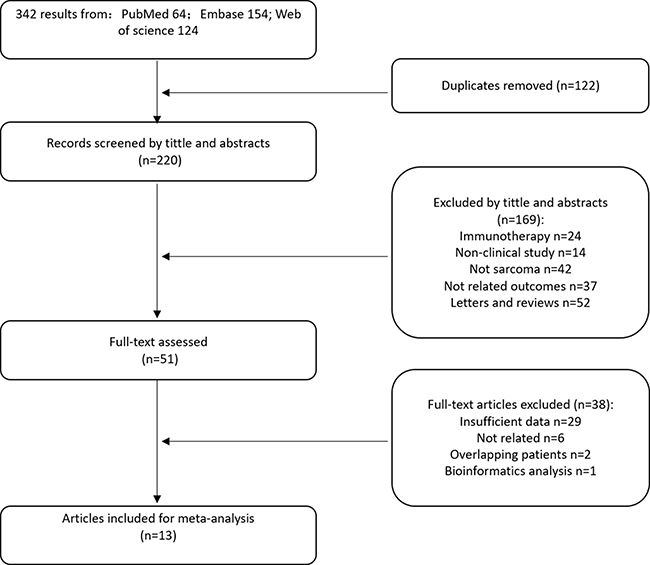
Figure 1: Flow chart for selection of studies.
Study characteristics
All studies that were included were published between 2013 and 2017, the number of patients in each study ranging from 13 to 137. The proportion of patients expressing PD-L1 ranged from 6% to 75%. The basic characteristics of the 14 eligible studies are summarized in Table 1. Among them, 12 studies assessed the prognostic significance of PD-L1 expression and 13 focused on investigating its clinicopathological significance. Osteosarcoma was the most researched in seven studies. The histological subtypes discussed in the other studies were a mixed type of soft-tissue sarcoma in three studies, a mixed type of bone and soft-tissue sarcoma, chondrosarcoma, and angiosarcoma in three independent studies.
Table 1: Features of included studies
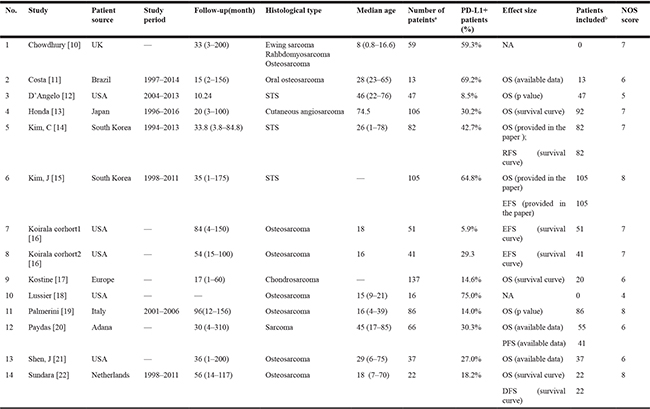
a:total number of patients included in each study; b: number of patients included in survival analysis.
NOS: Newcastle-Ottawa Scale; STS: soft-tissue sarcoma; NA: not available; OS: overall survival; RFS: recurrence-free survival; EFS: event-free survival; DFS: disease-free survival; PFS: progress-free survival.
To detect the expression of PD-L1, all studies used immunohistochemistry, except for one study [21], which used quantitative real-time PCR, but the proportion of PD-L1 expression in that study was consistent with the others. The detailed methodologies used to detect PD-L1 are summarized in Table 2. When it came to survival outcomes, different effect sizes and outcomes were reported, including overall survival (OS) reported in 10 studies, event-free survival (EFS) reported in three, and recurrence-free survival (RFS), disease-free survival (DFS) and progress-free survival (PFS) reported independently in three studies. Additionally, in Koirala’s study [16], two cohorts of patients were reported, PD-L1 was assessed with distinct operations and the survival curves were reported independently, so they have been statistically analyzed as two individual studies. All studies were followed for more than five years.
Table 2: Methods for PD-L1 detection
Study |
Method |
Antibody type |
Antibody dilution |
Antibody source |
Cutoff value |
|---|---|---|---|---|---|
Chowdhury |
IHC |
—— |
Abcam |
> 5% of tumor cells |
|
Costa |
IHC |
Monoclonal |
1: 400 |
Cell signaling |
Total score > 2a |
D’Angelo |
IHC |
—— |
—— |
DAKO |
> 1% of tumor cells |
Honda |
IHC |
Monoclonal |
—— |
Spring bioscience |
> 5% of tumor region |
Kim, C |
IHC |
Monoclonal |
1: 100 |
R&D system |
Total score > 2a |
Kim, J |
IHC |
—— |
1: 100 |
Santa Cruz |
Total score > 8b |
Koirala |
IHC |
Monoclonal |
1: 50 |
—— |
> 1% of tumor cells |
kostine |
IHC |
Monoclonal |
1: 400 |
Cell signaling |
> 1% of cells |
Lussier |
IHC |
Monoclonal |
1:200 |
Abcam |
> 1 cell/high-power field |
Palmerini |
IHC |
—— |
—— |
—— |
—— |
Paydas |
IHC |
—— |
—— |
AM26531AF-N Acris |
> 5% of cells |
Shen, J |
qRT-PCR |
||||
Sundara |
IHC |
Monoclonal |
1: 400 |
Cell signaling |
≥ 1% of cells |
IHC: immunohistochemistry
qRT-PCR: quantitative real time polymerase chain reaction
a :Total score was calculated by adding a score of staining percentage to another score of staining intensity. The area of staining was scored as 0 (no tumor cells stained), 1 (< 25% of cells stained), 2 (≥ 25% of cells stained). Staining intensity was graded as 0 (no staining), 1 (weak staining), 2 (moderate staining), 3 (strong staining)
b:Total score was calculated by summing up the proportion score and intensity score of two different tissue microarray (TMA) cores. The area of staining was scored as 0 (0–10% of the cells stained), 1 (11–33% of the cells stained), 2 (34–66% of the cells stained), and 3 (67–100% of the cells stained). The staining intensity scored as 0 (no staining), 1 (weak staining), 2 (intermediate staining), and 3 (strong staining).
Correlation between PD-L1 expression and overall survival
A total of 10 studies with 559 patients were enrolled in the analysis of overall survival. As a significant degree of heterogeneity was detected (I2 = 67.5%, p = 0.001), subgroup analysis was performed to clarify the source. In subgroup analysis stratified by histological subtype, the pooled hazard ratio (HR) estimate for overall survival was 1.987 (95% CI: 1.224–3.224, p = 0.005) in patients with bone sarcoma (osteosarcoma and chondrosarcoma) with no heterogeneity (I2 = 0.0%, p = 0.519), and 1.625 (95% CI: 0.627–4.216, p = 0.318) in patients with soft-tissue sarcomas with high heterogeneity (I2 = 83.0%, p = 0.000) (Figure 2A). As for individual histological type, PD-L1 was a poor prognostic factor for osteosarcoma with a pooled HR of 1.908 (95% CI: 1.093–3.331, p = 0.023) (Figure 2B). In the subgroup analysis stratified by country, pooled HR was 1.546 (95% CI: 1.005–2.379, p = 0.047) for non-Asian patients, with low heterogeneity (I2 = 5.7%, p = 0.384), and 2.033 (95% CI: 0.526–7.849, p = 0.303) for Asian patients with high heterogeneity (I2 = 90.6%, p = 0.000) (Figure 2C). When stratified by the number of patients, pooled HR was 1.779 (95% CI: 1.072–2.951, p = 0.026) for studies of which the patients included were less than 50, with no heterogeneity (I2 = 0.0%, p = 0.580) (Figure 2D). To clarify the impact of a different cut-off of PD-L1 expression on the results, we conducted subgroup analysis stratified by cut-off. Both when cut-off <= 5% and in studies without clear cut-off the heterogeneity was negligible, but there was no statistical significance between PD-L1 expression and overall survival (Figure 2E). As for the two studies [19, 21] without any definition of cut-off, exclusion of either did not change the conclusion for bone sarcoma (Supplementary Figure 1A, 1B), but the conclusion for non-Asian patients did change (Supplemental data, Figure 1C, 1D).
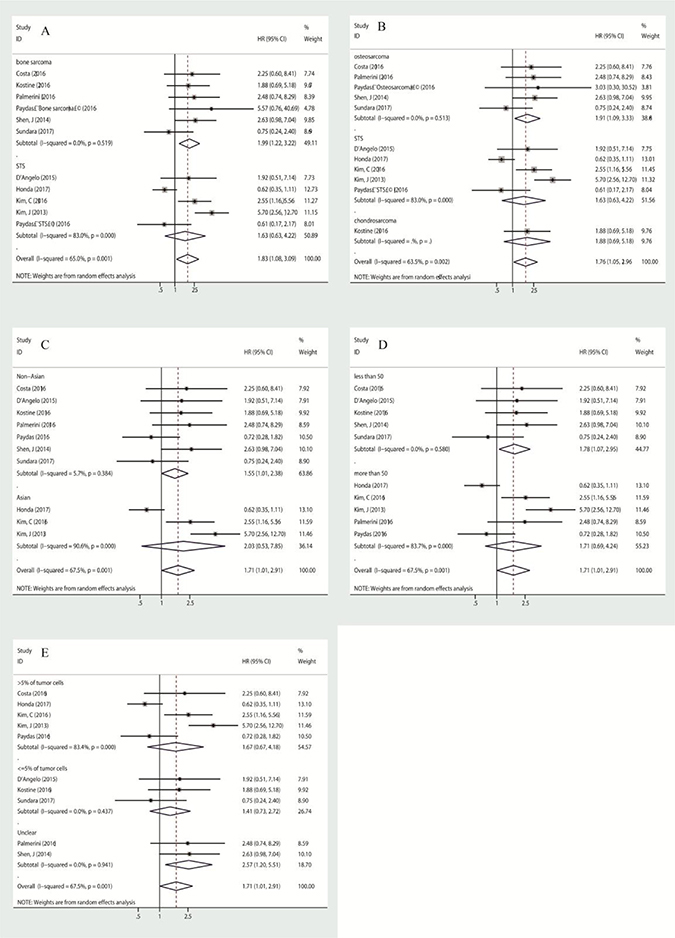
Figure 2: Subgroup analysis of association between PD-L1 expression and overall survival, stratified by histological subtype (A, B), by patient source (C), by the number of patients included in the study (D), by cut-off (E).
Correlation between PD-L1 expression and event-free survival
Three studies assessed the correlation between PD-L1 and event-free survival. An event was defined as local recurrence, later distant metastasis or death, which is in accordance with the meaning of DFS, RFS or PFS. We combined the HRs of EFS, DFS, RFS and PFS, this pooled HR taken as the effect size to assess survival outcome. Due to medium heterogeneity (I2 = 65.6%, p = 0.012) in the group, a random-effects model was used to assess it, with a pooled HR of 1.943 (95% CI: 1.028–3.674, p = 0.041). In subgroup analyses, whether stratified by histological subtype, country or cut-off, heterogeneity was not excluded (Figure 3A–3C). When stratified by numbers of patients, pooled HR was 2.286 (95% CI: 1.133–4.612, p = 0.021) for group of which patients were more than 50, with medium heterogeneity (I2 = 54.3%, p = 0.112) (Figure 3D). However, when they were stratified by effect size, both subgroups, including the EFS group and other effect groups including PFS, DFS and RFS, showed negligible heterogeneity. The HR of pooled EFS was 3.868 (95% CI: 2.298–6.511, p = 0.000) with no heterogeneity (I2 = 0.0%, p = 0.581), and the HR of pooled RFS/DFS/PFS was 1.164 (95% CI: 0.753–1.800, p = 0.495) with no heterogeneity (I2 = 0.0%, p = 0.486) (Figure 3E). Overall, PD-L1 was poorly prognostic for event-free survival in both bone and soft-tissue sarcoma patients.
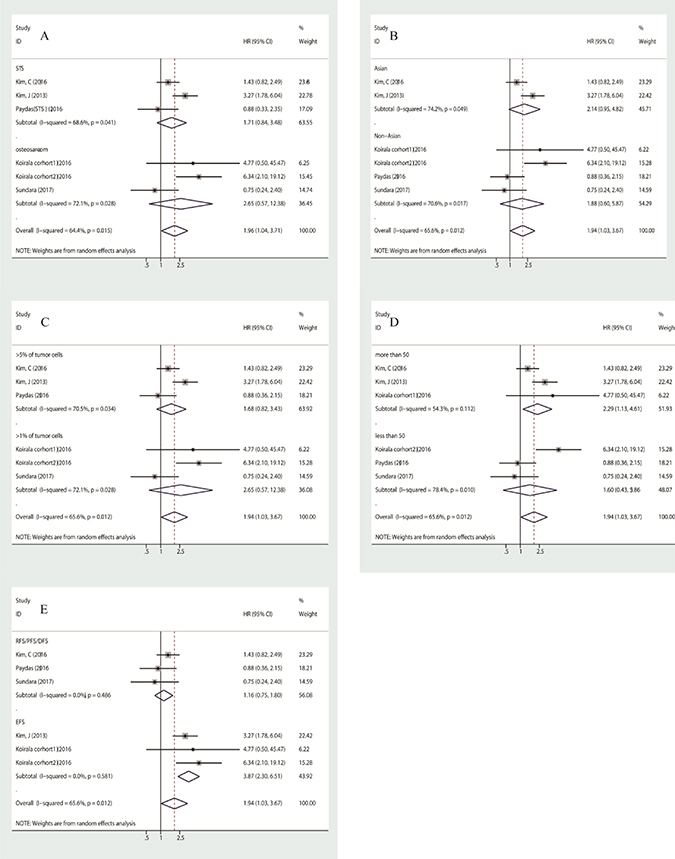
Figure 3: Subgroup analysis of association between PD-L1 expression and event-free survival, stratified by histological subtype (A), by patient source (B), by cut-off (C), by number of patients (D), by effect size (E).
Correlation between PD-L1 expression and tumor clinicopathlogical features
Five studies assessed the correlation of PD-L1 expression with infiltration of PD-1 positive T-lymphocytes with low heterogeneity (I2 = 45.8%, p = 0.100). Using a fixed-effects model, pooled OR was calculated to be 4.012 (95% CI: 2.391–6.733, p = 0.000), indicating that PD-L1 expression was significantly associated with the infiltration of PD-1 positive lymphocytes (Figure 4A). Nevertheless, it should be noted that a significant publication bias was found in the analysis (Figure 4B). Furthermore, we failed to find a significant correlation between age, gender, metastasis, tumor site or size or grade, and the infiltration of CD3+/CD4+/CD8+ T-lymphocytes. Data is shown in Table 3.
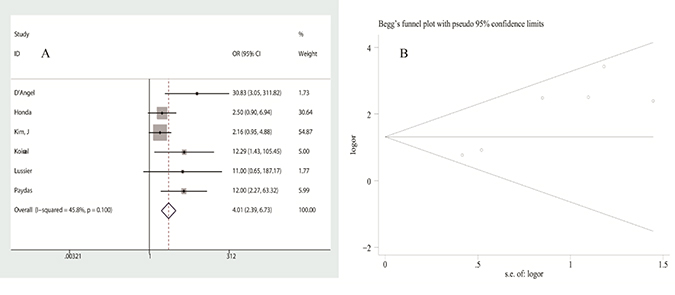
Figure 4: Analysis of the association between PD-L1 expression and PD-1+ T-lymphocyte infiltration: (A) forest plot of ORs, (B) publication bias.
Table 3: Association between PD-L1 expression and clinical features
Association between PD-L1 expression and clinical features |
NO. of study |
OR 95% CI |
z, P (OR) |
Heterogeneity test (I2, P bias) |
Publication Bias (Egger test)(t, P) |
Pooling model |
|---|---|---|---|---|---|---|
Age < 20 VS Age ≥ 20 |
12,13 |
2.228 (0.612–8.110) |
1.22, 0.224 |
0.0%, 0.480 |
fixed |
|
Male VS Female |
1,2,4,5,6,12,13 |
1.250 (0.849–1.842) |
1.13, 0.258 |
35.0%, 0.161 |
−0.68, 0.525 |
fixed |
Initial distant metastasis at diagnosis YES VS NO |
2,5,6 |
1.681 (0.846–3.340) |
1.48, 0.138 |
31.8%, 0.231 |
−0.60, 0.655 |
fixed |
tumor site limbs VS others |
4,5,12 |
1.537 (0.474–4.987) |
0.72, 0.474 |
57.4%, 0.095 |
−0.30, 0.813 |
random |
Size >5 cm VS ≤ 5 cm |
2,6,12 |
1.032 (0.513–2.076) |
0.09, 0.929 |
0.0%, 0.653 |
−1.03, 0.490 |
fixed |
Grade 2, 3 VS 1 |
5,6 |
2.670 (0.884–8.064) |
1.74, 0.082 |
54.8%, 0.137 |
random |
|
CD4+ T lymphocytes infiltration YES VS NO |
3,7 |
2.452 (0.689–8.731) |
1.38, 0.166 |
0.0%, 0.942 |
fixed |
|
CD8+ T lymphocytes infiltration YES VS NO |
1,3,7 |
2.269 (0.615–8.364) |
1.23, 0.218 |
59.3%, 0.086 |
6.24, 0.101 |
random |
PD-1+ T lymphocytes infiltration YES VS NO |
3,4,6,7,10,12 |
4.012 (2.391–6.733) |
5.26, 0.000* |
45.8%, 0.100 |
4.76, 0.009* |
fixed |
OR: odds ratio.
*:statistical significance.
Sensitivity analysis and evaluation of Publication bias
Sensitivity analysis was conducted to evaluate the influence of a unique study on pooled HR. As shown in Figure 5A and 5B, the pooled HRs float within the 95% confidence interval, indicating that the results are stable and reliable. To assess publication bias, a Begg’s funnel plot was used, in which log HRs were plotted against their corresponding standard errors (SEs). No apparent asymmetry was observed in the funnel plot through visual evaluation (Figure 6A, 6B). Furthermore, Egger’s test which provides statistical estimation of publication bias found no evidence of it (p = 0.350 in OS, p = 0.848 in EFS), indicating that such bias was not present within the studies.
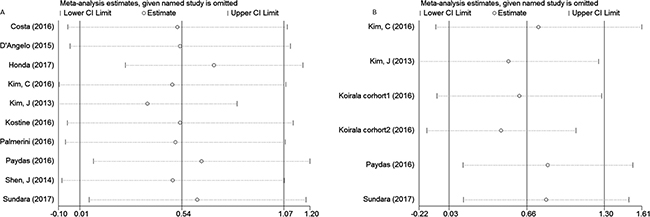
Figure 5: Sensitivity analysis for the association between PD-L1 expression and overall survival (A), event-free survival (B).
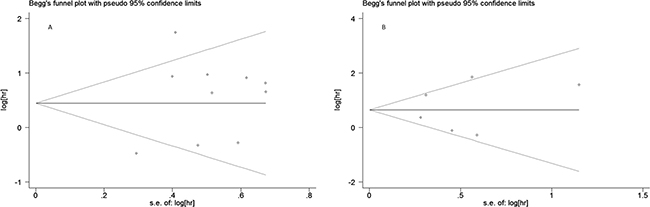
Figure 6: Begg’s funnel plot for publication bias analysis: (A) association between PD-L1 expression and overall survival, (B) association between PD-L1 expression and event-free survival.
DISCUSSION
Sarcoma is a rare heterogeneous disease with more than 70 different subtypes, accounting for 1% of all cancers diagnosed in the United States each year [12]. Metastasis is common among these patients, and cures using traditional therapies for sarcomas have been stagnant for decades. In contrast, there have been tremendous breakthroughs in other malignancies by manipulating the immune system with checkpoint inhibitors [12]. Therefore, there are high expectations for immunotherapy when the field matures and a better understanding of its mechanism of action has been gained [1].
The interaction between PD-L1 in tumor cells and PD -1 in T-lymphocytes negatively regulates the tumor-killing function of T-lymphocytes and protects tumor cells from the host immune system. Recently, much attention has been paid to PD-L1 expression in various solid tumors, due to the FDA’s approval for anti-PD-1 antibodies in non-small cell lung cancer and melanoma with good efficacy and safety. Several clinical trials have reported that therapies targeting PD-1 and its ligand (PD-L1) improve patient outcomes, while tumor response has been related to PD-L1 expression [23, 24]. Recent studies have indicated that high expression of PD-L1 is associated with poor prognosis in non-small cell lung cancer, kidney cancer, bladder cancer, prostate and gastric cancer [25–29]. However, for patients with osteosarcoma, the association between the expression of PD-L1 and their survival outcomes remains controversial. Multiple studies have indicated that PD-L1 expression is associated with a significant poor survival outcome [10, 11, 14–16], while one study reported the opposite effect [13] and other studies have shown no association [12, 17, 19–22].
In the current meta-analysis, we combined 14 studies related to prognosis and clinicopathology of PD-L1 expression in sarcoma patients. For all sarcoma patients, we found that the expression of PD-L1 was significantly associated with poor event-free survival. In contrast, PD-L1 expression was significantly associated with overall survival in bone sarcoma (osteosarcoma and chondrosarcoma) rather than soft tissue sarcoma. As for patient ethnicity, there was a significant association between PD-L1 expression and poor overall survival in non-Asian patients, but one should draw conclusions carefully, in consideration of bias caused by the cut-off. Moreover, PD-L1 expression predicts poor event-free survival in bone and soft tissue sarcoma.
We found that PD-L1 expression was significantly associated with the infiltration of PD-1 positive T-lymphocytes, indicating that an adaptive immune resistance mechanism may be occurring [30]. In this case, PD-L1 was likely upregulated because of a negative feedback loop that follows the activation of cytotoxic cells [31], a correlation that was confirmed in mRNA expression levels in soft-tissue sarcoma patients by Bertucci [31]. Therefore, the positive correlation between PD-L1 expression and PD-1 positive lymphocytes assessed here suggests that immune checkpoint PD-L1/PD-1 blockade holds great potential for improving the survival of sarcoma patients. In this case, blockade of PD-L1 might help reactivate inhibited T cells to increase the antitumor immune response.
Significant heterogeneity was noted in some analyses in the current study. This could have arisen from various sources. Firstly, the methods of PD-L1 measurement varied among these studies. Although the most common method was IHC, they did not use the same antibody and the dilution was also different. Because the type and the concentration of antibody can affect the sensitivity of IHC, differences also exist in the definition of PD-L1 expression. Secondly, the region where PD-L1 was expressed was not clear. Limited studies distinguished whether the PD-L1-positive cell region was from the tumor cells or the tumor microenvironment [12, 19, 20], whereas others have taken them together as tumor tissue PD-L1 expression [10, 11, 13–18, 21, 22]. It appears from the studies that the nature of PD-L1 expression differed within the same cohort of patients. In order to reduce the error among studies, we assessed as positive expression of PD-L1 in both the tumor and tumor environment. Furthermore, the association between overall survival and PD-L1 expression whether in the tumor or its microenvironment was found to have no statistically significant difference, due to the limited number of studies (Supplementary Figure 2).
Another potential source of bias may be linked to the method of calculation of the HRs. When the data from multivariate or univariate survival analyses were reported, we used them directly. If the HRs were not provided explicitly, we calculated them from outcome data available in the articles. If this was impracticable, we extrapolated them from the Kaplan-Meier curves or quoted p values using Tierney’s methods [32], which was less reliable than using the HRs given directly in the papers. To minimize statistical bias brought about by comparing data from univariate and multivariate analyses, we preferentially used HRs from univariate analyses, except for one study [13], of which only the results of multivariate analysis were provided. Our conclusions of STS analysis did not change whether this study was excluded or not (Supplementary Figure 3).
Publication bias is another concern in all forms of meta-analysis because only positive results tend to be published in journals. To minimize publication bias, we attempted to conduct literature searches as completely as possible, using Web of Science, PubMed, Embase and the Cochrane Library. No significant publication bias was found in this meta-analysis, except for the analysis of tumor infiltration of PD-1 positive lymphocytes.
Additionally, the definition of bone sarcoma and soft-tissue sarcoma may bring heterogeneity to the whole meta-analysis. In other papers, osteosarcoma, Ewing sarcoma and chondrosarcoma have been included in the category of bone sarcoma [33]. However, in the papers included in this meta-analysis, two studies [14, 15] included Ewing sarcoma together with other soft tissue sarcomas and defined them all as STS, with 24 being the total number for such Ewing sarcoma patients. As survival outcomes were provided as a whole, we could not extract them from the pooled results. To minimize statistical bias, we analyzed whether exclusion of either or both of these studies would alter our conclusion of STS. However, we found that it did not (Supplementary Figure 4).
Therefore, the results of the current meta-analysis should be interpreted with caution and should be confirmed in well-designed prospective studies with appropriate multivariate analyses.
In conclusion, this meta-analysis demonstrated that PD-L1 expression may be an effective predictive factor of poor prognosis and clinicopathological features for bone and soft tissue sarcomas. Furthermore, PD-L1 expression could be used to identify a subgroup of patients who would potentially benefit from targeted therapy against PD-1 or PD-L1.
MATERIALS AND METHODS
Data source
A systematic literature search of PubMed, Embase and the Cochrane Library was undertaken with no language restrictions (last search, April 2017). The strategy used was to search for the following words in relevant literature: (“sarcoma” OR “soft tissue sarcoma” OR “bone sarcoma” OR “osteosarcoma” OR “chondrosarcoma” OR “Ewing sarcoma” OR “leiomyosarcoma” OR “angiosarcoma” OR “synovial sarcoma” OR “malignant fibrous histiocytoma” OR “liposarcoma” OR “rhabdomyosarcoma”) AND (“CD274” OR “B7-H1” OR “PD-L1” OR “programmed cell death 1 ligand 1 protein”).
Inclusion criteria
Patients and studies had to fulfill the following criteria to be included in the analysis: (1) Patients with pathologically confirmed sarcoma who underwent detection of PD-L1 in their tumor tissue; (2) Studies evaluating the relationship between PD-L1 and clinical features and/or survival outcomes. Studies were excluded if they: (1) were case reports, reviews or letters; (2) comprised overlapping sarcoma patients; (3) had insufficient information such that the correlation of clinical features or survival outcomes could not be extracted. When there were multiple publications regarding the same group of patients, only the most recent publication was included. Two researchers (Zhenhua Zhu, Zheng Jin) screened the titles and abstracts of all the searched articles and verified that the studies met the inclusion criteria for subsequent analysis.
Data extraction
The final articles that were included were assessed independently by two researchers (Zhenhua Zhu, Zheng Jin). Data extracted included: (1) basic information including first author, year of publication, study period, follow-up duration; (2) information about the patients and tumors, including patient source, number of patients, gender, age, number of patients with PD-L1 expression, histological type of tumor, tumor site, tumor size, grade at diagnosis, tumor-infiltrating lymphocytes; (3) outcome measures including metastasis, recurrence, survival data, Kaplan-Meier curves, p values and events; and (4) other variables including the methods of quantitative PD-L1 measurement, the definition of positivity (the cut-off value) and the antibody’s type, source and dilution used for immunohistochemistry (IHC). Disagreements were settled by consultation.
Quality assessment
In accordance with the Newcastle-Ottawa Scale (http://www.ohri.ca/programs/clinical_epidemiology/nos_manual.pdf), assessment of quality mainly focused on selection (representativeness, selection of the non-exposed, ascertainment of exposure and outcome of interest), comparability, and the outcome (assessment and follow-up) of the original studies. Assessment was carried out independently by two researchers (Zhenhua Zhu, Zheng Jin).
Statistical analysis
For the quantitative aggregation of the survival results, hazard ratios (HRs) and their 95% confidence intervals (CIs) were combined to give the effect size. Additionally, the pooled ORs and their corresponding 95% CIs were utilized to quantitatively determine the association between PD-L1 and clinicopathological characteristics of patients. Statistical heterogeneity among studies was assessed using Cochran’s Q test and Higgins I2 statistic. A fixed-effects model (Mantel-Haenszel method) was used to calculate parameters when no obvious heterogeneity existed among studies (I2 > 50% suggested high heterogeneity). Otherwise, a random-effects model was utilized. Publication bias was measured using funnel plots and Egger’s test. All statistical analyses were conducted using STATA version 12.0 (STATA corp., College Station, TX.)
Abbreviations
PD-L1: programmed death-ligand 1; PD-1: programmed death 1; HR: hazard ratio; OR: odds ratio; STS: soft tissue sarcoma; OS: overall survival; EFS: event-free survival; PFS: progress-free survival; RFS: recurrence-free survival; DFS: disease-free survival; IHC: immunohistochemistry; qRT-PCR: quantitative real time polymerase chain reaction.
Authors’ contributions
Zhenhua Zhu and Dahui Sun designed the study, Zhenhua Zhu and Zheng Jin performed the literature retrieval and information extraction, and others performed statistical analysis. Zhenhua Zhu and Mei Zhang drafted the manuscript. All authors read and approved the final version of the manuscript.
ACKNOWLEDGMENTS
None.
CONFLICTS OF INTEREST
None.
FUNDING
This study was supported by Special Projects of Health in Jilin Province (3D5148273428).
REFERENCES
1. Ghosn M, El Rassy E, Kourie HR. Immunotherapies in sarcoma: Updates and future perspectives. World J Clin Oncol. 2017; 8:145–50. https://doi.org/10.5306/wjco.v8.i2.145.
2. Jemal A, Siegel R, Xu J, Ward E. Cancer statistics, 2010. CA Cancer J Clin. 2010; 60:277–300. https://doi.org/10.3322/caac.20073.
3. Damron TA, Ward WG, Stewart A. Osteosarcoma, chondrosarcoma, and Ewing’s sarcoma: National Cancer Data Base Report. Clin Orthop Relat Res. 2007; 459:40–7. https://doi.org/10.1097/BLO.0b013e318059b8c9.
4. Qorraj M, Bruns H, Bottcher M, Weigand L, Saul D, Mackensen A, Jitschin R, Mougiakakos D. The PD-1/PD-L1 axis contributes to immune metabolic dysfunctions of monocytes in chronic lymphocytic leukemia. Leukemia. 2017; 31:470–8. https://doi.org/10.1038/leu.2016.214.
5. Rosenblatt J, Avigan D. Targeting the PD-1/PD-L1 axis in multiple myeloma: a dream or a reality? Blood. 2017; 129:275–9. https://doi.org/10.1182/blood-2016–08-731885.
6. Balar AV, Weber JS. PD-1 and PD-L1 antibodies in cancer: current status and future directions. Cancer Immunol Immunother. 2017; 66:551–64. https://doi.org/10.1007/s00262-017-1954-6.
7. Bellmunt J, Powles T, Vogelzang NJ. A review on the evolution of PD-1/PD-L1 immunotherapy for bladder cancer: The future is now. Cancer Treat Rev. 2017; 54:58–67. https://doi.org/10.1016/j.ctrv.2017.01.007.
8. Iwai Y, Hamanishi J, Chamoto K, Honjo T. Cancer immunotherapies targeting the PD-1 signaling pathway. J Biomed Sci. 2017; 24:26. https://doi.org/10.1186/s12929-017-0329-9.
9. Zhuansun Y, Huang F, Du Y, Lin L, Chen R, Li J. Anti-PD-1/PD-L1 antibody versus conventional chemotherapy for previously-treated, advanced non-small-cell lung cancer: a meta-analysis of randomized controlled trials. J Thorac Dis. 2017; 9:655–65. https://doi.org/10.21037/jtd.2017.03.104.
10. Chowdhury F, Dunn S, Mitchell S, Mellows T, Ashton-Key M, Gray JC. PD-L1 and CD8(+)PD1(+) lymphocytes exist as targets in the pediatric tumor microenvironment for immunomodulatory therapy. Oncoimmunology. 2015; 4. https://doi.org/10.1080/2162402x.2015.1029701.
11. Costa Arantes DA, Gonçalves AS, Jham BC, Duarte EC, de Paula ÉC, de Paula HM, Mendonça EF, Batista AC. Evaluation of HLA-G, HLA-E, and PD-L1 proteins in oral osteosarcomas. Oral Surg Oral Med Oral Pathol Oral Radiol. 2017; 123:e188–96. https://doi.org/10.1016/j.oooo.2016.12.002.
12. D’Angelo SP, Shoushtari AN, Agaram NP, Kuk D, Qin LX, Carvajal RD, Dickson MA, Gounder M, Keohan ML, Schwartz GK, Tap WD. Prevalence of tumor-infiltrating lymphocytes and PD-L1 expression in the soft tissue sarcoma microenvironment. Hum Pathol. 2015; 46:357–65. https://doi.org/10.1016/j.humpath.2014.11.001.
13. Honda Y, Otsuka A, Ono S, Yamamoto Y, Seidel JA, Morita S, Hirata M, Kataoka TR, Takenouchi T, Fujii K, Kanekura T, Okubo Y, Takahashi K, et al. Infiltration of PD-1-positive cells in combination with tumor site PD-L1 expression is a positive prognostic factor in cutaneous angiosarcoma. Oncoimmunology. 2016; 6:e1253657. doi: 10.1080/2162402X.2016.1253657.
14. Kim C, Kim EK, Jung H, Chon HJ, Han JW, Shin KH, Hu H, Kim KS, Choi YD, Kim S, Lee YH, Suh JS, Ahn JB, et al. Prognostic implications of PD-L1 expression in patients with soft tissue sarcoma. BMC Cancer. 2016; 16:434. https://doi.org/10.1186/s12885-016-2451-6.
15. Kim JR, Moon YJ, Kwon KS, Bae JS, Wagle S, Kim KM, Park HS, Lee H, Moon WS, Chung MJ, Kang MJ, Jang KY. Tumor infiltrating PD1-positive lymphocytes and the expression of PD-L1 predict poor prognosis of soft tissue sarcomas. PLoS One. 2013; 8:e82870. https://doi.org/10.1371/journal.pone.0082870.
16. Koirala P, Roth ME, Gill J, Piperdi S, Chinai JM, Geller DS, Hoang BH, Park A, Fremed MA, Zang X, Gorlick R. Immune infiltration and PD-L1 expression in the tumor microenvironment are prognostic in osteosarcoma. Sci Rep. 2016; 6:30093. https://doi.org/10.1038/srep30093.
17. Kostine M, Cleven AH, de Miranda NF, Italiano A, Cleton-Jansen AM, Bovee JV. Analysis of PD-L1, T-cell infiltrate and HLA expression in chondrosarcoma indicates potential for response to immunotherapy specifically in the dedifferentiated subtype. Mod Pathol. 2016; 29:1028–37. https://doi.org/10.1038/modpathol.2016.108.
18. Lussier DM, O’Neill L, Nieves LM, McAfee MS, Holechek SA, Collins AW, Dickman P, Jacobsen J, Hingorani P, Blattman JN. Enhanced T-cell immunity to osteosarcoma through antibody blockade of PD-1/PD-L1 interactions. J Immunother. 2015; 38:96–106. https://doi.org/10.1097/CJI.0000000000000065.
19. Palmerini E, Agostinelli C, Picci P, Pileri S, Lollini P, Scotlandi K, Benassi MS, Ferrari S. PD1 and PDL1 expression, tumoral microenvironment (TME) characterization and clinical implication in localized osteosarcoma. Ann Oncol. 2016; 27:1399PD. doi: 10.1093/annonc/mdw388.05z.
20. Paydas S, Bagir EK, Deveci MA, Gonlusen G. Clinical and prognostic significance of PD-1 and PD-L1 expression in sarcomas. Med Oncol. 2016; 33. https://doi.org/10.1007/s12032-016-0807-z.
21. Shen JK, Cote GM, Choy E, Yang P, Harmon D, Schwab J, Nielsen GP, Chebib I, Ferrone S, Wang X, Wang Y, Mankin H, Hornicek FJ, et al. Programmed cell death ligand 1 expression in osteosarcoma. Cancer immunology research. 2014; 2: 690–8. https://doi.org/10.1158/2326-6066.CIR-13-0224.
22. Sundara YT, Kostine M, Cleven AHG, Bovée JVMG, Schilham MW, Cleton-Jansen AM. Increased PD-L1 and T-cell infiltration in the presence of HLA class I expression in metastatic high-grade osteosarcoma: a rationale for T-cell-based immunotherapy. Cancer Immunol Immunother. 2017; 66:119–28. https://doi.org/10.1007/s00262-016-1925-3.
23. Abdel-Rahman O. PD-L1 expression and outcome of advanced melanoma patients treated with anti-PD-1/PD-L1 agents: a meta-analysis. Immunotherapy. 2016; 8:1081–9. https://doi.org/10.2217/imt-2016-0025.
24. Abdel-Rahman O. Correlation between PD-L1 expression and outcome of NSCLC patients treated with anti-PD-1/PD-L1 agents: A meta-analysis. Crit Rev Oncol Hematol. 2016; 101:75–85. https://doi.org/10.1016/j.critrevonc.2016.03.007.
25. Huang Y, Zhang SD, McCrudden C, Chan KW, Lin Y, Kwok HF. The prognostic significance of PD-L1 in bladder cancer. Oncol Rep. 2015; 33:3075–84. https://doi.org/10.3892/or.2015.3933.
26. Xu F, Xu L, Wang Q, An G, Feng G, Liu F. Clinicopathological and prognostic value of programmed death ligand-1 (PD-L1) in renal cell carcinoma: a meta-analysis. Int J Clin Exp Med. 2015; 8:14595–603.
27. Zhou C, Tang J, Sun H, Zheng X, Li Z, Sun T, Li J, Wang S, Zhou X, Sun H, Cheng Z, Zhang H, Ma H. PD-L1 expression as poor prognostic factor in patients with non-squamous non-small cell lung cancer. Oncotarget. 2017 Apr 11. doi: 10.18632/oncotarget.17022. [Epub ahead of print].
28. Thoma C. Prostate cancer: PD-L1 expression is common and indicates poor prognosis. Nat Rev Urol. 2016; 13:5. https://doi.org/10.1038/nrurol.2015.287.
29. Zhang L, Qiu M, Jin Y, Ji J, Li B, Wang X, Yan S, Xu R, Yang D. Programmed cell death ligand 1 (PD-L1) expression on gastric cancer and its relationship with clinicopathologic factors. Int J Clin Exp Pathol. 2015; 8:11084–91.
30. Thompson ED, Zahurak M, Murphy A, Cornish T, Cuka N, Abdelfatah E, Yang S, Duncan M, Ahuja N, Taube JM, Anders RA, Kelly RJ. Patterns of PD-L1 expression and CD8 T cell infiltration in gastric adenocarcinomas and associated immune stroma. Gut. 2017; 66:794–801. https://doi.org/10.1136/gutjnl-2015-310839.
31. Bertucci F, Finetti P, Perrot D, Leroux A, Collin F, Le Cesne A, Coindre JM, Blay JY, Birnbaum D, Mamessier E. PDL1 expression is a poor-prognosis factor in soft-tissue sarcomas. OncoImmunology. 2017; 6:e1278100. https://doi.org/10.1080/2162402X.2016.1278100.
32. Tierney JF, Stewart LA, Ghersi D, Burdett S, Sydes MR. Practical methods for incorporating summary time-to-event data into meta-analysis. Trials. 2007; 8:16. https://doi.org/10.1186/1745-6215-8-16.
33. Williams RF, Fernandez-Pineda I, Gosain A. Pediatric Sarcomas. Surg Clin North Am. 2016; 96:1107–25. https://doi.org/10.1016/j.suc.2016.05.012.