
INTRODUCTION
Neuroblastoma, an embryonal tumor of neuroectodermal origin, accounts for 11% of all cancer-related deaths in children [1]. Molecular aspects create the extreme heterogeneity of this disease, spanning spontaneous regression to rapid metastasizing progression [2, 3]. Treatment scenarios range between observation only and multimodal concepts including high-dose chemotherapy with autologous stem cell rescue, surgery, radiotherapy and immunotherapy [1, 4]. Despite decades of considerable international efforts to improve outcome, long-term survival of high-risk disease remains as low as 40% [2, 4]. Two major remaining obstacles are managing resistance to induction therapy, which causes progression and early death, and managing chemotherapy-resistant relapses due to minimal residual disease, which can occur years after initial diagnosis. MYCN amplifications [5, 6] and activating ALK mutations or amplifications [7–10] define, among other molecular aberrations, patient subgroups with highly aggressive and frequently therapy-resistant neuroblastomas. One of the first targeted treatment options to become available for chemoresistant neuroblastomas is targeting activating ALK mutations or amplifications by blocking ALK tyrosine kinase activity [11–15]. Therapies indirectly targeting MYCN are not yet under clinical investigation. Promising preclinical strategies include binding or enzymatic inhibition of epigenetically acting proteins such as the BRD4 bromodomain protein [16, 17], the EZH2 [18] or DNMT1 [19] methyltransferases or the histone deacetylases [20, 21], and disturbing mechanisms maintaining MYCN protein stability via the inhibition of aurora kinase A (AURKA) [22].
OMICS-based investigations of the primary biopsy specimen cannot currently predict which tumors will develop resistance to first-line therapy, meaning that physicians have no molecular rationale for switching from an ineffective first-line therapy to a potentially life-saving second-line therapy without losing precious time. The invasive nature of surgical biopsies deters their sequential application to monitor disease in patients with cancer. Single biopsies often fail to reflect cancer dynamics, intratumor heterogeneity and drug sensitivities likely to change during cancer evolution and treatment. Emerging data indicate that implementing molecular characterization of tumor surrogates such as cell-free nucleic acids [23–29], exosomes [30], metabolites [31], circulating and disseminated tumor cells [32, 33] isolated from blood, bone marrow und urine will improve molecular disease assessment for treatment selection, patient monitoring and outcome prediction for cancer patients. Liquid biopsies could capture the molecular landscape of all tumor clones, and provide a method to follow clonal evolution in tumor subpopulations and treatment response in real time.We aimed to establish MYCN and ALK droplet digital PCR for the routine assessment of copy number status from sequential neuroblastoma blood and bone marrow samples to assist risk stratification and detection of cancer progression via MYCN- or ALK-dependent tumor-promoting subpopulations.
RESULTS
Droplet digital PCR supports quantifiable MYCN copy number measurement in mixed total DNA lysates from neuroblastoma cells
Droplet digital PCR (ddPCR) is a highly sensitive recently developed technology to quantify specific gene regions using a limiting dilution concept (Figure 1) [34, 35]. We set out to evaluate ddPCR for use with patient blood plasma samples and determine its accuracy and sensitivity for detecting neuroblastoma-specific MYCN copy number variation in cell-free DNA (cfDNA). A 70-nucleotide synthetic template and a convenient primer-probe set were designed for ddPCR-based MYCN detection (Figure 2A). We serially diluted the template to produce 10, 100, 1000 and 10,000 copies per μl H2O (Figure 2B). MYCN copy number was analyzed in the dilution series using ddPCR. The copy number detected by ddPCR perfectly correlated (Pearson’s correlation coefficient r = 1.00) with the theoretically calculated number of MYCN copies per μl H2O (Figure 2C). These data demonstrate that ddPCR detection maintains linearity within the range of 10 to 10,000 copies per μl in the absence of background molecules. We next assessed ddPCR sensitivity in detecting MYCN amplification in a mixture of genomic DNA isolated from two neuroblastoma cell lines. This experimental design was planned to reflect the status of a heterogeneous tumor containing cell clones with and without a MYCN amplification. We titrated the number of cells from the Kelly cell line, which harbors a MYCN amplification, with the number of SK-N-AS cells, which lack MYCN amplification, to generate a titration series comprising two cellular backgrounds. We then extracted genomic DNA (gDNA), sheared it by sonication and measured MYCN copy number by ddPCR. We detected 406.67 MYCN copies in undiluted Kelly cells and 1.76 MYCN copies in SK-N-AS cells (Figure 3). The MYCN copy number determined by ddPCR strongly correlated (Spearman’s correlation coefficient r = 0.93, p = 0.0007) with the MYCN copy number calculated from the gDNA titration series using the mixed cell background. The full extent of MYCN amplification present in the Kelly cells could not be detected in the normal diploid background of SK-N-AS cells if the gDNA mixture was diluted between 1:100 and 1:400, however, a MYCN gain was detected at these dilutions (Figure 3). Dilution to 1:500 no longer detected a MYCN gain caused by the presence of amplified cells in the normal diploid background using our ddPCR protocol. Our data demonstrate that ddPCR detection maintains linearity within the range of 10 to 10,000 copies per μl in the absence of background molecules and that ddPCR can be reliably used to detect MYCN amplification in gDNA from as little as one Kelly cell in a background of nine cells lacking MYCN amplifications.
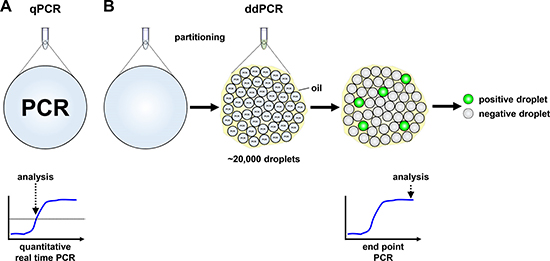
Figure 1: Schematic models of quantitative real-time and droplet digital PCR. (A) Signal detection in quantitative real-time PCR (qPCR) is provided in a single reaction, measured in real-time and analyzed from the exponential phase of the reaction. (B) Droplet digital PCR (ddPCR) reaction reagents are partitioned into ~20,000 droplets before PCR reactions proceed to the reaction plateau end point in individual droplets. Droplets are assessed as positive or negative from their fluorescent signal intensity.
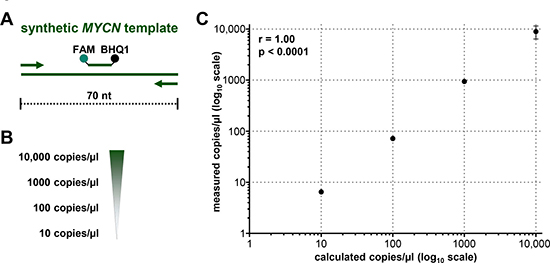
Figure 2: Droplet digital PCR maintains linearity over a broad copy number range. (A) Schematic representation of the 70-nucleotide double-stranded synthetic MYCN template covering the complete sequence of the MYCN amplicon. Primers (arrows), probe (green line) and the positions of the FAM fluorescent dye (green dot) and BHQ1 quencher (black dot) are indicated. (B) Theoretically calculated numbers of MYCN copies after serial dilution of the synthetic template in H2O are shown. (C) Correlation analysis of theoretically calculated MYCN copies (x-axis) and copies of synthetic template assessed in dilution series using ddPCR (y-axis, as mean ± SD; n ≥ 3). Pearson’s correlation coefficient (r) and p-value is indicated.
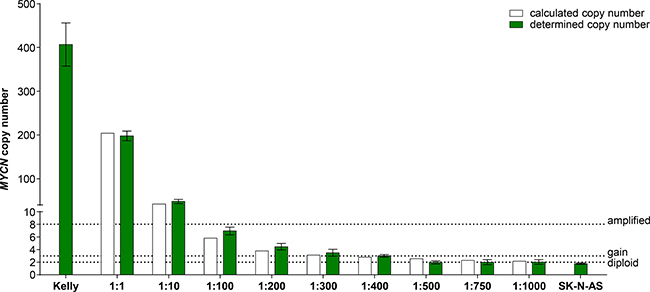
Figure 3: MYCN copy number detection in a titration series of mixed neuroblastoma cell lines either harboring or lacking MYCN amplification. Kelly cells (MYCN-amplified) were titrated with SK-N-AS cells (diploid MYCN) to generate the indicated titration series. Genomic DNA was extracted and fragmented by sonication before MYCN copy number was assessed in 2 ng gDNA using ddPCR (green bars, mean ± SD; n ≥ 3). The number of MYCN copies calculated to be present at each titration step are shown by the white bars. Dashed lines indicate the thresholds used for FISH analysis of the neuroblastoma biopsy in the German NB2004 trial protocol: diploid MYCN (2 copies), MYCN gain (≥ 3 copies) and MYCN amplification (> 8 copies). Target gene copy number was analyzed using QuantaSoft analysis software (version 1.7.4, Bio-Rad). This software determined the copy number by calculating the ratio of the target molecule concentration A (copies/μl) to the reference molecule concentration B (copies/μl) times the number of reference species copies NB in the human genome 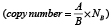 .
.
Droplet digital PCR yields exact MYCN and ALK copy numbers for 15 neuroblastoma cell lines
We selected 15 neuroblastoma cell lines previously reported to harbor MYCN and/or ALK amplifications, gains or the normal diploid chromosomal complements in the regions of MYCN and ALK as a panel in which to validate detection of gene amplification or gain by ddPCR. We included 1 medulloblastoma and 1 colon adenocarcinoma cell line, each reported to harbor a MYC amplification [36, 37], to test the specificity with which our ddPCR protocol detects MYCN. We extracted gDNA from this cell line panel, then sheared gDNA samples by sonication prior to ddPCR copy number detection. The German NB2004 trial protocol for FISH analysis of primary neuroblastoma samples designates MYCN amplification as the detection of > 8 MYCN copies, gain as detection of 3 to 8 copies and ‘single-copy’ as 2 copies. We designated MYCN and ALK amplification for our ddPCR analyses as the detection of ≥ 8.01 copies, gain as detection of 2.74 to 8.00 copies and normal diploid as detection of 1.50 to 2.73 copies. The thresholds for ddPCR were statistically determined from our cell line data set. MYCN copy number relative to NAGK copy number, as a normal diploid reference gene, was analyzed in gDNA isolated from cell lines and corresponding conditioned medium, using our established ddPCR protocol. We confirmed the amplified status of MYCN in BE(2)-C, TR14, Kelly, NB-1, LAN-5, SK-N-DZ, IMR-5 and IMR-32 reported in the literature. The MYCN copy numbers we determined (Figure 4, Table 1) from gDNA for BE(2)-C, Kelly, LAN-5 and IMR-32 were distinctly higher than the amplification levels reported in the literature using Southern blotting, FISH, competitive PCR, SNP oligonucleotide arrays or other methods (reported ranges summarized in Table 1). We determined 276.2 ± 27.7 MYCN copies in gDNA from the NB-1 cell line (Figure 4, Table 1) to ascertain its amplified status, which was unclear from previous FISH assessments reporting 2 or 20 MYCN copies (Table 1). We confirmed a MYCN gain in the SH-SY5Y cell line that was unclear from the literature (2 or 3 copies, Table 1) using ddPCR analysis of gDNA (Figure 4, Table 1). MYCN copy numbers determined using ddPCR in gDNA (Figure 4, Table 1) confirmed the gain in LAN-6 and normal diploid status in the SK-N-AS, SH-EP, SK-N-FI, NBL-S and CLB-GA neuroblastoma cell lines, which are reported in the literature (Table 1). We measured 1.85 ± 0.11 MYCN copies in gDNA from the HD-MB03 medulloblastoma cell line and 1.67 ± 0.17 MYCN copies in gDNA from the COLO-320 colon adenocarcinoma cell line (Figure 4, Table 1), confirming the specificity of our ddPCR assay for MYCN. In conclusion, we confirmed the MYCN copy number status reported for most neuroblastoma cell lines examined in our panel, and provide evidence for a MYCN gain in the SH-SY5Y cell line and a strong MYCN amplification in the NB-1 cell line.
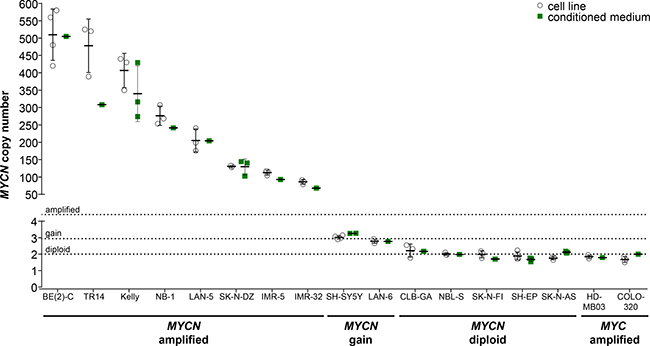
Figure 4: Comparison of absolute MYCN copy numbers determined by ddPCR for neuroblastoma cell lines. Genomic DNA was extracted from cultured cells and fragmented by sonication before ddPCR for MYCN copy number (white circles, mean indicated by the line and SD indicated by the whiskers; n ≥ 3). Cell-free DNA was purified from medium conditioned by the cell lines, and MYCN copy number was determined by ddPCR (green squares, mean indicated by the line and SD indicated by the whiskers; n ≥ 1). The MYC-amplified HD-MB03 medulloblastoma [36] and COLO-320 colorectal carcinoma [5] cell lines were used as controls. Dashed lines indicate the thresholds used for FISH analysis of the neuroblastoma biopsy in the German NB2004 trial protocol: diploid MYCN (2 copies), MYCN gain (≥ 3 copies) and MYCN amplification (> 8 copies).
Table 1: MYCN and ALK copy numbers determined by ddPCR for established cell lines from cellular genomic DNA and conditioned medium-derived cell-free DNA
MYCN copy numbera |
ALK copy numbera |
|||||
|---|---|---|---|---|---|---|
Cell line |
genomic DNA |
cell-free DNA |
genomic DNA in literatureb |
genomic DNA |
cell-free DNA |
genomic DNA in literatureb |
BE(2)-C |
510.0 ± 73.9 |
505.0 |
4.28 ± 0.06 |
4.25 |
2 [77] |
|
TR14 |
478.0 ± 77.1 |
308.0 |
120 [41] |
1.93 ± 0.05 |
2.49 |
|
Kelly |
406.7 ± 49.3 |
339.8 ± 80.4 |
3.05 ± 0.30 |
3.22 ± 0.17 |
||
NB-1 |
276.2 ± 27.7 |
241.5 |
44.3 ± 2.4 |
56.7 |
||
LAN-5 |
204.8 ± 33.0 |
204.0 |
2.06 ± 0.07 |
2.26 |
||
SK-N-DZ |
130.2 ± 2.0 |
129.0 ± 22.6 |
10c [67] |
2.09 ± 0.09 |
2.25 ± 0.16 |
2 [7] |
IMR-5 |
112.3 ± 6.8 |
93.0 |
ampl. [68] |
132.8 ± 3.3 |
139.0 |
ampl. [7] |
IMR-32 |
86.0 ± 6.4 |
68.0 |
102.8 ± 4.3 |
87.5 |
||
SH-SY5Y |
3.02 ± 0.11 |
3.27 ± 0.01 |
3.04 ± 0.06 |
2.74 ± 0.08 |
||
LAN-6 |
2.79 ± 0.13 |
2.77 |
3 [73] |
3.01 ± 0.14 |
3.40 |
2 [57] |
CLB-GA |
2.21 ± 0.40 |
2.17 |
2 [74] |
2.24 ± 0.12 |
2.09 |
|
NBL-S |
2.01 ± 0.08 |
1.98 |
2 [75] |
2.07 ± 0.09 |
2.20 |
2 [57] |
SK-N-FI |
1.99 ± 0.22 |
1.70 |
2 [75] |
2.15 ± 0.16 |
1.57 |
|
SH-EP |
1.89 ± 0.24 |
1.67 ± 0.12 |
2 [39] |
1.97 ± 0.17 |
1.87 ± 0.18 |
2 [57] |
SK-N-AS |
1.76 ± 0.11 |
2.12 ± 0.05 |
2 [39] |
1.92 ± 0.06 |
1.81 ± 0.05 |
|
HD-MB03d |
1.85 ± 0.11 |
1.79 |
2 [36] |
- |
- |
- |
COLO-320d |
1.67 ± 0.17 |
2.00 |
2 [5] |
- |
- |
- |
acopy numbers as mean ± SD (genomic DNA, n ≥ 3 and cell-free DNA, n ≥ 1)
bFor comparison, the MYCN and ALK values reported in the literature were included.
camplification (fold)
dcontrol cell lines lacking MYCN amplification and harboring MYC amplifications
We analyzed ALK copy numbers relative to NAGK copy numbers using ddPCR of gDNA from our neuroblastoma cell line panel. We confirmed ALK amplifications in the IMR-32, NB-1 and IMR-5 neuroblastoma cell lines, which were previously reported in the literature (Figure 5, Table 1). Droplet digital PCR detected 102.8 ± 4.3 ALK copies in the IMR-32 cell line to confirm a high-level amplification, where multiplex ligation-dependent probe amplification had previously detected normal diploid status and analysis by SNP array or arrayCGH detected an amplification or partial amplification of unspecified copy number, respectively (Table 1). The ALK copy number determined using our protocol (Figure 5, Table 1) for NB-1 corresponded well to the amplification level assessed by Southern blotting (30– 40 copies) reported in the literature (Table 1). The level of ALK amplification has not been previously quantified for IMR-5 (Table 1), which we show harbors 132.8 ± 3.3 ALK copies (Figure 5, Table 1). ALK gains were detected in the BE(2)-C, Kelly, LAN-6 and SH-SY5Y cell lines using our ddPCR protocol (Figure 5, Table 1). Our data specifically confirm the ALK gain in SH-SY5Y that was unclear from the literature (2 or 3 copies, Table 1). In contrast, our ddPCR data contradicted previous reports of normal diploid ALK in the BE(2)-C, Kelly and LAN-6 cell lines (Table 1). We confirmed normal diploid status of ALK in the TR14 cell line (Figure 5, Table 1), which was unclear from previous studies reporting either amplified or normal diploid ALK status (Table 1). We also confirmed normal diploid ALK status (Figure 5, Table 1) in the SK-N-AS, SH-EP, LAN-5, NBL-S, SK-N-DZ, SK-N-FI and CLB-GA cell lines, which was previously reported (Table 1). We provide exact ALK copy number data for our neuroblastoma cell line panel that adds to previous reports classifying them only as diploid or amplified, and confirmed the reported ALK status with 6 exceptions. We provide evidence for the diploid status of ALK in the TR14 cell line, ALK gains in the BE(2)-C, Kelly, SH-SY5Y and LAN-6 cell lines and a strong ALK amplification in the IMR-32 cell line.
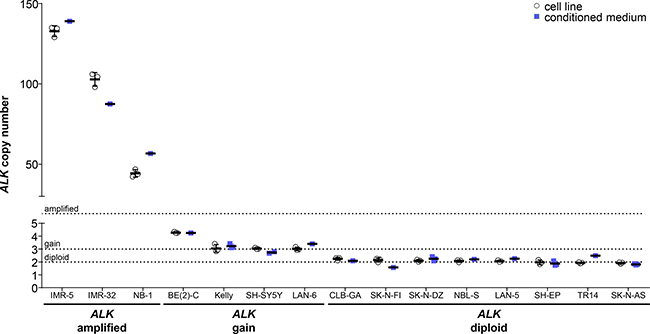
Figure 5: Comparison of absolute ALK copy numbers determined by ddPCR for neuroblastoma cell lines. Genomic DNA was extracted from cultured cells and fragmented by sonication before ALK copy number was determined by ddPCR (white circles, mean indicated by the line and SD indicated by the whiskers; n = 3). Cell-free DNA was purified from medium conditioned by the cell lines, and copy numbers were detected by ddPCR (blue squares, mean indicated by the line and SD indicated by the whiskers; n ≥ 1). Dashed lines indicate thresholds for diploid (2 copies), gain (≥ 3 copies) and amplified (> 8 copies) status.
MYCN and ALK copy number can be reliably determined from conditioned medium
As an initial step towards copy number detection in acelluar biosamples such as blood plasma, we analyzed MYCN and ALK amplification status from cfDNA in medium conditioned by neuroblastoma, medulloblastoma and colon adenocarcinoma cell lines. The copy numbers detected using cfDNA in our ddPCR protocol were compared with copy numbers determined from cellular gDNA. We purified cfDNA from medium conditioned by our cell line panel. The MYCN amplifications we detected using ddPCR of gDNA in 8 neuroblastoma cell lines ranged from the 86.0 ± 6.4 MYCN copies measured in IMR-32 cells to the 510.0 ± 73.9 MYCN copies measured in BE(2)-C cells (Figure 4, Table 1), and all 8 amplifications could also be deduced from cfDNA. MYCN amplifications at the levels of 68 MYCN copies for IMR-32 and 505 MYCN copies for BE(2)-C were ascertained from cfDNA, which corresponded well with copy numbers determined from gDNA (Figure 4, Table 1). Absolute MYCN copy numbers determined from cfDNA and gDNA were identical for LAN-5 and SK-N-DZ. Absolute MYCN copy numbers determined for the TR14 cell line from cfDNA varied most strongly, with 308 copies detected in cfDNA and 478.0 ± 77.1 copies determined from cellular gDNA (Figure 4, Table 1). Our ddPCR assessment of cfDNA from the SH-SY5Y cell line also confirmed the MYCN gain detected in gDNA (Figure 4, Table 1). Likewise, the MYCN gain detected in the LAN-6 cell line was detectedin cfDNA (Figure 4, Table 1). The MYCN normal diploid status detected using gDNA was confirmed using cfDNA for the neuroblastoma cell lines, CLB-GA and SK-N-AS, as well as the MYC-amplified medulloblastoma and colon adenocarcinoma cell lines used as controls for MYCN assay specificity (Figure 4, Table 1). The MYCN copy numbers we measured in conditioned medium-derived cfDNA significantly correlated (Spearman’s correlation coefficient r = 0.9314) with the copy numbers detected in corresponding cellular gDNA for all 17 cell lines assessed (Figure 6A). Taken together, our data show that our ddPCR protocol can clearly distinguish between MYCN amplification, gain and normal diploid status in cell lines using medium-derived cfDNA.
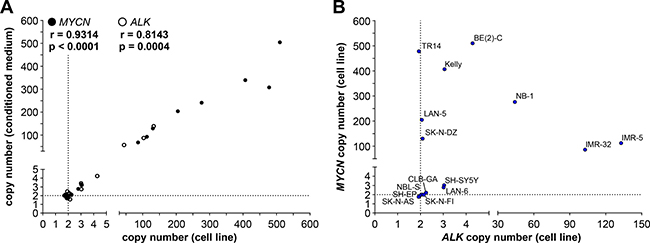
Figure 6: MYCN and ALK copy numbers determined by ddPCR of genomic DNA correlate with copy numbers determined from the corresponding cell-free DNA. (A) Copy numbers determined by ddPCR from genomic DNA from each cell line is plotted on the x-axis and copy numbers determined by ddPCR from the corresponding cell-free DNA isolated from conditioned medium is plotted on the y-axis. Values presented in Figures 4 and 5 were used. Significance of the correlation between the 2 DNA sources for determining MYCN (black circles) and ALK (white circles) copy numbers was assessed from the plot, and the Spearman correlation coefficient (r) and p-value are indicated. Dashed lines indicate the position of diploid gene status. (B) Plotting MYCN copy numbers against corresponding ALK copy numbers divided neuroblastoma cell lines into different groups based on combined copy number status. MYCN copy numbers determined by ddPCR from genomic DNA from the indicated cell lines are plotted along the y-axis against ALK copy numbers determined by ddPCR from genomic DNA from the same cell lines (x-axis). Same values as those plotted in A are used. Dashed lines indicate the position of diploid gene status.
We further validated copy number detection by ddPCR of cfDNA using our assay for ALK copy number in our neuroblastoma cell line panel. ALK copy numbers determined using cfDNA from the IMR-5, IMR-32 and NB-1 cell lines were close to the values determined from gDNA (Figure 5, Table 1), and showed that high-level ALK amplifications could also be detected using cfDNA. ALK copy numbers determined from cfDNA confirmed the ALK gains we detected in gDNA. Absolute ALK copy numbers determined from cfDNA from the BE(2)-C, Kelly, SH-SY5Y and LAN-6 cell lines corresponded well to those determined from gDNA (Figure 5, Table 1). ALK diploid status was also confirmed in all neuroblastoma cell lines using cfDNA. Absolute ALK copy numbers determined using cfDNA from the CLB-GA, SK-N-DZ, SH-EP and SK-N-AS cell lines corresponded well to those determined from gDNA (Figure 5, Table 1). ALK copy number determined for the TR14 cell line from cfDNA was slightly higher than the 1.93 ± 0.05 ALK copies determined from gDNA, but is still designated as normal diploid according to our ddPCR thresholds (Figure 5, Table 1). ALK copy numbers detected using cfDNA also significantly correlated (Spearman’s correlation coefficient r = 0.8143) with copy numbers measured in corresponding gDNA from all 15 neuroblastoma cell lines assessed (Figure 6A). These results further validate the accurate detection of gene copy number using cfDNA derived from conditioned medium for assessment of ALK amplification, gain and diploid status.
Because MYCN (2p24.3) and ALK (2p23.2-2p23.1) are both located on chromosome 2p, we assessed the extent of correlation between MYCN and ALK copy numbers. Plotting the MYCN copy numbers against corresponding ALK copy numbers divided our 15-cell line panel into 6 groups based on combined MYCN and ALK status (Figure 6B). One group contains neuroblastoma cell lines with normal diploid status of both genes (SK-N-AS, SH-EP, NBL-S, SK-N-FI and CLB-GA). The LAN-6 and SH-SY5Y cell lines belong to a second group harboring gains in both MYCN and ALK, indicating a larger region containing both genes may have been gained during a single event. MYCN-amplified cell lines were distributed within different groups according to their ALK status. The SK-N-DZ, LAN-5 and TR14 cell lines maintained their ALK diploid status in combination with MYCN amplification. The Kelly and BE(2)-C cell lines acquired ALK gains in addition to MYCN amplification, indicating separate events driving MYCN and ALK aberrations in these cell lines. The IMR-32 and IMR-5 cell lines harbor approximately equal ALK and MYCN copy numbers, and the NB-1 cell line harbors many more MYCN than ALK copies (Figure 6B, Table 1) indicating a single-event and multi-event mechanism creating the copy number landscape for MYCN and ALK in these 2 groups, respectively. Interestingly, no cell line harbored an ALK gain or amplification without a MYCN gain or amplification. Our ddPCR data from cell lines provide mechanistic insights into gain or amplification of regions on chromosome 2p in neuroblastoma.
Plasma collected from mice harboring xenografts and from patients reflects tumor MYCN and ALK copy number status
To initially test ddPCR detection capabilities in context with blood plasma, we compared MYCN and ALK copy numbers in xenograft tumors growing subcutaneously in mice with those measured in cfDNA isolated from mouse blood plasma, thereby avoiding the dilution effect potentially arising from damaged human white blood cells. Neuroblastoma cells were subcutaneously injected into both flanks of 3 NMRI-Foxn1nu mice for the analysis of MYCN and ALK, and the mouse cohorts monitored until the largest xenograft tumor reached a tumor volume of 1500 mm³ at day 40 (Figure 7A). Xenografts were established from a neuroblastoma cell line, named OHC-NB1 and established by our group (unpublished data), that harbors a high-level MYCN amplification and normal diploid ALK. As the positive control for tumor copy number, gDNA was extracted from each xenograft tumor and sonicated for ddPCR. Total blood plasma was collected from 3 mice by orbita puncture and pooled for cfDNA isolation. MYCN and ALK copy numbers were assessed in the cfDNA isolated from the plasma pooled using ddPCR. Our ddPCR protocol detected 139.75 MYCN copies in plasma-derived cfDNA, which was similar to the copy number (177.50 ± 19.81) determined from xenograft tumor gDNA (Figure 7B). ALK copy number was also assessed in both plasma-derived cfDNA and tumor gDNA using ddPCR. We detected 2.00 ALK copies using plasma-derived cfDNA, which was within the error range of the ALK copy number (2.06 ± 0.02) detected in the tumor gDNA. Our ddPCR protocol accurately detected the ALK normal diploid status and amplified MYCN status of the xenograft tumor from mouse blood plasma. These data demonstrate that cfDNA is released by subcutaneously grown human tumor cells into the mouse bloodstream in sufficient quantity to calculate tumor cell gene copy number from blood plasma, and confirm proof-of-principle for using our ddPCR protocol to detect ALK and MYCN copy numbers from patient blood plasma samples.
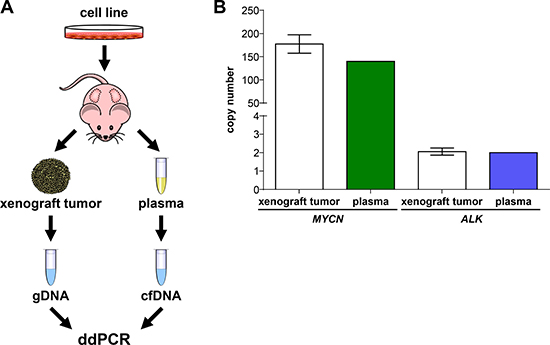
Figure 7: MYCN and ALK copy numbers assessed in cell-free DNA from plasma reflect copy numbers determined from xenograft tumor genomic DNA. (A) Schematic workflow summarizing xenografting of the OHC-NB1 neuroblastoma cell line and sample preparation from genomic DNA (gDNA) and cell-free DNA (cfDNA) for droplet digital PCR (ddPCR). OHC-NB1 cells were subcutaneously injected into both flanks of 3 NMRI-Foxn1nu mice for gene copy number determination. Genomic DNA was extracted from each xenograft tumor and fragmented by sonication prior to ddPCR. Total blood plasma from the 3 mice was pooled for cfDNA isolation. (B) White bars show MYCN and ALK copy numbers detected by ddPCR using xenograft tumor genomic DNA (mean ± SD; n = 6) as the reference base. MYCN (green bar) and ALK (blue bar) copy numbers detected by ddPCR of cell-free DNA isolated from pooled mouse plasma (n = 1) are shown.
We next evaluated ddPCR-based MYCN and ALK copy number assessment in blood plasma samples retrospectively collected at diagnosis from 10 neuroblastoma patients with known MYCN status. For comparison MYCN and ALK copy number assessment was performed in blood plasma samples collected from 16 healthy individuals. The German Neuroblastoma Biobank (Cologne) provided blood plasma samples paired with genomic DNA from the corresponding primary tumor from patients treated within the German NB2004 trial. Fragmentation of tumor gDNA was achieved by direct enzymatic digestion in the ddPCR reaction mixture due to the low DNA concentration in the 20 μl samples provided in water, and cfDNA was purified from the plasma samples before ddPCR. MYCN and ALK copy numbers were analyzed using our ddPCR protocol in the matched gDNA and cfDNA patient samples as well as in the cfDNA samples from healthy individuals. MYCN copy number in cfDNA samples from healthy individuals ranged between 1.54 to 2.60, and ALK copy number was between 1.64 and 2.50 (Table 3), indicating in line with the thresholds set a normal diploid status in all samples analyzed. FISH analysis conducted on the primary tumor for staging at diagnosis was used as the reference for MYCN status. We measured MYCN copy numbers in the range of 1.70 to 2.16 in tumor gDNA from patients 1–5 using ddPCR, which were in complete accordance with the diploid MYCN status determined by FISH (Figure 8A, Table 2). MYCN copy numbers ranging from 73.5 to 267.0 were detected using ddPCR of tumor gDNA from patients 6–10 (Figure 8A, Table 2), who were diagnosed with MYCN-amplified neuroblastomas according to FISH. MYCN copy numbers detected by ddPCR were higher than the amplification levels determined by FISH for each tumor. Copy numbers determined by ddPCR discriminated between a range of 73.5 to 129.0 for the 20- to 30-fold MYCN amplification levels determined by FISH and a range of 207.5 to 267.0 for the 50-fold MYCN amplification levels. MYCN copy numbers detected using plasma-derived cfDNA significantly correlated (Spearman’s correlation coefficient r = 0.8182) with the copy numbers measured in tumor gDNA (Figure 8C). We measured slightly higher MYCN copy numbers using plasma-derived cfDNA than the corresponding tumor gDNA for patients 2, 3 and 5 (Figure 8A, Table 2). MYCN copy numbers determined using plasma-derived cfDNA were distinctly higher than those determined from corresponding tumor gDNA for patients 1 and 4, respectively (Figure 8A, Table 2). MYCN copy numbers from plasma-derived cfDNA were consistently lower than the corresponding tumor gDNA from patients 6–10 with MYCN-amplified tumors (Table 2). ALK copy numbers determined using either plasma-derived cfDNA or tumor gDNA revealed normal diploid status in the samples from patients 1–4, 6 and 10 (Figure 8B, Table 2). Tumor gDNA from patients 5, 7 and 8 also revealed ALK diploid status, however, corresponding plasma-derived cfDNA indicated an ALK gain in these patients (Figure 8B, Table 2). An ALK gain of 3.40 and 3.07 copies was detected using tumor gDNA and plasma-derived cfDNA, respectively, from patient 9 (Figure 8B, Table 2). ALK gains were detected using plasma-derived cfDNA from 3 of 5 patients with MYCN-amplified tumors (patients 7, 8 and 9), but a possible ALK gain in a tumor with diploid MYCN status was only detected in patient 5 (Table 2). ALK copy numbers assessed using ddPCR of tumor gDNA from patients 2, 3, 5 and 6 were in complete accordance with the diploid ALK status determined by FISH or qPCR (Table 2). The copy numbers determined from plasma-derived cfDNA also confirmed the diploid ALK status in patients 2, 3 and 6, whereas plasma-derived cfDNA indicated an ALK gain in patient 5 (Figure 8B, Table 2). ALK copy numbers detected in plasma-derived cfDNA did not correlate (Spearman’s correlation coefficient r = 0.2553) with the copy number determined using tumor gDNA (Figure 8D). This is likely because of the narrow range of copy number (very near to 2 in most cases) values obtained for a small number of patients. These data indicate that our ddPCR protocol accurately assessed ALK copy numbers using plasma-derived cfDNA and tumor gDNA. Our ddPCR protocol enabled the detection of slight ALK copy number differences between cfDNA and gDNA. Our results for this 10-patient pilot cohort utilizing only archived tumor and blood plasma samples demonstrate that ddPCR analysis of either tumor gDNA or plasma-derived cfDNA accurately distinguished between MYCN-amplified and normal diploid status determined by FISH. Our ddPCR protocol required only 2 ng of tumor DNA, and assessed MYCN copy number more precisely than FISH over a wide copy number range. Plasma-derived cfDNA also produced MYCN copy numbers that correlated well with those determined from tumor gDNA.
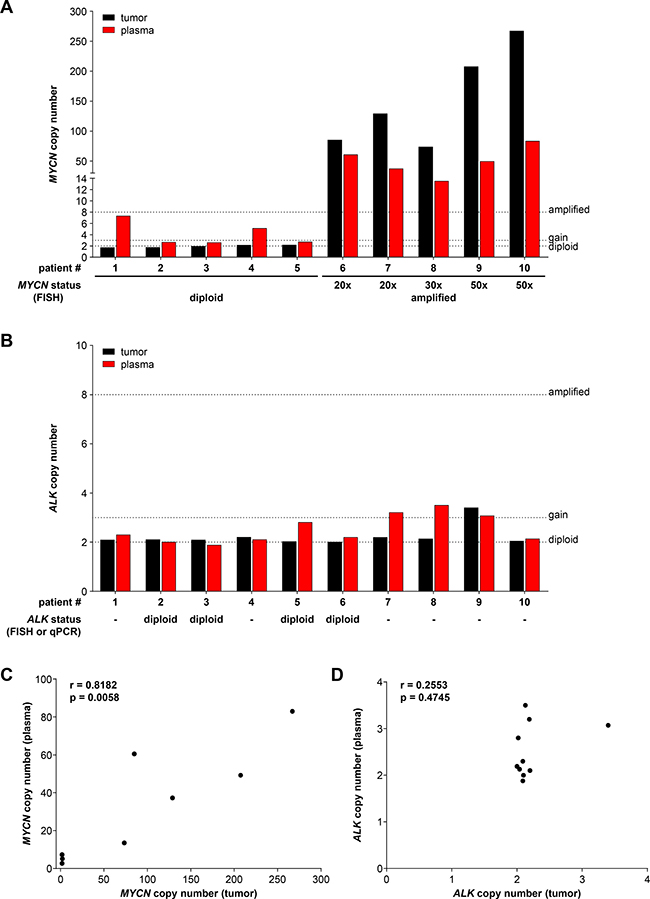
Figure 8: Droplet digital PCR accurately assesses MYCN and ALK copy numbers from neuroblastoma patient plasma and the corresponding primary tumor biopsy. MYCN (A) and ALK (B) copy numbers were determined by ddPCR from retrospectively collected biomaterial samples from 10 neuroblastoma patients. Black bars show numbers determined from genomic DNA isolated from the tumor biopsy (single measurements). Red bars show values determined from cell-free DNA in the corresponding 200 μl plasma sample (single measurements). MYCN and ALK status determined at diagnosis (shown below bar graphs in A and B) were provided from patient records and were determined by FISH or qPCR (indicated) analysis. Dashed lines indicate the thresholds used for FISH analysis of the neuroblastoma biopsy in the German NB2004 trial protocol: diploid MYCN (2 copies), MYCN gain (≥ 3 copies) and MYCN amplification (> 8 copies). Correlation analysis of copy numbers determined from plasma-derived cell-free DNA (y-axis) and tumor biopsy genomic DNA (x-axis) is shown for MYCN (C) and ALK (D). Spearman correlation coefficients (r) and p-values are indicated.
Table 2: MYCN and ALK copy numbers determined by ddPCR from neuroblastoma patient blood plasma samples and paired genomic DNA from the corresponding primary tumor biopsy
MYCN copy number |
ALK copy number |
|||||
|---|---|---|---|---|---|---|
Patient |
genomic DNA (tumor biopsy) |
cell-free DNA (plasma) |
reference valuea (tumor biopsy) |
genomic DNA (tumor biopsy) |
cell-free DNA (plasma) |
reference valueb (tumor biopsy) |
1 |
1.70 |
7.30 |
diploid |
2.09 |
2.30 |
- |
2 |
1.73 |
2.65 |
diploid |
2.10 |
2.00 |
diploid |
3 |
1.93 |
2.60 |
diploid |
2.09 |
1.88 |
diploid |
4 |
2.14 |
5.10 |
diploid |
2.20 |
2.10 |
- |
5 |
2.16 |
2.70 |
diploid |
2.02 |
2.80 |
diploid |
6 |
85.0 |
60.5 |
20x amplified |
2.00 |
2.19 |
diploid |
7 |
129.0 |
37.2 |
20x amplified |
2.19 |
3.20 |
- |
8 |
73.5 |
13.5 |
30x amplified |
2.13 |
3.50 |
- |
9 |
207.5 |
49.2 |
50x amplified |
3.40 |
3.07 |
- |
10 |
267.0 |
83.0 |
50x amplified |
2.04 |
2.13 |
- |
aFISH
bFISH or qPCR
Table 3: MYCN and ALK copy numbers determined by ddPCR in blood plasma samples from 16 healthy individuals
MYCN copy number |
ALK copy number |
|
|---|---|---|
Healthy individual |
cell-free DNA (plasma) |
cell-free DNA (plasma) |
1 |
1.73 |
1.93 |
2 |
2.40 |
1.72 |
3 |
1.79 |
2.10 |
4 |
1.72 |
2.16 |
5 |
1.59 |
2.17 |
6 |
1.90 |
2.10 |
7 |
1.77 |
1.84 |
8 |
2.23 |
1.97 |
9 |
1.80 |
2.22 |
10 |
2.60 |
2.40 |
11 |
1.90 |
2.00 |
12 |
1.54 |
1.72 |
13 |
1.70 |
2.50 |
14 |
2.00 |
1.74 |
15 |
1.70 |
1.70 |
16 |
2.06 |
1.64 |
DISCUSSION
Here, we present ddPCR as an accurate method to assess MYCN and ALK copy numbers in tumor-derived cfDNA from blood plasma from neuroblastoma patients. The ddPCR method is highly sensitive and linear over a wide copy number range, and accurately discriminates between amplified, gain and normal diploid status. We validated our protocols in a panel of 15 neuroblastoma cell lines and 2 MYC-amplified non-neuroblastoma cell lines to control for assay specificity, and reveal evidence for different MYCN or ALK status than previously reported for 7 cell lines commonly used in research. Our ddPCR protocol yields absolute gene counts, making it easier to discriminate between gains and diploid status. We also validated our protocol in the mouse xenograft model, and demonstrate that MYCN and ALK copy numbers could be accurately determined from cfDNA in human blood plasma.
Gene copy number assessment using ddPCR is calculated through detection of the absolute concentration of target sequences and the diploid reference gene [34]. Droplet digital PCR has been used to assess gene copy numbers for cell lines and was compared to other methods used in published reports. MET copy number has been assessed in gDNA from gastric cancer and hepatocellular carcinoma cell lines and formalin-fixed, paraffin-embedded tumor samples from patient-derived xenograft models using ddPCR and SNP array or FISH [43]. The authors detected a significant correlation of copy numbers assessed using ddPCR and SNP arrays in cell lines or FISH in tumor samples. Belgrader and colleagues analyzed HER2 copy numbers in gDNA from archived formalin-fixed, paraffin-embedded breast carcinoma samples using ddPCR or FISH [44]. They confirmed complete concordance of ddPCR and FISH for correct assessment of HER2 amplifications. We demonstrated that ddPCR detection maintains linearity within a range of 10 to 10,000 copies per μl in dilution series using a synthetic MYCN template. These data confirm previous reports of ddPCR linearity within a range of 1 to ~20,000 copies measuring HER2 and reference gene CEP17 in a dilution series of gDNA from the SK-BR-3 breast cancer cell line in H2O [45]. The concentration range of 10 to 10,000 copies per μl covered the absolute concentrations of each target sequence assessed for MYCN, ALK and NAGK in our cell line panel analyses, indicating the reliability of the copy number calculations.
We assessed or re-assessed MYCN and ALK copy numbers in gDNA from a panel of 15 cell lines commonly used in neuroblastoma research during the development and validation of our ddPCR protocol. We provide exact ALK copy numbers for our neuroblastoma cell line panel and our protocol confirmed the amplified, gain or diploid status in most cell lines. While our protocol confirmed the amplified, gain or diploid status of MYCN in most of the cell lines, absolute copy numbers determined by ddPCR were higher than reported values determined by different methods. Published estimates of MYCN amplification also varied in reports using the same or different methods. We determined 406.7 MYCN copies in gDNA from the Kelly cell line. A range of 100 – 120 MYCN copies were reported for the Kelly cell line using Southern blotting [38], while using competitive PCR detected 240 MYCN copies [39]. The IMR-32 cell line was reported to harbor a 15-25-fold MYCN amplification using Southern blotting [38], 25–75 MYCN copies using Southern blotting [40] or 50 MYCN copies using a SNP oligonucleotide array [41]. We assessed 86.0 MYCN copies in IMR-32 using ddPCR. The NB-1 cell line was reported as diploid for MYCN [8] or as MYCN-amplified with 20 copies estimated by FISH [42]. We confirmed MYCN amplification in the NB-1 cell line, which we show harbors 276.2 MYCN copies. The absolute quantitation of the NAGK reference gene provides the normal input DNA level and functioned as a control in our analyses. We avoided continuous culture of cell lines to reduce the risk of genomic alterations during maintenance, and think it is unlikely that the higher copy numbers are produced by additional chromosomal alterations acquired during culture. These data indicate that ddPCR can be reliably used as an accurate tool to assess copy number over a broad range as shown by our reported values for MYCN and ALK in 15 established neuroblastoma cell lines.
Single tumor biopsies do not adequately reflect clonal heterogeneity within the primary tumor (intratumoral heterogeneity), heterogeneity between different tumors or metastases in the same patient or changes in the tumor or metastases occurring during the course of treatment or progression. Spatial and temporal heterogeneity have been described for several cancer entities, including colorectal cancer [46], breast cancer [47], glioblastoma [48] and neuroblastoma [49–51]. We assessed MYCN and ALK copy numbers from archived single tumor biopsies from the 10-patient pilot cohort in this study as the control measure for copy number detection using the paired plasma samples. For some patients, tumor gDNA and plasma-derived cfDNA yielded different gene copy numbers. Copy numbers assessed using cfDNA indicated a gain for MYCN in 2 patients (1 and 4) and for ALK in 3 patients (5, 7 and 8), whereas corresponding tumor gDNA revealed normal diploid status. The higher copy numbers detected in tumor-derived circulating cfDNA may indicate more aggressive tumor clones either in the primary tumor or at metastatic sites that were not sampled by the single primary tumor biopsy. Large-scale longitudinal studies monitoring MYCN and ALK copy number status in cfDNA from individual patients and comparing these findings with the in-depth analysis of all tumor specimens collected from the respective patients are required to ultimately define the potential of cfDNA analysis in context with the identification and characterization of tumor heterogeneity in metastatic neuroblastoma disease. In all patients with a MYCN-amplified neuroblastoma, MYCN copy numbers determined using cfDNA were lower than those determined from tumor gDNA. The lower copy numbers detected in tumor-derived circulating cfDNA could be due to the dilution effect by damaged white blood cells generated through the suboptimal pre-analytic handling of the respective blood samples, which were as stated elsewhere originally not collected for cfDNA studies. Alternatively, this finding could reflect clonal tumor heterogeneity in the primary tumor, and be an average of the biopsied amplified clonal region and other non-amplified regions. Again, large-scale trials monitoring disease status by optimally collecting and analyzing blood and tumor tissue samples are needed to ultimately answer this question. The potential for detection of tumor heterogeneity using cfDNA has been suggested in several reports. Chicard and colleagues compared tumor genome copy number profiling of cfDNA using the OncoScan array and array CGH analysis of the primary neuroblastoma biopsy [51]. They identified TERT alterations, which are associated with aggressive high-risk neuroblastoma [52, 53], only in tumor-derived cfDNA (not tumor biopsy) from 2 patients. The authors hypothesized that cfDNA might reflect genetic alterations of more aggressive cell clones [51]. Our detection of MYCN gains in patients 1 and 4, and ALK gains in patients 5, 7 and 8 in plasma compared to the primary tumor biopsy also indicated these patients have subclonal amplifications in the primary tumor, which were not at the site of biopsy or present in distant undetected metastases. Sequence analysis of plasma-derived cfDNA detected all mutations detected in the primary tumor and/or its synchronous liver metastasis in a massive parallel sequencing study of samples from a patient with breast carcinoma [54]. Similarly, Chan and colleagues detected a composite pattern of specific copy number aberrations and mutations in plasma-derived cfDNA from a patient that corresponded to the breast carcinoma and 2 ovarian tumors synchronously present using massive parallel sequencing [55]. These data, although incidental, strongly support that differing copy numbers in cfDNA and tumor gDNA indicate the presence of tumor cell populations in the patient that are not captured by the single primary tumor biopsy. We conclude that this interpretation applies without restriction for the MYCN gains detected in plasma from patients 1 and 4, and the ALK gains detected in plasma from patients 5, 7 and 8 in our cohort. Even though our pilot cohort only includes 10 patients, it is astounding to speculate that single primary tumor biopsies may be underestimating the real tumor cell population in half of high-risk neuroblasoma patients.
Since retrospectively collected patient samples were analyzed in this study, blood was not sampled according to a standardized protocol for cfDNA detection. Blood samples may have spent longer than a day at room temperature before plasma preparation and storage at -80°C. Lysis of white blood cells before cfDNA preparation can dilute the tumor-derived DNA with normal cellular DNA. This dilution effect was previously demonstrated by titrating serum samples with increasing numbers of white blood cells, which masked high MYCN/NAGK ratios and prevented detection of MYCN amplification above a threshold [24]. We also simulated a dilution effect by titrating MYCN-amplified Kelly cells with SK-N-AS cells harboring the normal diploid MYCN complement, and showed that detection of the MYCN amplification was masked above a threshold of dilution with 99 normal diploid cells. This effect depends on both amplification level and degree of dilution. Visible hemolysis had occurred in plasma samples from 4 neuroblastoma patients (2, 6, 8 and 10), indicating that white blood cells may have also lysed in these samples. The lower copy numbers detected in plasma samples from patients with MYCN-amplified tumors could have resulted from dilution with gDNA from lysed normal blood cells. Although, we did not detect copy numbers closer to the tumor biopsy in the two plasma samples that lacked visible hemolysis (patients 7 and 9). Dilution may have reduced the copy numbers determined from all our plasma samples, which were collected under suboptimal conditions for cfDNA detection. These data emphasize the importance of a standardized protocol for blood sampling and plasma preparation (limiting time at room temperature) in the development of cfDNA-based diagnostic protocols for clinical application.
A review of the literature indicates that assessment of MYCN status using quantitative real-time PCR and serum/plasma-derived cfDNA presents a promising method to analyze neuroblastoma patient samples. Serum-based MYCN analysis has been shown capable of separating patients into groups with amplified and non-amplified tumors [24, 26]. Assay sensitivity was dependent on neuroblastoma stage, and was highest in metastasized disease [25]. MYCN copy number detection in tumor-derived cfDNA from plasma samples taken before and after surgery has been suggested as a useful evaluation step for surgery and neoadjuvant chemotherapy [26]. Kurihara and colleagues analyzed plasma-derived cfDNA from patients with a variety of childhood solid tumors before and after surgery using next-generation sequencing and ddPCR for mutations, deletions or amplifications, including MYCN status in neuroblastomas [27]. They confirmed the potential of cfDNA screening using next-generation sequencing and ddPCR for biomarker detection. Here, we also accurately distinguished between MYCN-amplified and MYCN diploid status in tumors using plasma-derived cfDNA. Taken together, these results justify molecular disease characterization using tumor-derived cfDNA in blood for longitudinal monitoring of patients with neuroblastoma.
A major challenge for tumor cfDNA analysis is the extremely low amount of circulating cfDNA present in blood in at least some patients [56]. Higher sensitivity and a requirement for lower absolute cfDNA amounts has been demonstrated for ddPCR in comparison with next-generation sequencing [56]. We have pursued ddPCR as the more suitable technology for repeated target gene copy number assessement in longitudinal measurements. ALK amplification is reported in 2–5% of primary neuroblastomas [7, 57–59]. It occurs almost exclusively with MYCN amplification, and has been detected in 7–15% of MYCN-amplified neuroblastomas [10, 60]. ALK gain was reported to occur in ~15–20% of primary neuroblastomas [57, 58]. ALK copy numbers detected by ddPCR of plasma-derived cfDNA have not yet been reported for patients with neuroblastomas. We accurately assessed ALK copy numbers in the primary neuroblastomas from tumor-derived cfDNA in blood plasma samples. We detected ALK gains in 4 plasma samples, one of which was confirmed in the corresponding tumor sample. Contradictory reports of the association of ALK amplification or gain with survival have been published. ALK amplification is strongly associated with high-risk neuroblastoma and an inferior outcome, and multivariate analysis suggested an independent influence on survival for both ALK gain and amplification in a cohort of 1596 neuroblastoma samples enrolled in a COG biology study [61]. In contrast, ALK amplification was not a statistically independent marker for survival in models with MYCN, stage and age in a meta-analysis, combining a new series of 254 neuroblastomas and 455 published cases from 3 other cohorts [57]. Wang and colleagues identified only 3 neuroblastomas harboring ALK amplifications, all also harboring MYCN amplifications, in a cohort of 188 primary neuroblastomas from a patient cohort treated at the Beijing Children’s Hospital [62]. ALK amplification correlated with a decreased overall survival, whereas interestingly, MYCN or ALK gain were associated with a better prognosis. Thus, a MYCN-independent association of ALK amplification with outcome remains open. The authors concluded that classification of MYCN and ALK gene copy numbers can provide a powerful prognostic indicator. We theorize that the combined assessment of MYCN and ALK copy numbers using ddPCR of plasma-derived cfDNA during treatment and follow-up will improve risk assessment for patients and enable an early detection of relapse and metastasis. MYCN and ALK copy number assessment from plasma at diagnosis could also identify patients with possible subclonal amplifications, and this analysis should accompany tumor biopsy analyses to test its clinical predictive power for possible future use in treatment stratification.
This study presents ddPCR as an accurate tool to assess MYCN and ALK copy numbers in neuroblastoma cell lines, tumor samples and tumor-derived cfDNA in blood plasma. Our validation experiments in retrospective patient samples support the hypothesis that using tumor-derived cfDNA from patient plasma can improve detection of high-risk tumor subpopulations harboring genomic aberrations relevant for therapy choice and risk assessment. Analyzing cfDNA in liquid biopsies will enable longitudinal measurements for a patient, starting prior to therapy and continuing through treatment course and follow-up, and supporting multiple diagnostic and therapeutic decisions during all phases of care for patients with high-risk neuroblastoma. This approach may improve detection of MYCN and ALK subclonal amplifications, monitoring of disease progression and treatment response as well as relapse detection.
MATERIALS AND METHODS
Patient samples
Matched blood plasma and tumor tissue genomic DNA from primary neuroblastoma biopsies were obtained from the German Neuroblastoma Biobank (Cologne). All 10 neuroblastoma patients were registered in the German NB2004 clinical trial, and informed patient/parent consent was obtained during trial participation. The following preparatory or storage steps occurred prior to delivery of patient biosample residues for this study. Peripheral blood was stored for a minimum of 24 h, then centrifuged at approximately 1000 x g for 10 min before storage of the plasma at –80°C. The extracted tumor gDNA was stored at –80°C. Values for MYCN and ALK status determined within the NB2004 study protocol and maintained with patient records in the central trial database were communicated with the patient biomaterial samples. For comparison, blood plasma from 16 healthy individuals was collected.
Animal experiments
Subcutaneous xenografts were created by injecting 10 × 106 OHC-NB1 cells (unpublished data) suspended in 200 μl Matrigel (BD Biosciences, Heidelberg, Germany) into each flank of 3 NMRI-Foxn1nu mice. Tumor size was measured daily with a caliper, and volume was calculated by π/6(width×height×depth). Animals were sacrificed 40 days after grafting, and total blood from orbita puncture in the 3 mice was collected in a single EDTA tube and centrifuged 7 min at 3000 x g. Plasma was centrifuged 10 min at 3900 x g and the supernatant was stored at –80°C before sample preparation. Genomic DNA was extracted from the 6 tumors separately as reference tumor DNA. Animal handling and care conformed to national and EU regulatory standards of the Research Institutes for Experimental Medicine, Charité - Universitätsmedizin Berlin and experiments were approved by Landesamt für Gesundheit und Soziales Berlin.
Cell culture
The BE(2)-C cell line was obtained from ECACC (Salisbury, UK) and the COLO-320, IMR-32, Kelly and SH-SY5Y cell lines from the DSMZ (Braunschweig, Germany). CLB-GA, IMR-5, LAN-5, LAN-6, NBL-S, SK-N-FI and TR14 were kindly provided by J.H. Schulte (Charité, Universitätsmedizin Berlin, Germany), NB-1 by I. Oehme (DKFZ, Heidelberg, Germany), SH-EP and SK-N-AS by L. Savelyeva (DKFZ, Heidelberg), and SK-N-DZ by A. Künkele (Charité, Universitätsmedizin Berlin). OHC-NB1 (unpublished data) and HD-MB03 [36] were established in the Deubzer laboratory. Cell line authenticity was validated by high-throughput SNP-based assays [63]. All cell lines were cultured in full media (described in Supplementary Methods) at 37°C, 5% CO2, and continuous culture was avoided to maintain low passage numbers and reduce the risk of genomic alterations occurring. Cells for experiments were grown in short-term culture from low-passage stock aliquots maintained in liquid nitrogen. All cell lines were regularly monitored for Acholeplasma laidlawii and other species of mycoplasma as well as squirrel monkey retrovirus (SMRV) infections using high-throughput, multiplexed testing [64].
Genomic and cell-free DNA isolation
Genomic DNA was extracted from cell lines or xenograft tumors using the QIAamp DNA Mini kit (Qiagen, Hilden, Germany) according to the manufacturer’s instructions. Conditioned medium (2 ml) was collected, centrifuged at 2000 × g for 5 min and the supernatant stored at –80°C. Thawed conditioned media and plasma samples were centrifuged at 2000 × g for 5 min to clear debris, then supernatant was centrifuged at 20,000 × g for 5 min. Cell-free DNA was purified from processed conditioned media, 200 μl stored human patient plasma, 1000 μl stored healthy individual plasma and 600 μl mouse plasma using the QIAamp Circulating Nucleic Acid kit (Qiagen) then concentrated to 50 μl using the DNA Clean and Concentrator-5 kit (Zymo Research, Freiburg, Germany), both according to manufacturers’ directions. Neuroblastoma gDNA was extracted using the Qiagen Puregene Core kit A (Qiagen) according to the manufacturer’s instructions. Extracted DNA samples were quantified on a Qubit 2.0 fluorometer (Life technologies, Darmstadt, Germany). Purified genomic and cell-free DNA were stored at –80°C until MYCN and ALK copy number detection.
Droplet digital PCR
Genomic DNA from cell lines and xenograft tumors was fragmented by sonication before ddPCR. Sonication of gDNA from primary neuroblastoma samples was not possible because of the small sample volumes (20 μl), so fragmentation was achieved by adding 5 U of AluI restriction enzyme (New England Biolabs, Frankfurt/Main, Germany) to each ddPCR reaction. The QX200 Droplet Digital PCR System (Bio-Rad Laboratories, Munich, Germany) was used to simultaneously detect MYCN (2p24.3) or ALK (2p23.2-2p23.1) in a duplex reaction with the normal diploid reference gene, N-acetylglucosamine kinase (NAGK, 2p13.3) (2-D plots of the duplex reactions shown in Supplementary Figure 1). TaqMan ddPCR duplex reaction mixtures included 2x ddPCR Supermix for Probes (no dUTP) (Bio-Rad Laboratories), each primer at final concentrations of 900 nM and each probe at final concentrations of 250 nM in a total volume of 20 μl. The primers and probes used for MYCN and NAGK ddPCR were previously described [24], and are listed in Supplementary Table 1. The fluorescence dyes and quenchers of the MYCN and NAGK probes were adapted for ddPCR. ALK primers were designed from the amplicon described by Bavi et al. [65] and the ALK probe was designed with Primer3 software (http://bioinfo.ut.ee/primer3-0.4.0/primer3/), and are listed in Supplementary Table 1. Reaction mixtures were loaded into droplet generator cartridges (Bio-Rad) together with 70 μl Droplet Generation Oil (Bio-Rad). Droplets were generated in the QX200 Droplet generator, and manually transferred into a 96-well PCR plate (Eppendorf, Hamburg, Germany) according to manufacturer’s recommendations. The PCR plate was heat-sealed with the PX1 Plate Sealer (Bio-Rad), and PCR reactions were performed on a T100 Thermo Cycler (Bio-Rad) with the following program: 1 cycle at 95°C for 10 min, 40 cycles at 94°C for 30 seconds and at 58°C for 1 minute and 1 cycle at 98°C for 10 min. After PCR amplification, droplets were measured in the QX200 ddPCR Droplet Reader, and target gene copy number was analyzed using QuantaSoft analysis software (version 1.7.4, Bio-Rad). This software determined the copy number by calculating the ratio of the target molecule concentration A (copies/μl) to the reference molecule concentration B (copies/μl) times the number of reference species copies NB in the human genome 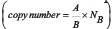 . The double-stranded synthetic MYCN template for initial ddPCR testing was obtained from Metabion (Planegg, Germany) and had the sequence: 5′- GTGCTCTCCAATTCTCGCC TTCACTAAAGTTCCTTCCACCCTCTCCTGGGGAGC CCTCCTCTAGGCCATC-3′.
Statistical analysis
Correlation analyses were performed using GraphPad Prism (version 6.00). P-values below 0.05 were considered significant.
CONFLICTS OF INTEREST
None.
FINANCIAL SUPPORT
This work was supported by the Berlin Institute of Health (BIH) through TERMINATE-NB (CRG04, 1.1.4.4).
REFERENCES
1. Schulte JH, Eggert A. Neuroblastoma. Crit Rev Oncog. 2015; 20:245–70.
2. Matthay KK, Maris JM, Schleiermacher G, Nakagawara A, Mackall CL, Diller L, Weiss WA. Neuroblastoma. Nat Rev Dis Primers. 2016; 2: 16078.
3. Brodeur GM, Bagatell R. Mechanisms of neuroblastoma regression. Nat Rev Clin Oncol. 2014; 11:704–13.
4. Pinto NR, Applebaum MA, Volchenboum SL, Matthay KK, London WB, Ambros PF, Nakagawara A, Berthold F, Schleiermacher G, Park JR, Valteau-Couanet D, Pearson AD, Cohn SL. Advances in Risk Classification and Treatment Strategies for Neuroblastoma. J Clin Oncol. 2015; 33:3008–17.
5. Schwab M, Alitalo K, Klempnauer KH, Varmus HE, Bishop JM, Gilbert F, Brodeur G, Goldstein M, Trent J. Amplified DNA with limited homology to myc cellular oncogene is shared by human neuroblastoma cell lines and a neuroblastoma tumour. Nature. 1983; 305:245–8.
6. Brodeur GM, Seeger RC, Schwab M, Varmus HE, Bishop JM. Amplification of N-myc in untreated human neuroblastomas correlates with advanced disease stage. Science. 1984; 224:1121–4.
7. Mosse YP, Laudenslager M, Longo L, Cole KA, Wood A, Attiyeh EF, Laquaglia MJ, Sennett R, Lynch JE, Perri P, Laureys G, Speleman F, Kim C, et al. Identification of ALK as a major familial neuroblastoma predisposition gene. Nature. 2008; 455:930–5.
8. Chen Y, Takita J, Choi YL, Kato M, Ohira M, Sanada M, Wang L, Soda M, Kikuchi A, Igarashi T, Nakagawara A, Hayashi Y, Mano H, et al. Oncogenic mutations of ALK kinase in neuroblastoma. Nature. 2008; 455:971–4.
9. Janoueix-Lerosey I, Lequin D, Brugieres L, Ribeiro A, de Pontual L, Combaret V, Raynal V, Puisieux A, Schleiermacher G, Pierron G, Valteau-Couanet D, Frebourg T, Michon J, et al. Somatic and germline activating mutations of the ALK kinase receptor in neuroblastoma. Nature. 2008; 455:967–70.
10. George RE, Sanda T, Hanna M, Frohling S, Luther W 2nd, Zhang J, Ahn Y, Zhou W, London WB, McGrady P, Xue L, Zozulya S, Gregor VE, et al. Activating mutations in ALK provide a therapeutic target in neuroblastoma. Nature. 2008; 455:975–8.
11. Bresler SC, Wood AC, Haglund EA, Courtright J, Belcastro LT, Plegaria JS, Cole K, Toporovskaya Y, Zhao H, Carpenter EL, Christensen JG, Maris JM, Lemmon MA, et al. Differential inhibitor sensitivity of anaplastic lymphoma kinase variants found in neuroblastoma. Sci Transl Med. 2011; 3: 108ra14.
12. Duijkers FA, Gaal J, Meijerink JP, Admiraal P, Pieters R, de Krijger RR, van Noesel MM. Anaplastic lymphoma kinase (ALK) inhibitor response in neuroblastoma is highly correlated with ALK mutation status, ALK mRNA and protein levels. Cell Oncol (Dordr). 2011; 34:409–17.
13. Carpenter EL, Mosse YP. Targeting ALK in neuroblastoma--preclinical and clinical advancements. Nat Rev Clin Oncol. 2012; 9:391–9.
14. Barone G, Anderson J, Pearson AD, Petrie K, Chesler L. New strategies in neuroblastoma: Therapeutic targeting of MYCN and ALK. Clin Cancer Res. 2013; 19:5814–21.
15. Osajima-Hakomori Y, Miyake I, Ohira M, Nakagawara A, Nakagawa A, Sakai R. Biological role of anaplastic lymphoma kinase in neuroblastoma. Am J Pathol. 2005; 167:213–22.
16. Puissant A, Frumm SM, Alexe G, Bassil CF, Qi J, Chanthery YH, Nekritz EA, Zeid R, Gustafson WC, Greninger P, Garnett MJ, McDermott U, Benes CH, et al. Targeting MYCN in neuroblastoma by BET bromodomain inhibition. Cancer Discov. 2013; 3:308–23.
17. Henssen A, Althoff K, Odersky A, Beckers A, Koche R, Speleman F, Schafers S, Bell E, Nortmeyer M, Westermann F, De Preter K, Florin A, Heukamp L, et al. Targeting MYCN-Driven Transcription By BET-Bromodomain Inhibition. Clin Cancer Res. 2016; 22:2470–81.
18. Corvetta D, Chayka O, Gherardi S, D’Acunto CW, Cantilena S, Valli E, Piotrowska I, Perini G, Sala A. Physical interaction between MYCN oncogene and polycomb repressive complex 2 (PRC2) in neuroblastoma: functional and therapeutic implications. J Biol Chem. 2013; 288:8332–41.
19. Charlet J, Szemes M, Malik KT, Brown KW. MYCN is recruited to the RASSF1A promoter but is not critical for DNA hypermethylation in neuroblastoma. Mol Carcinog. 2014; 53:413–20.
20. Deubzer HE, Ehemann V, Westermann F, Heinrich R, Mechtersheimer G, Kulozik AE, Schwab M, Witt O. Histone deacetylase inhibitor Helminthosporium carbonum (HC)-toxin suppresses the malignant phenotype of neuroblastoma cells. Int J Cancer. 2008; 122:1891–900.
21. Lodrini M, Oehme I, Schroeder C, Milde T, Schier MC, Kopp-Schneider A, Schulte JH, Fischer M, De Preter K, Pattyn F, Castoldi M, Muckenthaler MU, Kulozik AE, et al. MYCN and HDAC2 cooperate to repress miR-183 signaling in neuroblastoma. Nucleic Acids Res. 2013; 41:6018–33.
22. Gustafson WC, Meyerowitz JG, Nekritz EA, Chen J, Benes C, Charron E, Simonds EF, Seeger R, Matthay KK, Hertz NT, Eilers M, Shokat KM, Weiss WA. Drugging MYCN through an allosteric transition in Aurora kinase A. Cancer Cell. 2014; 26:414–27.
23. Combaret V, Audoynaud C, Iacono I, Favrot MC, Schell M, Bergeron C, Puisieux A. Circulating MYCN DNA as a tumor-specific marker in neuroblastoma patients. Cancer Res. 2002; 62:3646–8.
24. Gotoh T, Hosoi H, Iehara T, Kuwahara Y, Osone S, Tsuchiya K, Ohira M, Nakagawara A, Kuroda H, Sugimoto T. Prediction of MYCN amplification in neuroblastoma using serum DNA and real-time quantitative polymerase chain reaction. J Clin Oncol. 2005; 23:5205–10.
25. Combaret V, Hogarty MD, London WB, McGrady P, Iacono I, Brejon S, Swerts K, Noguera R, Gross N, Rousseau R, Puisieux A. Influence of neuroblastoma stage on serum-based detection of MYCN amplification. Pediatr Blood Cancer. 2009; 53:329–31.
26. Kojima M, Hiyama E, Fukuba I, Yamaoka E, Ueda Y, Onitake Y, Kurihara S, Sueda T. Detection of MYCN amplification using blood plasma: noninvasive therapy evaluation and prediction of prognosis in neuroblastoma. Pediatr Surg Int. 2013; 29:1139–45.
27. Kurihara S, Ueda Y, Onitake Y, Sueda T, Ohta E, Morihara N, Hirano S, Irisuna F, Hiyama E. Circulating free DNA as non-invasive diagnostic biomarker for childhood solid tumors. J Pediatr Surg. 2015; 50:2094–7.
28. Combaret V, Iacono I, Bellini A, Brejon S, Bernard V, Marabelle A, Coze C, Pierron G, Lapouble E, Schleiermacher G, Blay JY. Detection of tumor ALK status in neuroblastoma patients using peripheral blood. Cancer Med. 2015; 4:540–50.
29. Kidess-Sigal E, Liu HE, Triboulet MM, Che J, Ramani VC, Visser BC, Poultsides GA, Longacre TA, Marziali A, Vysotskaia V, Wiggin M, Heirich K, Hanft V, et al. Enumeration and targeted analysis of KRAS, BRAF and PIK3CA mutations in CTCs captured by a label-free platform: Comparison to ctDNA and tissue in metastatic colorectal cancer. Oncotarget. 2016; 7:85349–64. https://doi.org/10.18632/oncotarget.13350.
30. Garcia-Silva S, Peinado H. Melanosomes foster a tumour niche by activating CAFs. Nat Cell Biol. 2016; 18:911–3.
31. Dorr JR, Yu Y, Milanovic M, Beuster G, Zasada C, Dabritz JH, Lisec J, Lenze D, Gerhardt A, Schleicher K, Kratzat S, Purfurst B, Walenta S, et al. Synthetic lethal metabolic targeting of cellular senescence in cancer therapy. Nature. 2013; 501:421–5.
32. Khoja L, Lorigan P, Dive C, Keilholz U, Fusi A. Circulating tumour cells as tumour biomarkers in melanoma: detection methods and clinical relevance. Ann Oncol. 2015; 26:33–9.
33. Ambros PF, Mehes G, Ambros IM, Ladenstein R. Disseminated tumor cells in the bone marrow - chances and consequences of microscopical detection methods. Cancer Lett. 2003; 197:29–34.
34. Hindson BJ, Ness KD, Masquelier DA, Belgrader P, Heredia NJ, Makarewicz AJ, Bright IJ, Lucero MY, Hiddessen AL, Legler TC, Kitano TK, Hodel MR, Petersen JF, et al. High-throughput droplet digital PCR system for absolute quantitation of DNA copy number. Anal Chem. 2011; 83:8604–10.
35. Beaver JA, Jelovac D, Balukrishna S, Cochran RL, Croessmann S, Zabransky DJ, Wong HY, Valda Toro P, Cidado J, Blair BG, Chu D, Burns T, Higgins MJ, et al. Detection of cancer DNA in plasma of patients with early-stage breast cancer. Clin Cancer Res. 2014; 20:2643–50.
36. Milde T, Lodrini M, Savelyeva L, Korshunov A, Kool M, Brueckner LM, Antunes AS, Oehme I, Pekrun A, Pfister SM, Kulozik AE, Witt O, Deubzer HE. HD-MB03 is a novel Group 3 medulloblastoma model demonstrating sensitivity to histone deacetylase inhibitor treatment. J Neurooncol. 2012; 110:335–48.
37. Alitalo K, Schwab M, Lin CC, Varmus HE, Bishop JM. Homogeneously staining chromosomal regions contain amplified copies of an abundantly expressed cellular oncogene (c-myc) in malignant neuroendocrine cells from a human colon carcinoma. Proc Natl Acad Sci U S A. 1983; 80:1707–11.
38. Amler LC, Schwab M. Amplified N-myc in human neuroblastoma cells is often arranged as clustered tandem repeats of differently recombined DNA. Mol Cell Biol. 1989; 9:4903–13.
39. Oude Luttikhuis ME, Iyer VK, Dyer S, Ramani P, McConville CM. Detection of MYCN amplification in neuroblastoma using competitive PCR quantitation. Lab Invest. 2000; 80:271–3.
40. Kohl NE, Kanda N, Schreck RR, Bruns G, Latt SA, Gilbert F, Alt FW. Transposition and amplification of oncogene-related sequences in human neuroblastomas. Cell. 1983; 35:359–67.
41. Carr-Wilkinson J, Griffiths R, Elston R, Gamble LD, Goranov B, Redfern CP, Lunec J, Tweddle DA. Outcome of the p53-mediated DNA damage response in neuroblastoma is determined by morphological subtype and MYCN expression. Cell Cycle. 2011; 10:3778–87.
42. Hachitanda Y, Saito M, Mori T, Hamazaki M. Application of fluorescence in situ hybridization to detect N-myc (MYCN) gene amplification on paraffin-embedded tissue sections of neuroblastomas. Med Pediatr Oncol. 1997; 29:135–8.
43. Zhang Y, Tang ET, Du Z. Detection of MET Gene Copy Number in Cancer Samples Using the Droplet Digital PCR Method. PLoS One. 2016; 11: e0146784.
44. Belgrader P, Tanner SC, Regan JF, Koehler R, Hindson BJ, Brown AS. Droplet digital PCR measurement of HER2 copy number alteration in formalin-fixed paraffin-embedded breast carcinoma tissue. Clin Chem. 2013; 59:991–4.
45. Zhu Y, Lu D, Lira ME, Xu Q, Du Y, Xiong J, Mao M, Chung HC, Zheng G. Droplet digital polymerase chain reaction detection of HER2 amplification in formalin fixed paraffin embedded breast and gastric carcinoma samples. Exp Mol Pathol. 2016; 100:287–93.
46. Zhai Z, Yu X, Yang B, Zhang Y, Zhang L, Li X, Sun H. Colorectal cancer heterogeneity and targeted therapy: Clinical implications, challenges and solutions for treatment resistance. Semin Cell Dev Biol. 2016; 64:107–115.
47. Song JL, Chen C, Yuan JP, Sun SR. Progress in the clinical detection of heterogeneity in breast cancer. Cancer Med. 2016; 5:3475–88.
48. Patel AP, Tirosh I, Trombetta JJ, Shalek AK, Gillespie SM, Wakimoto H, Cahill DP, Nahed BV, Curry WT, Martuza RL, Louis DN, Rozenblatt-Rosen O, Suva ML, et al. Single-cell RNA-seq highlights intratumoral heterogeneity in primary glioblastoma. Science. 2014; 344:1396–401.
49. Schramm A, Koster J, Assenov Y, Althoff K, Peifer M, Mahlow E, Odersky A, Beisser D, Ernst C, Henssen AG, Stephan H, Schroder C, Heukamp L, et al. Mutational dynamics between primary and relapse neuroblastomas. Nat Genet. 2015; 47:872–7.
50. Bellini A, Bernard V, Leroy Q, Rio Frio T, Pierron G, Combaret V, Lapouble E, Clement N, Rubie H, Thebaud E, Chastagner P, Defachelles AS, Bergeron C, et al. Deep Sequencing Reveals Occurrence of Subclonal ALK Mutations in Neuroblastoma at Diagnosis. Clin Cancer Res. 2015; 21:4913–21.
51. Chicard M, Boyault S, Colmet Daage L, Richer W, Gentien D, Pierron G, Lapouble E, Bellini A, Clement N, Iacono I, Brejon S, Carrere M, Reyes C, et al. Genomic Copy Number Profiling Using Circulating Free Tumor DNA Highlights Heterogeneity in Neuroblastoma. Clin Cancer Res. 2016; 22:5564–5573.
52. Peifer M, Hertwig F, Roels F, Dreidax D, Gartlgruber M, Menon R, Kramer A, Roncaioli JL, Sand F, Heuckmann JM, Ikram F, Schmidt R, Ackermann S, et al. Telomerase activation by genomic rearrangements in high-risk neuroblastoma. Nature. 2015; 526:700–4.
53. Valentijn LJ, Koster J, Zwijnenburg DA, Hasselt NE, van Sluis P, Volckmann R, van Noesel MM, George RE, Tytgat GA, Molenaar JJ, Versteeg R. TERT rearrangements are frequent in neuroblastoma and identify aggressive tumors. Nat Genet. 2015; 47:1411–4.
54. De Mattos-Arruda L, Weigelt B, Cortes J, Won HH, Ng CK, Nuciforo P, Bidard FC, Aura C, Saura C, Peg V, Piscuoglio S, Oliveira M, Smolders Y, et al. Capturing intra-tumor genetic heterogeneity by de novo mutation profiling of circulating cell-free tumor DNA: a proof-of-principle. Ann Oncol. 2014; 25:1729–35.
55. Chan KC, Jiang P, Zheng YW, Liao GJ, Sun H, Wong J, Siu SS, Chan WC, Chan SL, Chan AT, Lai PB, Chiu RW, Lo YM. Cancer genome scanning in plasma: detection of tumor-associated copy number aberrations, single-nucleotide variants, and tumoral heterogeneity by massively parallel sequencing. Clin Chem. 2013; 59:211–24.
56. Diaz LA Jr, Bardelli A. Liquid biopsies: genotyping circulating tumor DNA. J Clin Oncol. 2014; 32:579–86.
57. De Brouwer S, De Preter K, Kumps C, Zabrocki P, Porcu M, Westerhout EM, Lakeman A, Vandesompele J, Hoebeeck J, Van Maerken T, De Paepe A, Laureys G, Schulte JH, et al. Meta-analysis of neuroblastomas reveals a skewed ALK mutation spectrum in tumors with MYCN amplification. Clin Cancer Res. 2010; 16:4353–62.
58. Weiser D, Laudenslager M, Rappaport E, Carpenter E, Attiyeh EF, Diskin S, London WB, Maris JM, Mosse YP. Stratification of patients with neuroblastoma for targeted ALK inhibitor therapy. J Clin Oncol. 2011; 29.
59. Ogawa S, Takita J, Sanada M, Hayashi Y. Oncogenic mutations of ALK in neuroblastoma. Cancer Sci. 2011; 102:302–8.
60. Azarova AM, Gautam G, George RE. Emerging importance of ALK in neuroblastoma. Semin Cancer Biol. 2011; 21:267–75.
61. Bresler SC, Weiser DA, Huwe PJ, Park JH, Krytska K, Ryles H, Laudenslager M, Rappaport EF, Wood AC, McGrady PW, Hogarty MD, London WB, Radhakrishnan R, et al. ALK mutations confer differential oncogenic activation and sensitivity to ALK inhibition therapy in neuroblastoma. Cancer Cell. 2014; 26:682–94.
62. Wang M, Zhou C, Sun Q, Cai R, Li Y, Wang D, Gong L. ALK amplification and protein expression predict inferior prognosis in neuroblastomas. Exp Mol Pathol. 2013; 95:124–30.
63. Castro F, Dirks WG, Fahnrich S, Hotz-Wagenblatt A, Pawlita M, Schmitt M. High-throughput SNP-based authentication of human cell lines. Int J Cancer. 2013; 132:308–14.
64. Schmitt M, Pawlita M. High-throughput detection and multiplex identification of cell contaminations. Nucleic Acids Res. 2009; 37: e119.
65. Bavi P, Jehan Z, Bu R, Prabhakaran S, Al-Sanea N, Al-Dayel F, Al-Assiri M, Al-Halouly T, Sairafi R, Uddin S, Al-Kuraya KS. ALK gene amplification is associated with poor prognosis in colorectal carcinoma. Br J Cancer. 2013; 109:2735–43.
66. Muth D, Ghazaryan S, Eckerle I, Beckett E, Pohler C, Batzler J, Beisel C, Gogolin S, Fischer M, Henrich KO, Ehemann V, Gillespie P, Schwab M, et al. Transcriptional repression of SKP2 is impaired in MYCN-amplified neuroblastoma. Cancer Res. 2010; 70:3791–802.
67. Zaizen Y, Taniguchi S, Noguchi S, Suita S. The effect of N-myc amplification and expression on invasiveness of neuroblastoma cells. J Pediatr Surg. 1993; 28:766–9.
68. Guo C, White PS, Weiss MJ, Hogarty MD, Thompson PM, Stram DO, Gerbing R, Matthay KK, Seeger RC, Brodeur GM, Maris JM. Allelic deletion at 11q23 is common in MYCN single copy neuroblastomas. Oncogene. 1999; 18:4948–57.
69. Do JH, Kim IS, Park TK, Choi DK. Genome-wide examination of chromosomal aberrations in neuroblastoma SH-SY5Y cells by array-based comparative genomic hybridization. Mol Cells. 2007; 24:105–12.
70. Izumi H, Kaneko Y. Evidence of asymmetric cell division and centrosome inheritance in human neuroblastoma cells. Proc Natl Acad Sci U S A. 2012; 109:18048–53.
71. Yusuf M, Leung K, Morris KJ, Volpi EV. Comprehensive cytogenomic profile of the in vitro neuronal model SH-SY5Y. Neurogenetics. 2013; 14:63–70.
72. Krishna A, Biryukov M, Trefois C, Antony PM, Hussong R, Lin J, Heinaniemi M, Glusman G, Koglsberger S, Boyd O, van den Berg BH, Linke D, Huang D, et al. Systems genomics evaluation of the SH-SY5Y neuroblastoma cell line as a model for Parkinson‘s disease. BMC Genomics. 2014; 15: 1154.
73. Corvi R, Savelyeva L, Schwab M. Duplication of N-MYC at its resident site 2p24 may be a mechanism of activation alternative to amplification in human neuroblastoma cells. Cancer Res. 1995; 55:3471–4.
74. Thiele CJ. Neuroblastoma Cell Lines. Lancaster, UK: Kluwer Academic Publishers. 1998; 1:21–53.
75. Blumrich A, Zapatka M, Brueckner LM, Zheglo D, Schwab M, Savelyeva L. The FRA2C common fragile site maps to the borders of MYCN amplicons in neuroblastoma and is associated with gross chromosomal rearrangements in different cancers. Hum Mol Genet. 2011; 20:1488–501.
76. Caren H, Abel F, Kogner P, Martinsson T. High incidence of DNA mutations and gene amplifications of the ALK gene in advanced sporadic neuroblastoma tumours. Biochem J. 2008; 416:153–9.
77. McDermott U, Iafrate AJ, Gray NS, Shioda T, Classon M, Maheswaran S, Zhou W, Choi HG, Smith SL, Dowell L, Ulkus LE, Kuhlmann G, Greninger P, et al. Genomic alterations of anaplastic lymphoma kinase may sensitize tumors to anaplastic lymphoma kinase inhibitors. Cancer Res. 2008; 68:3389–95.