
INTRODUCTION
Based on the GLOBOCAN2012 investigations, approximately 14.1 million new cancer cases and 8.2 million deaths were reported worldwide [1]. The overall incidence of brain tumor is estimated at 3.5 case per 100,000 persons, and glioma and meningioma are the most common types of primary brain tumors, accounting for approximately 50% and 20%, respectively [2, 3]. Primary brain tumors mostly occur in familial aggregation, indicating important role of genetic variants in the pathogenesis of brain tumor [4].
Folate metabolism plays an important role in carcinogenesis, due to its involvement in DNA synthesis, methylation and repair. Folate metabolism regulates nucleotide synthesis and DNA methylation via a complex pathway involving at least 30 different enzymes [5]. Therefore, individual genetic variation in these enzymes could change the general balance between DNA synthesis, methylation, and repair. The genes encoding enzymes involved in folate metabolism display several single nucleotide polymorphisms, such as methylenetetrahydrofolate reductase (MTHFR A1298C) and methionine synthase reductase (MTRR A66G). Genetic polymorphisms of folate metabolism pathways have been shown to be associated with diverse tumor types, including pancreatic cancer [6], cervical intraepithelial neoplasia [7], breast cancer [8] and acute leukemia [9-11].
Semmler et al. reported the first case-control study showing that A1298C genetic variant was not significantly associated with brain tumor susceptibility [12]. Up to now, the two most common Folate Metabolism genetic variants A1298C (rs1801131) and A66G (rs1801394) have been studied for their associations with brain tumor susceptibility, but the results from published articles are controversial and inconclusive [12-16]. We hypothesized that the inconsistent results may have been caused by either the relatively small sample sizes of single studies or the genetic heterogeneity of folate metabolism genetic variants in different populations. Therefore, we performed this meta-analysis including all studies available to evaluate the relationship between folate metabolism genetic polymorphisms and the susceptibility to meningioma and glioma in adults. To our knowledge, this is the first comprehensive and systematic meta-analysis to investigate the relationship between genetic polymorphisms of folate metabolism and meningioma and glioma susceptibility in adults.
RESULTS
Characteristics of eligible publications
After screening the abstracts, titles, or contents through EMBASE, PubMed and the Cochrane Library, we identified 72 potentially relevant studies and selected five published studies [12-16]. The flow diagram describing the selection of the studies is shown in Figure 1. All selected studies were case-control study, their population size ranged from 154 to 1,200, and were published from 2006 to 2013. All SNPs tested indicated that genotype frequencies in the controls are consistent with the HWE (P > 0.001). The characteristics of the selected studies are summarized in Table 1.
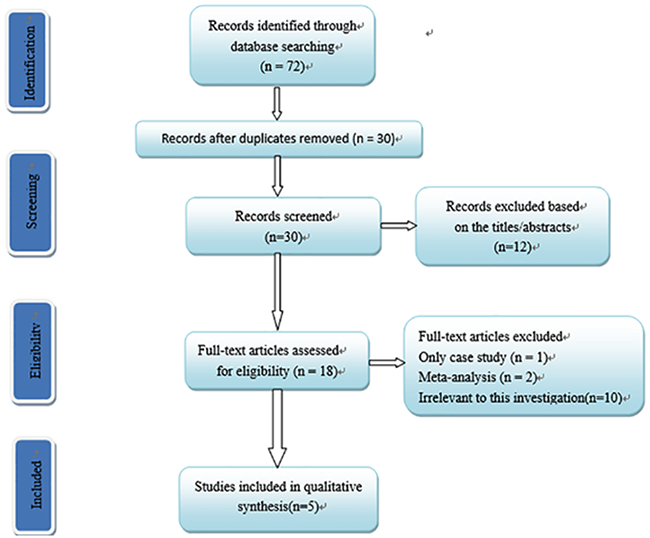
Figure 1: Flow chart of study selection in this meta-analysis.
Table 1: Main characteristics of studies included in the meta-analysis
Author |
Year |
Country |
Ethnicity |
Cancer |
Control |
Genotyping |
Case |
Control |
HWE |
|
|---|---|---|---|---|---|---|---|---|---|---|
A1298C |
||||||||||
Semmler |
2008 |
German |
Caucasian |
Meningioma |
PB |
PCR-RFLP |
100 |
100 |
0.842 |
|
Zhang |
2013 |
China |
Asian |
Meningioma |
PB |
PCR-RFLP |
600 |
600 |
0.199 |
|
Bethke |
2008 |
UK-North |
Caucasian |
Meningioma |
PB |
lllumina |
173 |
175 |
0.219 |
|
Bethke |
2008 |
UK-Southeast |
Caucasian |
Meningioma |
PB |
lllumina |
121 |
123 |
0.423 |
|
Bethke |
2008 |
Sweden |
Caucasian |
Meningioma |
PB |
lllumina |
149 |
149 |
0.759 |
|
Bethke |
2008 |
Denmark |
Caucasian |
Meningioma |
PB |
lllumina |
110 |
113 |
0.104 |
|
Bethke |
2008 |
Finland |
Caucasian |
Meningioma |
PB |
lllumina |
77 |
77 |
0.783 |
|
Li |
2013 |
China |
Asian |
Meningioma |
PB |
PCR-RFLP |
317 |
320 |
0.063 |
|
Bethke |
2008 |
UK-North |
Caucasian |
Glioma |
PB |
lllumina |
369 |
369 |
0.029 |
|
Bethke |
2008 |
UK-Southeast |
Caucasian |
Glioma |
PB |
lllumina |
211 |
214 |
0.564 |
|
Bethke |
2008 |
Sweden |
Caucasian |
Glioma |
PB |
lllumina |
197 |
196 |
0.495 |
|
Bethke |
2008 |
Denmark |
Caucasian |
Glioma |
PB |
lllumina |
99 |
100 |
0.798 |
|
Bethke |
2008 |
Finland |
Caucasian |
Glioma |
PB |
lllumina |
128 |
131 |
0.746 |
|
Liu |
2013 |
China |
Asian |
Glioma |
HB |
PCR |
273 |
326 |
0.008 |
|
A66G |
||||||||||
Zhang |
2013 |
China |
Asian |
Meningioma |
PB |
PCR-RFLP |
600 |
600 |
0.765 |
|
Bethke |
2008 |
UK-North |
Caucasian |
Meningioma |
PB |
lllumina |
174 |
175 |
0.733 |
|
Bethke |
2008 |
UK-Southeast |
Caucasian |
Meningioma |
PB |
lllumina |
121 |
123 |
0.756 |
|
Bethke |
2008 |
Sweden |
Caucasian |
Meningioma |
PB |
lllumina |
149 |
149 |
0.641 |
|
Bethke |
2008 |
Denmark |
Caucasian |
Meningioma |
PB |
lllumina |
110 |
113 |
0.9 |
|
Bethke |
2008 |
Finland |
Caucasian |
Meningioma |
PB |
lllumina |
77 |
77 |
0.361 |
|
Bethke |
2008 |
UK-North |
Caucasian |
Glioma |
PB |
lllumina |
128 |
131 |
0.212 |
|
Bethke |
2008 |
UK-Southeast |
Caucasian |
Glioma |
PB |
lllumina |
370 |
369 |
0.966 |
|
Bethke |
2008 |
Sweden |
Caucasian |
Glioma |
PB |
lllumina |
211 |
214 |
0.477 |
|
Bethke |
2008 |
Denmark |
Caucasian |
Glioma |
PB |
lllumina |
197 |
197 |
0.872 |
|
Bethke |
2008 |
Finland |
Caucasian |
Glioma |
PB |
lllumina |
99 |
100 |
0.017 |
PB, population-based; HB, hospital-based; HWE, Hardy-Weinberg equilibrium.
Association between A66G polymorphism and the susceptibility of meningioma and glioma in adults
Meta-analysis of A66G polymorphism in 2,236 cases and 2,248 controls showed a significant association between A66G and the risk of meningioma and glioma (G vs. A: OR=1.11, 95%CI=1.02-1.20; GG vs. AA: OR=1.22, 95%CI=1.03-1.45; GG vs. AA+AG: OR=1.17, 95%CI=1.00-1.36) (Figure 2). Stratification analysis by tumor type showed a significant association of A66G polymorphism with meningioma (G vs. A: OR=1.18, 95%CI=1.05-1.32; GG vs. AA: OR=1.41, 95%CI=1.12-1.77; GG vs. AA+AG: OR=1.32, 95%CI=1.07-1.63; GG+AG vs. AA: OR=1.19, 95%CI=1.01-1.40), but not with glioma. We also implemented stratified analysis by ethnicity, and found a significant association in Asian population (GG vs. AA: OR=1.41, 95%CI=1.02-1.96) (Table 2).
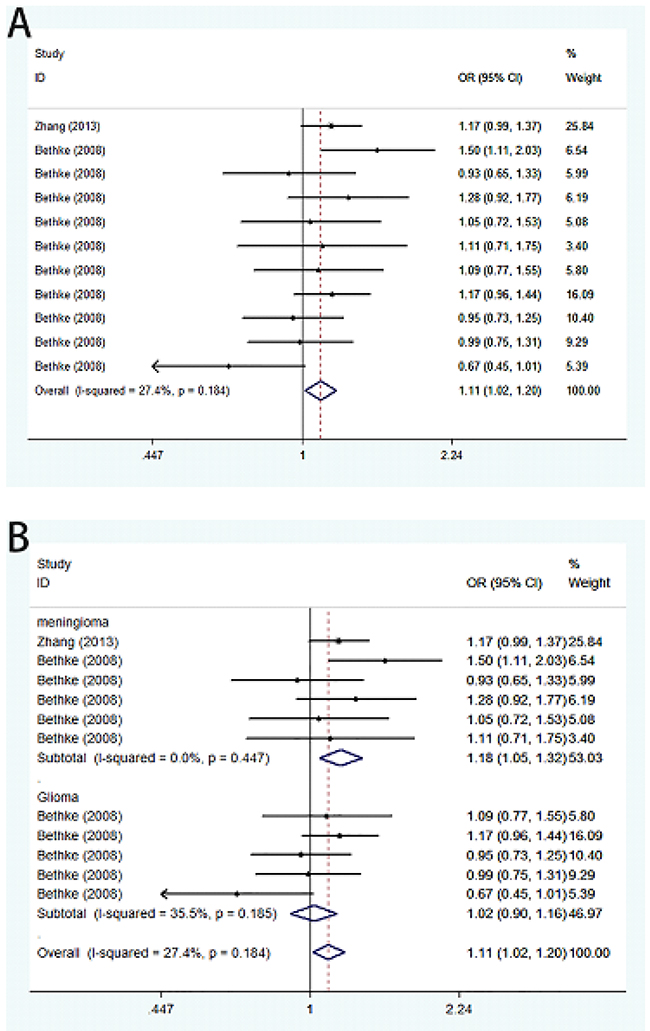
Figure 2: Forest plot on the association between A66G (rs1801394) and meningioma and glioma susceptibility in adults in the allele model. (A) Overall analysis. (B) Subgroup analysis by cancer type.
Table 2: Meta-analysis of the association between A66G polymorphism and brain tumor susceptibility in adults
Comparison |
Subgroup |
Studies |
Heterogeneity test |
Association test |
Model |
Publication bias |
|||
|---|---|---|---|---|---|---|---|---|---|
P Value |
I2 (%) |
OR (95%CI) |
P Value |
Begg |
Egger |
||||
G vs. A |
Overall |
11 |
0.184 |
27.4 |
1.11(1.02-1.20) |
0.02 |
F |
0.35 |
0.262 |
Meningioma |
5 |
0.447 |
0 |
1.18(1.05-1.32) |
0.004 |
F |
|||
Glioma |
6 |
0.185 |
35.5 |
1.02(0.90-1.16) |
0.748 |
F |
|||
Caucasian |
10 |
0.155 |
31.7 |
1.08(0.98-1.19) |
0.109 |
F |
|||
Asian |
1 |
NA |
NA |
1.17(0.99-1.37) |
0.062 |
F |
|||
AG vs. AA |
Overall |
11 |
0.806 |
0 |
1.08(0.95-1.23) |
0.235 |
F |
0.755 |
0.52 |
Meningioma |
5 |
0.447 |
0 |
1.12(0.94-1.33) |
0.226 |
F |
|||
Glioma |
6 |
0.891 |
0 |
1.04(0.86-1.27) |
0.669 |
F |
|||
Caucasian |
10 |
0.752 |
0 |
1.10(0.95-1.29) |
0.205 |
F |
|||
Asian |
1 |
NA |
NA |
1.03(0.80-1.32) |
0.836 |
F |
|||
GG vs. AA |
Overall |
11 |
0.089 |
39 |
1.22(1.03-1.45) |
0.023 |
F |
0.213 |
0.178 |
Meningioma |
5 |
0.527 |
0 |
1.41(1.12-1.77) |
0.004 |
R |
|||
Glioma |
6 |
0.054 |
57.1 |
0.95(0.62-1.44) |
0.801 |
R |
|||
Caucasian |
10 |
0.079 |
41.7 |
1.16(0.95-1.41) |
0.156 |
F |
|||
Asian |
1 |
NA |
NA |
1.41(1.02-1.96) |
0.04 |
F |
|||
GG+AG vs. AA |
Overall |
11 |
0.648 |
0 |
1.12(0.99-1.27) |
0.074 |
F |
0.876 |
0.813 |
Meningioma |
5 |
0.394 |
3.5 |
1.19(1.01-1.40) |
0.04 |
F |
|||
Glioma |
6 |
0.836 |
0 |
1.04(0.86-1.25) |
0.705 |
F |
|||
Caucasian |
10 |
0.554 |
0 |
1.12(0.97-1.29) |
0.132 |
F |
|||
Asian |
1 |
NA |
NA |
1.12(0.89-1.42) |
0.336 |
F |
|||
GG vs. AA+AG |
Overall |
11 |
0.083 |
39.8 |
1.17(1.00-1.36) |
0.043 |
F |
0.161 |
0.08 |
Meningioma |
5 |
0.707 |
4.6 |
1.32(1.07-1.63) |
0.009 |
R |
|||
Glioma |
6 |
0.024 |
64.5 |
0.93(0.61-1.40) |
0.711 |
R |
|||
Caucasian |
10 |
0.09 |
40.2 |
1.10(0.92-1.31) |
0.294 |
F |
|||
Asian |
1 |
NA |
NA |
1.39(1.03-1.87) |
0.029 |
F |
|||
OR, odds ratio; CI, confidence interval; F, fixed-effects model; R, random-effects model; NA, not available; PB, population-based; HB, hospital-based
Association between A1298C polymorphism and the susceptibility of meningioma and glioma in adults
Summary of the association of A1298C polymorphic variant with the risk of meningioma and glioma in adults including 2,997 cases and 3,403 controls is shown in Table 3. Pooled risk evaluation showed a significant association between A1298C and the risk of meningioma and glioma (C vs. A: OR=1.08, 95%CI=1.00-1.17; AC vs. AA: OR=1.22, 95%CI=1.09-1.36; CC+AC vs. AA: 0R=1.18, 95%CI=1.06-1.30) (Figure 3). Then we implemented subgroup analysis by cancer type, and found no significant association of A1298C genotypes with meningioma susceptibility. In contrast, we detected a significantly increased risk of glioma (C vs. A: OR=1.13, 95%CI=1.01-1.27; AC vs. AA: OR=1.35, 95%CI=1.15-1.60; CC+AC vs. AA: OR=1.29, 95%CI=1.11-1.51). Further subgroup analysis showed significantly increased risk of meningioma and glioma in heterozygous model (AC vs. AA: OR=1.19, 95%CI=1.06-1.34), and dominant model (CC+AC vs. AA: OR=1.16, 95%CI=1.04-1.29). We also performed stratified analysis by ethnicity, and found a significant association of A1298C and the risk of meningioma and glioma in heterozygous model (AC vs. AA: OR=1.31, 95%CI=1.14-1.51) and dominant model (CC+AC vs. AA: OR=1.25, 95%CI=1.09-1.42) in Caucasian. However, there was no significant association with the risk of meningioma and glioma in Asian under any genetic model (Table 3).
Table 3: Meta-analysis of the association between A1298C polymorphism and brain tumor susceptibility in adults
Comparison |
Subgroup |
Studies |
Heterogeneity test |
Association test |
Model |
Publication bias |
|||
|---|---|---|---|---|---|---|---|---|---|
P Value |
I2 (%) |
OR (95%CI) |
P Value |
Begg |
Egger |
||||
C vs. A |
Overall |
14 |
0.971 |
0 |
1.08(1.00-1.17) |
0.056 |
F |
0.743 |
0.854 |
Meningioma |
8 |
0.879 |
0 |
1.04(0.93-1.15) |
0.522 |
F |
|||
Glioma |
6 |
0.977 |
0 |
1.13(1.01-1.27) |
0.033 |
F |
|||
Caucasian |
11 |
0.978 |
0 |
1.10(1.00-1.22) |
0.059 |
F |
|||
Asian |
3 |
0.447 |
0 |
1.05(0.93-1.18) |
0.474 |
F |
|||
PB |
13 |
0.958 |
0 |
1.07(0.99-1.17) |
0.097 |
F |
|||
HB |
1 |
NA |
NA |
1.13(0.90-1.43) |
0.296 |
F |
|||
AC vs. AA |
Overall |
14 |
0.717 |
0 |
1.22(1.09-1.36) |
<0.001 |
F |
0.584 |
0.189 |
Meningioma |
8 |
0.649 |
0 |
1.12(0.97-1.30) |
0.119 |
F |
|||
Glioma |
6 |
0.868 |
0 |
1.35(1.15-1.60) |
<0.001 |
F |
|||
Caucasian |
11 |
0.981 |
0 |
1.31(1.14-1.51) |
<0.001 |
R |
|||
Asian |
3 |
0.13 |
51 |
1.11(0.86-1.44) |
0.413 |
R |
|||
PB |
13 |
0.764 |
0 |
1.19(1.06-1.34) |
0.002 |
F |
|||
HB |
1 |
NA |
NA |
1.50(1.05-2.14) |
0.025 |
F |
|||
CC vs. AA |
Overall |
14 |
0.941 |
0 |
1.03(0.86-1.22) |
0.771 |
F |
0.274 |
0.131 |
Meningioma |
8 |
0.636 |
0 |
0.98(0.77-1.24) |
0.854 |
F |
|||
Glioma |
6 |
0.987 |
0 |
1.09(0.84-1.40) |
0.531 |
F |
|||
Caucasian |
11 |
0.916 |
0 |
0.99(0.79-1.25) |
0.942 |
F |
|||
Asian |
3 |
0.51 |
0 |
1.07(0.82-1.40) |
0.599 |
F |
|||
PB |
13 |
0.914 |
0 |
1.01(0.84-1.22) |
0.883 |
F |
|||
HB |
1 |
NA |
NA |
1.11(0.69-1.77) |
0.676 |
F |
|||
CC+AC vs. AA |
Overall |
14 |
0.88 |
0 |
1.18(1.06-1.30) |
0.002 |
F |
0.743 |
0.328 |
Meningioma |
8 |
0.836 |
0 |
1.09(0.95-1.25) |
0.208 |
F |
|||
Glioma |
6 |
0.921 |
0 |
1.29(1.11-1.51) |
0.001 |
F |
|||
Caucasian |
11 |
0.991 |
0 |
1.25(1.09-1.42) |
0.001 |
F |
|||
Asian |
3 |
0.212 |
35.5 |
1.08(0.92-1.27) |
0.35 |
F |
|||
PB |
13 |
0.893 |
0 |
1.16(1.04-1.29) |
0.009 |
F |
|||
HB |
1 |
NA |
NA |
1.38(0.99-1.93) |
0.058 |
F |
|||
CC vs. AA+AC |
Overall |
14 |
0.841 |
0 |
0.93(0.78-1.09) |
0.363 |
F |
0.511 |
0.085 |
Meningioma |
8 |
0.394 |
4.6 |
0.92(0.73-1.16) |
0.483 |
F |
|||
Glioma |
6 |
0.983 |
0 |
0.93(0.73-1.19) |
0.561 |
F |
|||
Caucasian |
11 |
0.844 |
0 |
0.87(0.70-1.09) |
0.222 |
F |
|||
Asian |
3 |
0.416 |
0 |
1.00(0.78-1.29) |
0.990 |
F |
|||
PB |
13 |
0.786 |
0 |
0.93(0.78-1.12) |
0.448 |
F |
|||
HB |
1 |
NA |
NA |
0.89(0.58-1.36) |
0.587 |
F |
|||
OR, odds ratio; CI, confidence interval; F, fixed-effects model; R, random-effects model; NA, not available; PB, population-based; HB, hospital-based
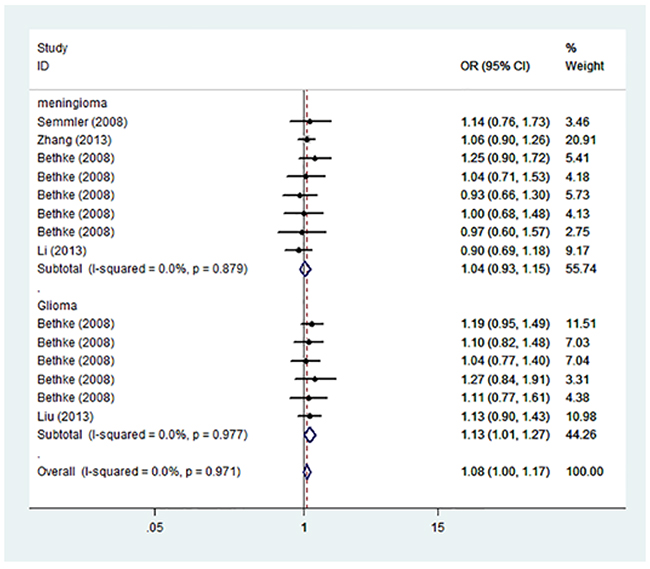
Figure 3: Forest plot on the association between A1298C (rs1801311) and meningioma and glioma susceptibility in adults stratified by cancer type in the allele model.
Heterogeneity and sensitivity analysis
Between-study heterogeneity was calculated by using Q statistics. Fixed-effect model was utilized if p-value of heterogeneity tests was more than 0.05 (P>0.05) [17]; otherwise, the random-effect model was applied [18]. The sensitivity analysis was conducted by omitting each eligible study each time. The pooled ORs for the effects of A66G and A1298C on the risk of meningioma and glioma indicated that our results were statistically robust and stable (Figure 4).
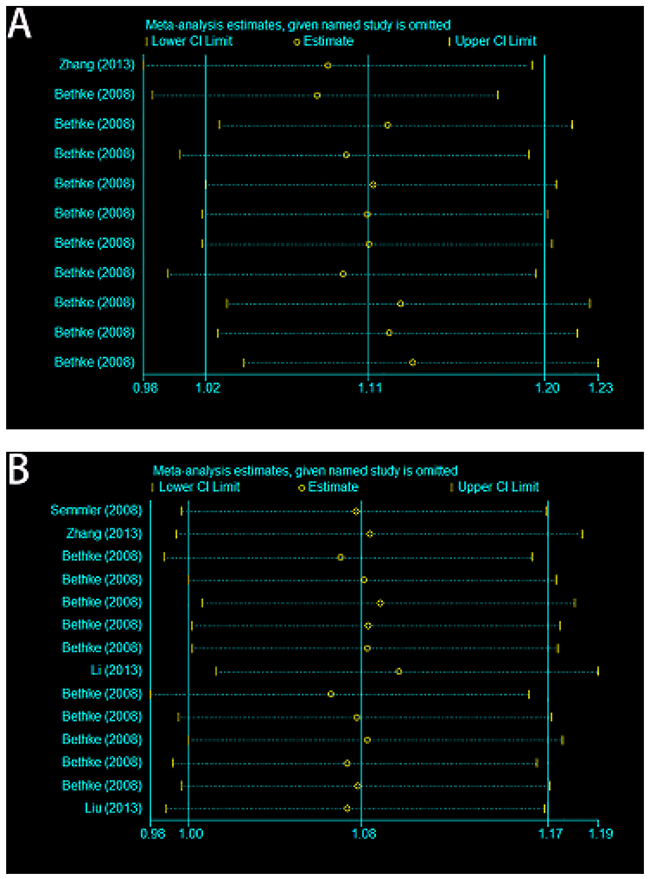
Figure 4: Sensitivity analyses of current meta-analysis in the allele model. (A) A66G (rs1801394) and meningioma and glioma risk in adults. (B) A1298C (rs1801311) and meningioma and glioma risk in adults.
Publication bias
Both Begg’s and Egger’s tests were used to evaluate the publication bias of the studies [19, 20]. The results showed that there was no obvious publication bias in total population (Table 2 and Table 3, Figure 5A, 5B).
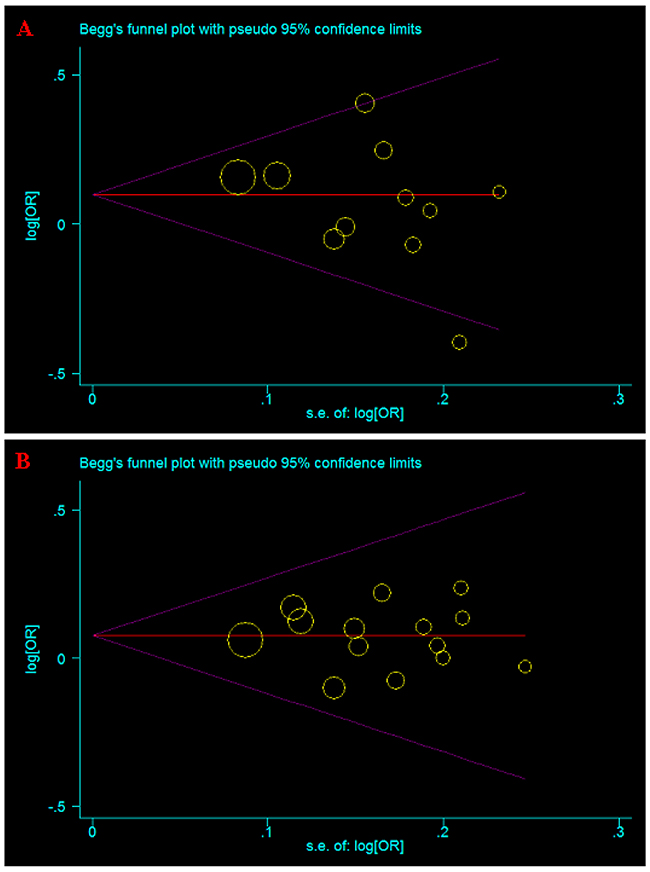
Figure 5: Begg’s funnel plot for publication bias test of current meta-analysis in the allele model. (A) A66G (rs1801394). (B) A1298C (rs1801311).
DISCUSSION
Accumulating evidences indicate that the intake of folic acid has a negative correlation with cancer [21-23], including brain tumors [16]. It is known that folate metabolism will produce intermediate products that participate in nucleotide synthesis, DNA methylation and histone methylation [24-26]. Methylenetetrahydrofolate reductase (MTHFR) and methionine synthase reductase (MTRR) are key enzymes of folate metabolism that are involved in two important branches of folate metabolism: nucleotide synthesis and DNA methylation [24]. The polymorphisms of the genes encoding these enzymes will affect the process of folate metabolism and thus disturb DNA synthesis, repair and methylation, contributing to the occurrence of brain tumor [25].
Human MTHFR gene is located on 1p36.3 locus and contains 11 exons and 10 introns, encoding 656 amino acids [27, 28]. MTHFR protein turns 5,10-methylenetetrahydrofolate into 5-methylenetetrahydrofolate [29]. 5- methylenetetrahydrofolate is a collaborative substrate of homocysteine which is transformed to methionine, and provides methyl groups. MTHFR gene mutation could reduce methylene tetrahydrofolate reductase activity, leading to a higher plasma homocysteine concentration and abnormal metabolism of folic acid, and disturbed DNA synthesis and DNA damage repair [26, 30-33]. MTRR gene is located on the short arm of chromosome 5 (5p15.2-15.3) and contains 15 exons and 14 introns. The most common MTRR mutation is A66G polymorphism, causing the change of isoleucine to methionine, which can reduce enzyme activity and affect the metabolism of homocysteine [32-34].
Although increased number of case-control studies investigated the association of folate metabolism genetic variants with brain tumor susceptibility in adults, the results are inconclusive. Numerous studies have reported that folate metabolism genetic variants are associated with the risk of several cancers, including head and neck [35], lung [36], breast [8], and colorectal cancer [37, 38]. Semmler et al. reported the first case-control study showing that folate metabolism genetic variants was not significantly associated with brain tumor susceptibility [12]. However, Li et al. found that folate metabolism genetic variants may play a pivotal role in the pathogenesis of meningioma [15]. In addition, Bethke et al. reported that genetic variants in folate metabolism affected the risk of developing both meningioma and glioma [16]. To our knowledge, our study is the first comprehensive and systematical meta-analysis to evaluate potential association between two folate metabolism genetic variants (A1298C and A66G) and meningioma and glioma susceptibility in adults [12-16]. Our results showed that A1298C variant significantly increased meningioma and glioma susceptibility in Caucasian. Meanwhile, we observed that A66G variant was associated with increased meningioma and glioma susceptibility in Asian. Our results are consistent with a previous meta-analysis showing that MTRR rs1801394 polymorphism may increase the risk of meningioma [39].
The findings of current study should be interpreted with caution due to several potential limitations. First, the majority of the subjects included in present study were ethnically Caucasian, thus subjects from more diverse ethnicities should be included in future studies. Second, the number of subjects enrolled in certain subgroups was relatively small. Owing to the lack of the original data, we could not estimate meningioma and glioma susceptibility stratified by the gender, age, life-style and other risk factors. Data from large-scale multi-center studies are needed to verify the association between folate metabolism genetic variants (A1298C and A66G) and meningioma and glioma susceptibility in adults.
In conclusion, our findings suggest that folate metabolism genetic variants (A1298C and A66G) may increase the susceptibility of meningioma and glioma in adults. Further large-scale, multi-center and well-designed studies are necessary to investigate the potential function of genetic variation of folate metabolism in meningioma and glioma in adults.
MATERIALS AND METHODS
Search strategy
We carried out a literature search in EMBASE, PubMed, and the Cochrane Library up to August 2016. We performed electronic searches using the terms “brain tumor” or “glioma” or “meningioma”, “polymorphism*” or “variant*” or “mutation”, “MTHFR” or “MTRR”.
Selection criteria
Two authors (GXL. and CCH.) independently screened titles and abstracts to identify relevant studies. Published case-control studies will be included in current meta-analysis if they reach the following criteria: (a) evaluating the association between folate metabolism genetic variants (A1298C and A66G) and brain tumor susceptibility in adults; (b) case-control studies on human, and published in English; (c) sufficient data for assessing the ORs and 95%CI, and P value. Exclusion criteria were: (a) case reports, letters, and review articles; (b) containing only case groups; (c) duplication of published articles.
Data extraction
Two authors (GXL. and LXC) independently extracted data from all eligible studies. Data such as: (a) the first author name, publication date, country, ethnicity and source of control; (b) cancer types, frequency of cases and controls, involved genes and HWE status in controls. Any disagreements between the two authors were resolved through discussions and agreements
Statistical analyses
The strength of association between folate metabolism genetic variants (A1298C and A66G) and meningioma and glioma susceptibility in adults was calculated by odds ratios (ORs) with 95% confidence interval (CI). We used dominant, recessive, homozygote, heterozygote, allelic as the models. Stratified analyses were conducted by cancer type, ethnicity and sources of control. The pooled ORs were calculated for these five models. Heterogeneity was evaluated by using Q statistics (significant at p < 0.05). A Fixed-effect model was utilized if p-value of heterogeneity tests were more than 0.05 (P>0.05) [17]; otherwise, the random effect model was applied [18]. The sensitivity analysis was conducted by discarding each eligible study each time to estimate the stability of the results. Potential publication bias was evaluated by Egger’s and Begg’s tests (P < 0.05 was considered significant) [19, 20]. All analyses were conducted by STATA 12.0 (Stata Corp LP, College Station, TX, USA).
CONFLICTS OF INTEREST
The authors declared that they have no competing interest.
REFERENCES
1. Torre LA, Bray F, Siegel RL, Ferlay J, Lortet-Tieulent J, Jemal A. Global cancer statistics, 2012. CA Cancer J Clin. 2015; 65:87-108.
2. Inskip PD, Linet MS, Heineman EF. Etiology of brain tumors in adults. Epidemiol Rev. 1995; 17:382-414.
3. DeAngelis LM. Brain tumors. N Engl J Med. 2001; 344:114-123.
4. Bondy ML, Scheurer ME, Malmer B, Barnholtz-Sloan JS, Davis FG, Il’yasova D, Kruchko C, McCarthy BJ, Rajaraman P, Schwartzbaum JA, Sadetzki S, Schlehofer B, Tihan T, et al, and Brain Tumor Epidemiology Consortium. Brain tumor epidemiology: consensus from the Brain Tumor Epidemiology Consortium. Cancer. 2008; 113:1953-1968.
5. Lucock M. Folic acid: nutritional biochemistry, molecular biology, and role in disease processes. Mol Genet Metab. 2000; 71:121-138.
6. Li D, Ahmed M, Li Y, Jiao L, Chou TH, Wolff RA, Lenzi R, Evans DB, Bondy ML, Pisters PW, Abbruzzese JL, Hassan MM. 5,10-Methylenetetrahydrofolate reductase polymorphisms and the risk of pancreatic cancer. Cancer Epidemiol Biomarkers Prev. 2005; 14:1470-1476.
7. Henao OL, Piyathilake CJ, Waterbor JW, Funkhouser E, Johanning GL, Heimburger DC, Partridge EE. Women with polymorphisms of methylenetetrahydrofolate reductase (MTHFR) and methionine synthase(MS) are less likely to have cervical intraepithelial neoplasia (CIN) 2 or 3. Int J Cancer. 2005; 113:991–997.
8. Lissowska J, Gaudet MM, Brinton LA, Chanock SJ, Peplonska B, Welch R, Zatonski W, Szeszenia-Dabrowska N, Park S, Sherman M, Garcia-Closas M. Genetic polymorphisms in the one-carbon metabolism pathway and breast cancer risk: a population-based case-control study and meta-analyses. Int J Cancer. 2007; 120:2696-2703.
9. Wiemels JL, Smith RN, Taylor GM, Eden OB, Alexander FE, Greaves MF, United Kingdom Childhood Cancer Study investigators. Methylenetetrahydrofolate reductase (MTHFR) polymorphisms and risk of molecularly defined subtypes of childhood acute leukemia. Proc Natl Acad Sci U S A. 2001; 98:4004-4009.
10. Skibola CF, Forrest MS, Coppede F, Agana L, Hubbard A, Smith MT, Bracci PM, Holly EA. Polymorphisms and haplotypes in folate-metabolizing genes and risk of non-Hodgkin lymphoma. Blood. 2004; 104:2155-2162.
11. Skibola CF, Smith MT, Kane E, Roman E, Rollinson S, Cartwright RA, Morgan G. Polymorphisms in the methylenetetrahydrofolate reductase gene are associated with susceptibility to acute leukemia in adults. Proc Natl Acad Sci U S A. 1999; 96:12810-12815.
12. Semmler A, Simon M, Moskau S, Linnebank M. Polymorphisms of methionine metabolism and susceptibility to meningioma formation: laboratory investigation. J Neurosurg. 2008; 108:999-1004.
13. Zhang J, Zhou YW, Shi HP, Wang YZ, Li GL, Yu HT, Xie XY. 5,10-Methylenetetrahydrofolate reductase (MTHFR), methionine synthase (MTRR), and methionine synthase reductase (MTR) gene polymorphisms and adult meningioma risk. J Neurooncol. 2013; 115:233-239.
14. Liu N, Jiang J, Song YJ, Zhao SG, Tong ZG, Song HS, Wu H, Zhu JY, Gu YH, Sun Y, Hua W, Qi JP. Impact of MTHFR polymorphisms on methylation of MGMT in glioma patients from Northeast China with different folate levels. Genet Mol Res. 2013; 12:5160-5171.
15. Li R, Wang R, Li Y, Li X, Feng Y, Li Y, Jiang C. Association study on MTHFR polymorphisms and meningioma in northern China. Gene. 2013; 516:291-293.
16. Bethke L, Webb E, Murray A, Schoemaker M, Feychting M, Lonn S, Ahlbom A, Malmer B, Henriksson R, Auvinen A, Kiuru A, Salminen T, Johansen C, et al. Functional polymorphisms in folate metabolism genes influence the risk of meningioma and glioma. Cancer Epidemiol Biomarkers Prev. 2008; 17:1195-1202.
17. Mantel N, Haenszel W. Statistical aspects of the analysis of data from retrospective studies of disease. J Natl Cancer Inst. 1959; 22:719-748.
18. DerSimonian R, Laird N. Meta-analysis in clinical trials. Control Clin Trials. 1986; 7:177-188.
19. Egger M, Davey Smith G, Schneider M, Minder C. Bias in meta-analysis detected by a simple, graphical test. BMJ. 1997; 315:629-634.
20. Begg CB, Mazumdar M. Operating characteristics of a rank correlation test for publication bias. Biometrics. 1994; 50:1088-1101.
21. Larsson SC, Hakansson N, Giovannucci E, Wolk A. Folate intake and pancreatic cancer incidence: a prospective study of Swedish women and men. J Natl Cancer Inst. 2006; 98:407-413.
22. Cunningham D, Atkin W, Lenz HJ, Lynch HT, Minsky B, Nordlinger B, Starling N. Colorectal cancer. Lancet. 2010; 375:1030-1047.
23. Lashner BA, Heidenreich PA, Su GL, Kane SV, Hanauer SB. Effect of folate supplementation on the incidence of dysplasia and cancer in chronic ulcerative colitis. Gastroenterology. 1989; 97,255-259.
24. Das PM, Singal R. DNA methylation and cancer. J Clin Oncol. 2004; 22:4632-4642.
25. Kim TY, Zhong S, Fields CR, Kim JH, Robertson KD. Epigenomic profiling reveals novel and frequent targets of aberrant DNA methylation-mediated silencing in malignant glioma. Cancer Res. 2006; 66:7490-7501.
26. van der Put NM, Gabreëls F, Stevens EM, Smeitink JA, Trijbels FJ, Eskes TK, van den Heuvel LP, Blom HJ. A second common mutation in the methylenetetrahydrofolate reductase gene: an additional risk factor for neural-tube defects? Am J Hum Genet. 1998; 62:1044-1051.
27. Prasad AN, Rupar CA, Prasad C. Methylene-tetrahydrofolate reductase (MTHFR) deficiency and infantile epilepsy. Brain Dev. 2011; 33:758-769.
28. Weisberg l, Tran P, Christensen B, Sibani S, Rozen R. A second genetic polymorphism in methylenetetrahydrofolate reductase (MTHFR) associated with decreased enzyme activity. Mol Genet Metab. 1998; 64:169-172.
29. Koppen IJ, Hermans FJ, Kaspers GJ. Folate related gene polymorphisms and susceptibility to develop childhood acute lymphoblastic leukaemia. Br J Haematol. 2010; 148:3-14.
30. Mudd SH, Uhlendorf BW, Freeman JM, Finkelstein JD, Shih VE. Homocystinuria associated with decreased methylenetetrahydrofolate reductase activity. Biochem Biophys Res Commun. 1972; 46:905-912.
31. Beetstra S, Thomas P, Salisbury C, Turner J, Fenech M. Folic acid deficiency increases chromosomal instability, chromosome 21 aneuploidy and sensitivity to radiation-induced micronuclei. Mutat Res. 2005; 578:317-326.
32. Leclerc D, Campeau E, Goyette P, Adjalla CE, Christensen B, Ross M, Eydoux P, Rosenblatt DS, Rozen R, Gravel RA. Human methionine synthase: cDNA cloning and identification of mutations in patients of the cblG complementation group of folate/cobalamin disorders. Hum Mol Genet. 1996; 5:1867-1874.
33. Olteanu H, Munson T, Banerjee R. Differences in the efficiency of reductive activation of methionine synthase and exogenous electron acceptors between the common polymorphic variants of human methionine synthase reductase. Biochemistry. 2002; 41,13378-13385.
34. Gaughan DJ, Kluijtmans LA, Barbaux S, McMaster D, Young IS, Yarnell JW, Evans A, Whitehead AS. The methionine synthase reductase (MTRR) A66G polymorphism is a novel genetic determinant of plasma homocysteine concentrations. Atherosclerosis. 2001; 157:451-456.
35. Forastiere A, Koch W, Trotti A, Sidransky D. Head and neck cancer. N Engl J Med. 2001; 345:1890-1900.
36. Cui LH, Shin MH, Kim HN, Song HR, Piao JM, Kweon SS, Choi JS, Yun WJ, Kim YC, Oh IJ, Kim KS. Methylenetetrahydrofolate reductase C677T polymorphism in patients with lung cancer in a Korean population. BMC Med Genet. 2011; 12:28.
37. Brockton NT. Localized depletion: the key to colorectal cancer risk mediated by MTHFR genotype and folate? Cancer Causes Control. 2006; 17:1005-1016.
38. Wettergren Y, Odin E, Carlsson G, Gustavsson B. MTHFR, MTR, and MTRR polymorphisms in relation to p16INK4A hypermethylation in mucosa of Patients with colorectal cancer. Mol Med. 2010; 16:425-432.
39. Zeng XT, Lu JT, Tang XJ, Weng H, Luo J. Association of methionine synthase rs1801394 and methionine synthase reductase rs1805087 polymorphisms with meningioma in adults: A meta-analysis. Biomed Rep. 2014; 2:432-436.