
INTRODUCTION
More than 80 years ago, Warburg proposed that one of the most fundamental characteristics of cancer cells is high glucose requirement and increased glucose uptake [1]. Most recently, a number of facilitative glucose transporters have been described to be highly expressed in a wide range of cancer types [2–4]. Glucose transporter (GLUT) family, an expanding family of transmembrane glycol-proteins including GLUT-1 to GLUT-12, is critical for the passive transporting glucose into most cells [5]. Although the metabolic consequences of elevated glucose transporter are not fully understood, the clinical significance of GLUT expression has been illustrated recently.
GLUT-1, a member of glucose transporter family, is originally purified from erythocytes and also found in endothelial cells at the blood-brain barrier, eye, placenta, peripheral nerve and lactating mammary gland [6–7]. It is generally undetectable in normal epithelial cells and benign epithelial tumors, but increased GLUT-1 expression has been observed in a proportion of human malignancies [8–13]. Moreover, experimental studies using in vitro models have shown that overexpression of GLUT-1 in cancer cell lines can activate proliferation and survival [14]. In contrast, anti-Glut-1 antibodies result in cell growth inhibition and apoptosis [15]. The mechanisms underlying GLUT-1 regulation in cancer involve in different signaling molecules and pathways, including PI3K/Akt signaling pathway, hypoxia induced factor 1 (HIF-1), Ras, c-Myc and tumor suppressor protein p53 [16]. Numerous reports have suggested that increased GLUT-1 expression has been shown to be associated with poor prognosis in various human cancers [17–22]. However, most studies reporting the implication of GLUT-1 expression are limited in their small sample sizes and discrete outcomes. Therefore, we conduct a systematic review and quantitative meta-analysis to evaluate the prognostic value of GLUT-1 expression as a prognostic marker in human cancers.
MATERIALS AND METHODS
Study strategy
The present study was performed according to recent guidelines for meta-analyses and systematic reviews of tumor marker prognostic studies [23–24]. To identify all potential relevant studies, two authors (Wei-yi Gong and Zheng-xiao Zhao) independently searched PubMed, Embase and Web of Science databases to obtain all appropriate articles about GLUT-1 as a prognostic factor for cancer patient survival, without language limitations. The literature search was updated on Oct 20th, 2016. Both Medical Subject Headings and free-text terms, such as “Glucose transporter-1”, “GLUT1”, “Solute carrier family 2A member 1”, “SLC2A1”, “erythrocyte glucose transporter”, “cancer”, “carcinoma”, “tumor”, “prognosis”, “prognostic”, and “survival”, were used to increase the search sensitivity. The bibliographies of the included studies were also searched to identify additional trials.
Study selection
Two investigators (Wei-yi Gong and Zheng-xiao Zhao) independently screened all eligible studies and extracted the data from included studies. Studies were considered eligible if they fulfilled the following criteria: (1) to deal with human cancer, excepting blood carcinomas; (2) to determine GLUT-1 expression in human tissue using immunohistochemistry (IHC); (3) to examine the relationship between GLUT-1 expression and survival; (4) to provide sufficient data to estimate hazard ratios (HRs) for survival rates and their 95% confidence intervals (CIs); (5) to have been published in English. The studies were excluded if any of the cases occurred: (1) animal studies and single case reports; (2) critical information could not be extracted or calculated from the original article.
Data extraction
The two investigators (Wei-yi Gong and Zheng-xiao Zhao) extracted data independently. Disagreements were resolved through discussion with a third investigator (Bao-jun Liu). Data on the following characteristics were collected from each article: author, year of publication, country of the population enrolled, number of patients, tumor type, clinical stage of tumor, elevated GLUT-1 expression, cut-off values, overall survival (OS), disease-free survival (DFS), recurrence-free survival (RFS), progression-free survival (PFS), disease-specific survival (DSS), metastasis-free survival (MFS), cancer-specific survival (CSS), and time to progression (TTP).
Quality assessment of the primary studies
Quality assessment was independently performed by three investigators (Wei-yi Gong, Zheng-xiao Zhao, and Bao-jun Liu) and scored as previously reported [25–26]. Four main methods were evaluated: scientific design, laboratory methodology, generalizability of results, and analysis of the study data. There were four to seven items for each method. Each item was scored as follows: if it was clearly and accurately defined, two points; if it was unclear or incomplete, one point; and if it was not defined or inadequate, zero point. The final scores were expressed as percentages ranging from 0 to 100%, with a higher values reflecting better methodological quality (> 80%).
Statistical analysis
HRs were extracted using three previously published methods [27–28]. The most accurate method was to obtain hazard ratios (HRs) with their corresponding 95%CIs directly from the published results or to calculate them from the O-E statistic and variance (if available). When both univariate and multivariate Cox regression analyses were reported in the articles, only results of multivariate analysis were selected in the final analysis. If such information was not available, relevant data, such as the number of patients at risk in each group, the number of events, and the log-rank statistics or p-values, were used to calculate an approximation of the HRs. However, in some studies, HRs were only displayed in the form of Kaplan-Meier survival curves. Hence we had to evaluate the HRs by extracting survival rates at specified time points from the graphic information as reported previously [28]. In briefly, Engauge Digitizer version 4.1 was used to obtain the necessary points read from the curve. Results were combined as pooled HRs and their 95% CIs. Subgroup analyses were carried out according to the following factors, when appropriate: region, sample size, type of carcinoma, treatment, and quality score.
Meta-regression was generated to explore the possible sources of heterogeneity. They were first estimated using the fixed-effect model to assume heterogeneity. If the heterogeneity was significant (p < 0.05 or I2 > 50%), estimation applying the random-effect model (Mantel-Haenszel) was performed [29].
Sensitivity analysis was applied to test the contribution of some studies to the overall effect and the reliability of the combined results. Sensitivity was assessed in the absence of removing each study. Furthermore, cumulative meta-analyses were conducted to assess the dynamic trends of HRs for OS, DFS and RFS over time.
Publication bias was qualitatively evaluated using funnel plots and quantitatively investigated with Begg’s rank correlation test and Egger’s regression asymmetry test in the presence of publication bias [30–31]. The statistical analysis was performed using Stata software version 12.0 (Stata, College Station, TX).
RESULTS
Data selection and characteristics of eligible studies
We got 515 publications using the literature screening strategy shown in Figure 1. After reviewing titles and abstracts, 464 irrelevant or duplicate studies were excluded. The remaining articles were identified through full paper review and excluded if GLUT-1 expression was not evaluated through IHC or if there were insufficient data to estimate HRs (Supplementary Table 3). Finally, 41 articles were included in the present study.
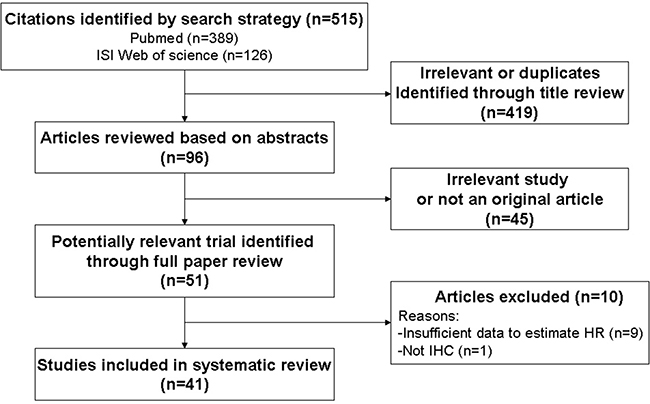
Figure 1: Schemata of the systematic review.
The detailed characteristics of the included studies are shown in Supplementary Table 1 [17–22, 32–66]. Most of the studies were published in the past ten years (range 2006–2016) nevertheless the exact interval was between 1998 and 2016. We evaluated studies from 14 different countries, including 11 studies from Japan, seven from Korea, six from the United States, five from Germany, and the remaining 12 from ten other countries. A total of 4794 participants were enrolled in these eligible studies, with minimum and maximum sample sizes of 37 and 617 respectively (mean, 116.9 patients).
Twenty-one different types of carcinoma were investigated, most of which were carcinomas of the digestive system (five pancreatic adenocarcinoma, three esophageal squamous cell carcinoma, four each of oral squamous cell carcinoma and colorectal cancer, two each of gastric carcinoma). Other cancer types were also analyzed, including three studies each of ovarian carcinoma and non-small cell lung cancer (NSCLC), two studies on cervix carcinoma and gallbladder carcinomas, and the remaining 12 studies on different types of cancer.
All the studies involve treatment information, and patients underwent surgery were enrolled in 39 studies. Outcome measures were clearly defined in 23 studies, and multivariate analyses were performed in 33 studies (80.5%). OS, RFS, DFS, PFS, MFS and DSS were the primary outcome measures in the included studies. We decided to focus on OS, RFS and DFS. More than half of the included studies (36/41, 87.8%) scored a quality of ≥ 80%.
A total of 51 HRs were from 41 studies, including 30 for OS; seven for DFS; four for RFS; three for DSS; two for MFS and PFS; one for TTP, CSS, EFS. Among these, 26 HRs were directly acquired and 5 were estimated from the total number of events and the log-rank statistics or p-values. The remaining 20 were estimated from Kaplan-Meier survival curves. High or positive GLUT-1 expression was identified as an indicator of poor OS (29/30, 96.7%), DFS (6/7, 85.7%), RFS (3/4, 75%), DSS (3/3, 100%).
The prognostic significance of high GLUT-1 expression in OS in human cancer
The correlation between GLUT-1 expression and OS was performed in aggregative 30 literatures enrolling 3528 patients with various cancer types [18–22, 32, 37–40, 42, 44–54, 57–58, 60–63, 65–66]. The overall analysis showed that high GLUT-1 expression was associated with poor OS in cancer (HR = 1.833, 95% CI: 1.597–2.069; P < 0.0001) with no significant heterogeneity (I2 = 0%) (Table 1 and Figure 2). The cumulative meta-analysis showed that HRs was rater stable over time (Figure 3A). Such results demonstrated that high GLUT-1 expression was an independent predictor for poor OS in multiple cancers.
Table 1: Results of subgroup analysis of the association between GLUT-1 expression and OS of multiple cancers
Subgroup analysis |
No. of studies |
No. of patients |
Pooled HR |
p value |
Meta regression (p-value) |
Heterogeneity |
|
|---|---|---|---|---|---|---|---|
I2 |
p-value (χ2) |
||||||
Overall survival |
30 |
3528 |
1.833 [1.597–2.069] |
< 0.0001 |
0% |
0.856 |
|
Region |
< 0.0001 |
||||||
Asian countries |
14 |
1725 |
1.793 [1.458–2.129] |
< 0.0001 |
0% |
0.954 |
|
Western countries |
16 |
1803 |
1.872 [1.54–2.204] |
< 0.0001 |
1.25% |
0.438 |
|
Sample size |
< 0.0001 |
||||||
< 150 |
19 |
1207 |
1.801 [1.395–2.207] |
< 0.0001 |
0% |
0.698 |
|
≥ 150 |
11 |
2321 |
1.849 [1.559–2.14] |
< 0.0001 |
0% |
0.766 |
|
Type of cancer |
< 0.0001 |
||||||
Gastric cancer |
2 |
810 |
1.858 [1.365–2.351] |
< 0.0001 |
30.70% |
0.23 |
|
Urinary carcinoma |
2 |
96 |
4.589 [1.523–7.655] |
0.003 |
0% |
0.4 |
|
Ovarian carcinoma |
2 |
277 |
1.823 [1.163–2.482] |
< 0.0001 |
0% |
0.904 |
|
Oral squamous cell carcinomas |
4 |
342 |
2.224 [1.141–3.306] |
< 0.0001 |
0% |
0.694 |
|
Pancreatic adenocarcinoma |
5 |
296 |
1.729 [1.177–2.282] |
< 0.0001 |
0% |
0.506 |
|
Colorectal cancer |
4 |
591 |
1.473 [0.968–1.979] |
< 0.0001 |
0% |
0.683 |
|
Lung cancer |
2 |
290 |
2.026 [1.278–2.775] |
< 0.0002 |
0% |
0.732 |
|
Gallbladder carcinomas |
2 |
127 |
3.363 [0.218–6.508] |
0.036 |
60.90% |
0.11 |
|
Esophageal squamous cell carcinoma |
2 |
158 |
1.815 [0.779–2.85] |
0.001 |
0% |
0.794 |
|
Treatment |
< 0.0001 |
||||||
Surgery without preoperative treatment |
22 |
1.911 [1.653–2.168] |
< 0.0001 |
0% |
0.872 |
||
Surgery with preoperative treatment |
8 |
1.417 [0.821–2.013] |
< 0.0001 |
0% |
0.672 |
||
Quality score (%) |
< 0.0001 |
||||||
< 83.0 |
14 |
1.916 [1.611–2.22] |
< 0.0001 |
0% |
0.538 |
||
≥ 83.0 |
16 |
1.709 [1.336–2.083] |
< 0.0001 |
0% |
0.902 |
||
OS: overall survival; HR: hazard ratio.
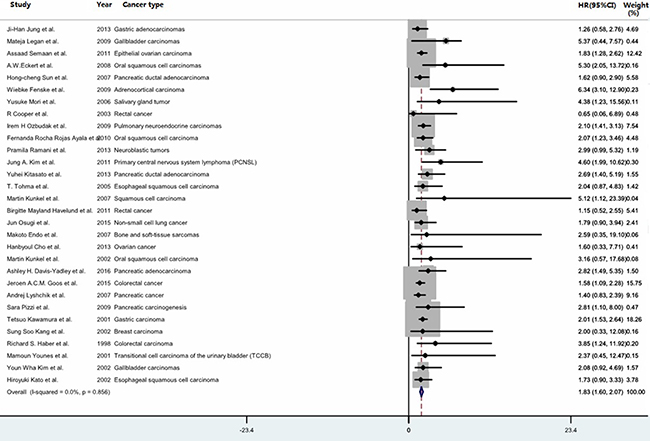
Figure 2: Forest plot for the meta-analysis of the association between GLUT-1 expression and overall survival in various cancer types. The segments represent the 95% confidence intervals (CIs) of each study. The diamond represents the overall effect size, and the diamond’s width represents the overall 95% CI.
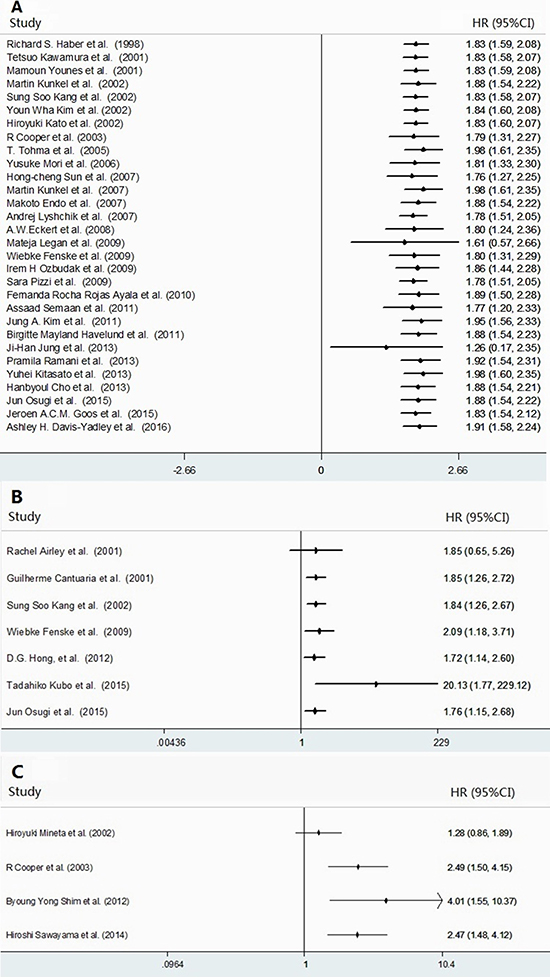
Figure 3: Forest plots for the accumulative meta-analyses of the association between GLUT-1 expression and cancer survival. The following cancer survival measures were analyzed: OS (A), DFS (B), and RFS (C). The segments represent the 95% confidence interval (CIs) of each study. The diamond represents the overall effect size, and the diamond’s width represents the overall 95% CI.
Subgroup analysis indicated high GLUT-1 expression was significantly associated with poor OS in gastric cancer (HR = 1.858, 95%CI: 1.365–2.351; P < 0.0001), urinary carcinoma (HR = 4.589, 95% CI: 1.523–7.655; P = 0.003), ovarian carcinoma (HR = 1.823, 95%CI: 1.163–2.482; P < 0.0001); oral squamous cell carcinomas (HR = 2.224, 95% CI: 1.141–3.306; P < 0.0001); pancreatic adenocarcinoma (HR = 1.729, 95% CI: 1.177–2.282; P < 0.0001); colorectal cancer (HR = 1.473, 95% CI: 0.968–1.979; P < 0.0001); lung cancer (HR = 2.026, 95% CI: 1.278–2.775; P < 0.0002), gallbladder carcinoma (HR = 3.363, 95% CI: 0.218–6.508; P = 0.036), esophageal squamous cell carcinoma (HR = 1.815, 95%CI: 0.779–2.85; P = 0.001). These results were partly consistent with the previous study reported by Xiu Chen et al, which found the correlation of GLUT-1 up-regulation and negative OS in pancreatic and gastric cancer but not in colorectal cancer [67]. Unfortunately, we could not gather information from the other 12 cancer types because only a single study was involved in each subgroup. The combined results of HR were significantly higher for studies those of patients undergoing surgery without preoperative treatment (no preoperative vs. preoperative therapy: HR = 1.911, 95%CI: 1.653–2.168; P < 0.0001). The pooled HRs were greater in studies with poor quality than in studies with better quality (HR = 1.916, 95% CI: 1.611–2.22; P < 0.0001). The results of studies with larger sample sizes were similar to those with smaller (≥ 150 vs. <150: HR 1.849, 95% CI: 1.559–2.14; P < 0.0001). The pooled HRs for both Western and Asian patients were also alike (Western vs. Asian: HR = 1.872, 95% CI: 1.54–2.204; P < 0.0001).
Meta-regression analysis revealed that region, sample size, type of cancer, treatment and quality score might contribute significantly to heterogeneity (P < 0.0001).
The prognostic significance of high GLUT-1 expression in DFS, RFS, PFS, DSS and MFS in human cancer
Overall analyses of the associations between high GLUT-1 expression and DFS, RFS, PFS, DSS and MFS were presented in Tables 2 and 3 [17–18, 20, 33, 35–36, 38–39, 41, 43, 49, 55–56, 59, 61, 64]. The elevated expression of GLUT-1 expression was found to be significantly correlated with poor DFS (Supplementary Figure 1), PFS and DSS, but neither MFS nor RFS. Statistically significant heterogeneity was observed across the studies for DFS, RFS, PFS, DSS and MFS (Tables 2 and 3). Cumulative meta-analysis of DFS and RFS revealed that all the HRs were quite stable (Figure 3B and 3C).
Table 2: Results of subgroup analysis of the association between GLUT-1 expression and DFS and RFS of multiple cancers
Subgroup analysis |
No. of studies |
No. of patients |
Pooled HR |
p value |
Meta regression (p-value) |
Heterogeneity |
|
|---|---|---|---|---|---|---|---|
I2 |
p-value (χ2) |
||||||
Disease-free survival |
7 |
1.838 [1.264–2.673] |
0.001 |
8.5% |
0.364 |
||
Region |
< 0.0001 |
||||||
Asian countries |
3 |
275 |
1.433 [0.529–2.337] |
0.002 |
0% |
0.966 |
|
Western countries |
4 |
688 |
1.714 [0.632–2.796] |
0.002 |
0% |
0.683 |
|
Sample size |
< 0.0001 |
||||||
< 100 |
2 |
95 |
1.042 [0.37–2.93] |
0.939 |
0% |
0.89 |
|
≥ 100 |
5 |
868 |
1.69 [0.902–2.477] |
< 0.0001 |
0% |
0.883 |
|
Type of cancer |
< 0.0001 |
||||||
Gynecologic oncology |
3 |
208 |
1.729 [0.821–3.64] |
0.149 |
0% |
0.38 |
|
NSCLC |
2 |
469 |
1.441 [0.491–2.391] |
0.003 |
0% |
0.747 |
|
Quality score |
< 0.0001 |
||||||
< 83 |
3 |
281 |
1.563 [0.468–2.659] |
0.005 |
0% |
0.598 |
|
≥ 83 |
4 |
682 |
1.539 [0.642–2.435] |
0.001 |
0% |
0.875 |
|
Recurrence-free survival |
4 |
391 |
1.63 [0.515–5.158] |
0.405 |
83.1% |
< 0.0001 |
|
Publication year |
< 0.0001 |
||||||
< 2010 |
2 |
249 |
0.486 [0.169–0.803] |
0.003 |
0% |
0.96 |
|
≥ 2010 |
2 |
142 |
2.181 [0.929–3.434] |
0.001 |
0% |
0.397 |
|
Sample size |
< 0.0001 |
||||||
< 100 |
2 |
142 |
0.486 [0.169–0.803] |
0.003 |
0% |
0.96 |
|
≥ 100 |
2 |
249 |
2.181 [0.929–3.434] |
0.001 |
0% |
0.397 |
|
Type of cancer |
|||||||
Rectal cancer |
2 |
147 |
4.107 [1.609–10.482] |
0.003 |
0% |
0.769 |
|
Quality score |
< 0.0001 |
||||||
< 83 |
2 |
249 |
2.181 [0.929–3.434] |
0.001 |
0% |
0.397 |
|
≥ 83 |
2 |
142 |
0.486 [0.169–0.803] |
0.003 |
0% |
0.96 |
|
DFS: disease-free survival; RFS: recurrence-free survival; HR: hazard ratio.
Table 3: Results of the meta-analysis of the association between GLUT-1 expression and PFS, DSS and MFS of multiple cancers
Meta-analysis |
No. of studies |
Cancer type |
No. of patients |
Pooled HR |
p value |
Heterogeneity |
|
|---|---|---|---|---|---|---|---|
I2 |
p-value (χ2) |
||||||
Progression-free survival |
2 |
Locally advanced cervical squamous cell carcinoma (LACSCC), epithelial ovarian carcinoma |
345 |
2.451 [1.668–3.233] |
< 0.0001 |
0% |
0.34 |
Disease specific survival |
3 |
Oral squamous cell carcinomas (OSCCs), NSCLC |
541 |
1.96 [1.05–2.871] |
< 0.0001 |
0% |
0.872 |
Metastasis-free survival |
2 |
Cervix carcinoma, rectal cancer |
97 |
0.491 [0.128–1.891] |
0.301 |
0% |
0.609 |
PFS: progression-free survival; DSS: disease specific survival; HR: hazard ratio.
The predictive role of GLUT-1 for DFS was significant for all subgroups except for studies of smaller size and patients with gynecologic system malignancy (Table 2). On the other hand, the correlation between GLUT-1 and RFS was significant in all subgroups (Table 2). We did not carry out subgroup analysis for PFS, DSS and MFS, due to the limited number of studies (two or three) on these outcomes.
Meta-regression analysis was performed for DFS, indicating that region, sample size, type of cancer and quality score were significantly responsible for the bias among studies. Also, meta-regression analysis was performed for RFS, demonstrating that the bias came from the publication year, sample size and quality score.
Analysis of sensitivity and publication bias
Chemoradiotherapy rather than surgery was given to patients in the study conducted by Jung A. Kim et al. (2011) [44]. Thus, we excluded this studies when reported a sensitivity analysis of OS, and our result was proven to be stable, but the exclusion of this report did not significantly alter the results (HR = 1.833, 95% CI: 1.597–2.069; P < 0.0001 and HR = 1.825, 95% CI: 1.588–2.061; P < 0.0001, respectively) (Supplementary Figure 2A). Similarly, the sensitivity analyses showed that the pooled HRs of DFS were reliable (Supplementary Figure 2B). In the sensitivity analysis of RFS, the report by Hiroyuki Mineta et al. (2002) affected the whole stability. We excluded this study and did meta-analysis again, the heterogeneity dropped from 59.1% to 0% (HR = 0.588, 95%CI: 0.281–0.895; P < 0.0001 and HR = 2.181, 95%CI: 0.929–3.434; P = 0.001, respectively) (Supplementary Figure 2C).
No significant publication bias was detected in for the meta-analysis of the association between GLUT-1 and OS, as indicated by Egger’s test (P = 0.058), Begg’s test (P = 0.101) and relatively symmetrical appearance of the funnel plot (Supplementary Table 2 and Supplementary Figure 3). Moreover, no evidence of publication bias was observed in the subgroups (Supplementary Table 2). Consistently, there was no evidence of publication bias for either DFS or RFS (DFS, P = 0.487 via Egger’s test and P = 0.368 via Begg’s test; RFS, P = 0.634 via Egger’s test and P = 1.000 via Begg’s test) (Supplementary Table 2).
DISCUSSION
This study aimed to disclose the prognostic value of GLUT-1 expression in cancer survival by examining the correlation between GLUT-1 and various survival measures. We found a reciprocal relationship between elevated GLUT-1 expression and OS, DFS, PFS and DSS, but neither MFS nor RFS. These results suggested that GLUT-1 might be an independent prognostic marker for diverse types of cancers.
We performed subgroup analysis and the results revealed that patients with high GLUT-1 expression were more likely to have poor OS in gastric cancer, urinary carcinoma, ovarian carcinoma, oral squamous cell carcinoma, pancreatic adenocarcinoma, colorectal cancer, lung cancer, gallbladder carcinoma, esophageal squamous cell carcinoma. Nevertheless, these positive results were only based on a relatively small number of studies (two to five), and for the other types of cancer, only one study was included. In a previous meta-analysis that analyzed eight independent studies comprising data from 921 patients [68], it was observed that the GLUT-1 overexpression was in connection with worse OS in oral squamous cell carcinoma (OSCC) (HR = 1.88, 95% CI: 1.51–2.33, P < 0.001), which was similar to our result (HR = 2.224, 95% CI: 1.141–3.306; P < 0.0001).
In the current study, subgroup analyses proved that patients with preoperative treatment had a significantly shorter OS than those without preoperative treatment. This finding might imply the intervening role of preoperative treatment in the association between GLUT-1 and cancer survival (owing to its survival disadvantages). Given this, we should take the preoperative treatment into account when applying GLUT-1 as a predictor to assess the OS in cancer patients. Further investigations should be conducted to verify our results, because the publication biases could be derived from the limited quantity of studies with preoperative treatment.
In addition, our results demonstrated that high GLUT-1 expression was more closely related to poor DFS in Western patients than in Asian populations, and similar significant predictive value was also seen in OS. In the light of higher quality paper, the results indicated that high GLUT-1 expression was neither associated with OS, nor with DFS. Moreover, our analysis of HRs were larger in large studies than in small studies. Thus, we might have disappreciated the prognostic significance of GLUT-1 in cancer survival, as a consequence of the inequality in the contribution of results from low-quality or relatively small studies. Similarly, the results revealed that the associations of GLUT-1 with PFS, DSS and MFS were based on only two or three studies. Therefore, the conclusions drawn from small sample size were not accurate and objective at present.
Meta-regression and sensitivity analyses did not affect the significant association of GLUT-1 with worse survival or reveal any significant sources of heterogeneity. Cumulative meta-analyses exhibited an insignificant trend towards increased hazard for OS, DFS or RFS over time. As a result, the analyses showed no significant publication bias, despite one or two articles reporting results that departed from the steady trend.
However, several limitations included in our study cannot be overlooked. Firstly, this study analyzed the prognostic values of GLUT-1 in diverse cancers, rather than a single specific type. This might generate remarkable bias due to different baseline characteristics of various cancer types. Secondly, cancer staging and the criteria for calculating GLUT-1 cut-off values were inconsistent across studies, and the definitions of outcome measures were not available in all reports. In the present study, we defined GLUT-1 expression greater than the corresponding cut-off values as high or positive, while other status as low or negative. This simple approach for classification might have introduced obvious heterogeneity. Thirdly, treatments other than surgery were involved in the enrolled patients, which may increase the baseline heterogeneity. Fourthly, there was inevitable bias in our analysis of the association between high GLUT-1 expression and OS, due to the lack of sufficient number of studies. Furthermore, studies reported in non-English language papers, unpublished studies, and conference abstracts were not included. Therefore, our results might overestimate the prognostic value of GLUT-1 in the prognosis of patients with cancer, owing to the incomplete data collection. Fifthly, we obtained five estimates by calculation and 20 by survival curve reconstruction rather than directly acquired data from the primary studies, leading to the inevitably considerable bias.
In conclusion, to the best of our knowledge, this was the first study on the prognostic value of GLUT-1 in diverse cancer types. Our meta-analysis revealed that GLUT-1 might be a significant predictor for OS, DFS, PFS and DSS in multiple types of cancer. Thus, it might serve as a novel effective biomarker for early diagnosis or prognostic prediction. However, the exact predicting role should be further confirmed in high-quality prospective clinical trails.
CONFLICTS OF INTEREST
The authors declare no competing interests in relation to the work described.
FUNDING
This study was funded by grants from National Natural Science Foundation for Distinguished Young Scholars of China (Grant No. 81403148), National Natural Science Foundation of China (Grant No. 81673916) and Development Project of Shanghai Peak Disciplines–Integrative Medicine (Grant No. 20150407).
REFERENCES
1. Warburg O. On the origin of cancer cells. Science. 1956; 24:309–14.
2. Mazurek S, Boschek CB, Hugo F, Eigenbrodt E. Pyruvate kinase type M2 and its role in tumor growth and spreading. Seminars in Cancer Biology. 2005; 15:300–08.
3. Smith TA. Facilitative glucose transporter expression in human cancer tissue. Br J Biomed Sci. 1999; 56:285–92.
4. Coy JF, Dressler D, Wilde J, Schubert P. Mutations in the transketolase-like gene TKTL1: clinical implications for neurodegenerative diseases, diabetes and cancer. Clinical Laboratory. 2005; 51:257–73.
5. Joost HG, Thorens B. The extended GLUT-family of sugar/polyol transport facilitators: nomenclature, sequence characteristics, and potential function of its novelmembers (review). MolMembr Biol. 2001; 18:247–256.
6. Pardridge WM, Boado RJ, Farrell CR. Brain-type glucose transporter (GLUT-1) is selectively localized to the blood–brain barrier. Studies with quantitative western blotting and in situ hybridization. J Biol Chem. 1990; 265:18035–40.
7. Zhao FQ, Keating AF. Functional properties and genomics of glucose transporters. Curr Genomics. 2007; 8:113–28.
8. Berlth F, Monig SP, Schlosser HA, Maus M, Baltin CT, Urbanski A, Drebber U, Bollschweiler E, Holscher AH, Alakus H. Validation of 2-mm tissue microarray technology in gastric cancer. Agreement of 2-mm TMAs and full sections for Glut-1 and Hif-1 alpha. Anticancer Res. 2014; 34:3313–20.
9. Kim S, Jung WH, Koo JS. The expression of Glut-1, CAIX, and MCT4 in mucinous carcinoma. J Breast Cancer. 2013; 16:146–51.
10. Mogi A, Koga K, Aoki M, Hamasaki M, Uesuqi N, Iwasaki A, Shirakusa T, Tamura K, Nabeshima K. Expression and role of GLUT-1, MCT-1, and MCT-4 in malignant pleural mesothelioma. Virchows Arch. 2013; 462:83–93.
11. Hussein YR, Bandyopadhyay S, Semaan A, Ahmed Q, Albashiti B, Jazaerly T, Nahleh Z, Ali-Fehmi R. Glut-1 expression correlates with basel-like breast cancer. Transl Oncol. 2011; 4:321–7.
12. Chiba I, Ogawa K, Morioka T, Shimoji H, Sunagawa N, Iraha S, Nishimaki T, Yoshimi N, Murayama S. Clinical significance of GLUT-1 expression in patients with esophageal cancer treated with concurrent chemoradiotherapy. Oncol Lett. 2011; 2:21–28.
13. Mayer A, Hockel M, Horn LC, Schmidberger H, Vaupel P. GLUT-1 staining of squamous cell carcinomas of the uterine cervix identifies a novel element of invasion. Int J Oncol. 2011; 38:145–50.
14. Wong KK, Engelman JA, Cantley LC. Targeting the PI3K signaling pathway in cancer. Curr Opin Genet Dev. 2010; 20:87–90.
15. Rastogi S, Banerjee S, Chellappan S, Simon GR. Glut-1 antibodies induce growth arrest and apoptosis in human cancer cell lines. Cancer Lett. 2007; 257:244–51.
16. Barron CC, Bilan PJ, Tsakiridis T, Tsiani E. Facilitative glucose transporters: implications for cancer detection, prognosis and treatment. Metabolism. 2016; 65:124–39.
17. Airley R, Loncaster J, Davidson S, Bromley M, Roberts S, Patterson A, Hunter R, Stratford I, West C. Glucose transporter Glut-1 expression correlates with tumor hypoxia and predicts metastasis-free survival in advanced carcinoma of the cervix. Clinical Cancer Research. 2001; 7:928–34.
18. Fenske W, Volker HU, Adam P, Hahner S, Johanssen S, Wortmann S, Schmidt M, Morcos M, Muller-Hermelin HK, Allolio B, Fassnacht M. Glucose transporter GLUT1 expression is an stage-independent predictor of clinical outcome in adrenocortical carcinoma. Endocrine-Related Cancer. 2009; 16:919–28.
19. Mori Y, Tsukinoki K, Yasuda M, Miyazawa M, Kaneko A, Watanabe Y. Glucose transporter type 1 expression are associated with poor prognosis in patients with salivary gland tumors. Oral Oncology. 2007; 43:563–69.
20. Cooper R, Sarioglu S, Sokmen S, Fuzun M, Kupelioglu A, Valentine H, Gorken IB, Airley R, West C. Glucose transporter-1 (GLUT-1): a potential marker of prognosis in rectal carcinoma? Br J Cancer. 2003; 89:870–76.
21. Ozbudak IH, Shilo K, Tavora F, Rassaei N, Chu WS, Fukuok J, Jen J, Travis WD, Franks TJ. Glucose transporter-1 in pulmonary neuroendocrine carcinomas: expression and survival analysis. Mod Pathol. 2009; 22:633–38.
22. Ayala FR, Rocha RM, Carvalho KC, Carvalho AL, da Cunha IW, Lourenco SV, Soares FA. Glut1 and Glut3 as potential prognostic markers for oral squamous cell carcinoma. Molecules. 2010; 15:2374–87.
23. McShane LM, Altman DG, Sauerbrei W, Taube SE, Gion M, Clark GM. Reporting recommendation for tumor marker prognostic studies (REMARK). Breast Cancer Res Treat. 2006; 100:229–35.
24. Altman DG, McShane LM, Sauerbrei W, Taube SE. Reporting recommendation for tumor marker prognostic studies (REMARK): explanation and elaboration. PLoS Med. 2012; 9:e1001216.
25. Steels E, Paesmans M, Berghmans T, Branle F, Lemaitre F, Mascaux C, Meert AP, Vallot F, Lafitte JJ, Sculier JP. Role of p53 as a prognostic factor for survival in lung cancer: a systematic review of the literature with a meta-analysis. Eur Respir J. 2001; 18:705–19.
26. Xing X, Tang YB, Yuan G, Wang Y, Wang J, Yang Y, Chen M. The prognostic value of E-cadherin in gastric cancer: a meta-analysis. Int J Cancer. 2013; 132:2589–96.
27. Parmar MK, Torri V, Stewart L. Extracting summary statistics to perform meta-analyses of the published literature for survival endpoints. Stat Med. 1998; 17:2815–34.
28. Tierney JF, Stewart LA, Ghersi D, Burdett S, Sydes MR. Practical methods for incorporating summary time-to-event data into meta-analysis. Trials. 2007; 8:16.
29. Higgins JP, Thompson SG, Deeks JJ, Altman DG. Measuring inconsistency in meta-analyses. BMJ. 2003; 327:557–560.
30. Egger M, Davey SG, Schneider M, Minder C. Bias in meta-analysis detected by a simple, graphical test. BMJ. 1997; 315:629–34.
31. Begg CB, Mazumdar M. Operating characteristics of a rank correlation test for publication bias. Biometrics. 1994; 50:1088–1101.
32. Jung JH, Im S, Jung ES, Kang CS. Clinicopathological implications of the expression of hypoxia-related proteins in gastric cancer. Int J Med Sci. 2013; 10:1217–23.
33. Huang XQ, Chen X, Xie XX, Zhou Q, Li K, Li S, Shen LF, Su J. Co-expression of CD147 and GLUT-1 indicates radiation resistance and poor prognosis in cervical squamous cell carcinoma. Int J Clin Exp Pathol. 2014; 7:1651–1666.
34. Eckert AW, Lautner MH, Schutze A, Taubert H, Schubert J, Bilkenroth U. Coexpression of hypoxia-inducible factor-1α and Glucose transporter-1 is associated with poor prognosis in oral squmous cell carcinoma patients. Histopathology. 2011; 58:1136–47.
35. Andersen S, Eilertsen M, Donnem T, AI-Shibi K, AI-Saad S, Busund LT, Bremnes RM. Diverging prognostic impacts of hypoxic markers according to NSCLC histology. Lung Cancer. 2011; 72:294–302.
36. Kubo T, Shimose S, Fujimori J, Furuta T, Arihiro K, Ochi M. Does expression of glucose transporter protein-1 relate to prognosis and angiogenesis in osteosarcoma? Clin Orthop Relat Res. 2015; 473:305–310.
37. Legan M, Luzar B, Marolt VF. Expression of cyclooxygenase-2, Glucose transporter-1 and angiogenesis in gallbladder carcinomas and their impact on prognosis. Scand J Gastroenterol. 2009; 44:1101–8.
38. Semaan A, Munkarah AR, Arabi H, Bandyopadhyay S, Seward S, Kumar S, Qazi A, Hussein Y, Morris RT, Ali-Fehmi R. Expression of GLUT-1 in epithelial ovarian carcinoma: correlation with tumor cell proliferation, angiogenesis, survival and ability to predict optimal cytoreduction. Gynecol Oncol. 2011; 121:181-6.
39. Eckert AW, Lautner MH, Taubert H, Schubert J, Bilkenroth U. Expression of Glut-1 is a prognostic marker for oral squamous cell carcinoma patients. Oncol Rep. 2008; 20:1381–85.
40. Sun HC, Qiu ZJ, Liu J, Sun J, Jiang T, Huang KJ, Yao M, Huang C. Expression of hypoxia-inducible factor-1 alpha and associated proteins in pancreatic ductal adenocarcinoma and their impact on prognosis. Int J Oncol. 2007; 30:1359–67.
41. Shim BY, Jung JH, Lee KM, Kim HJ, Hong SH, Kim SH, Sun DS, Cho HM. Glucose transporter 1 (GLUT1) of anaerobic glycolysis as predictive and prognostic values in neoadjuvant chemoradiotherapy and laparoscopic surgery for locally advanced rectal cancer. Int J Colorectal Dis. 2013; 28:375–83.
42. Ramani P, Headford A, May MT. GLUT1 protein expression correlates with unfavourable histologic category and high risk in patients with neuroblastic tumours. Virchows Arch. 2013; 462:203–9.
43. Sawayama H, Ishimoto T, Watanabe M, Yoshida N, Baba Y, Sugihara H, Izumi D, Kurashige J, Baba H. High expression of glucose transporter 1 on primary lesions of esophageal squamous cell carcinoma is associated with hematogenous recurrence. Ann Surg Oncol. 2014; 21:1756–62.
44. Kim JA, Kim SJ, Do IG, Jin J, Nam DH, Ko YH, Kim K, Kim WS. Hypoxia-associated protein expression in primary central nervous system diffuse large B-cell lymphoma: does it predict prognosis? Leuk Lymphoma. 2011; 52:205–13.
45. Kitasato Y, Yasunaga M, Okuda K, Kinoshita H, Tanaka H, Okabe Y, Kawahara A, Kage M, Kaida H, Ishibashi M. Maximum standardized uptake value on 18F-Fluoro-2-Deoxy-Glucose position emission tomography/computed tomography and Glucose transporter-1 expression correlates with survival in invasive ductal carcinoma of the pancreas. Pancreas. 2014; 43:1060–5.
46. Tohma T, Okazumi S, Makino H, Cho A, Mochizuki R, Shuto K, Kudo H, Matsubara K, Gunji H, Marsubara H, Ochiai T. Overexpression of glucose transporter 1 in esophageal squamous cell carcinomas: a marker for poor prognosis. Dis Esophagus. 2005; 18:185–9.
47. Kunkel M, Moergel M, Stockinger M, Jeong JH, Fritz G, Lehr HA, Whiteside TL. Overexpression of GLUT-1 is associated with resistance to radiotherapy and adverse prognosis in squamous cell carcinoma of the oral cavity. Oral Oncol. 2007; 43:796–803.
48. Havelund BM, Sorensen FB, Lindebjerg J, Spindler KL, Jakobsen A. Pretreatment HIF-1α and GLUT-1 expressions do not correlate with outcome after preoperative chemoradiotherapy in rectal cancer. Anticancer Res. 2011; 31:1559–65.
49. Osugi J, Yamaura T, Muto S, Okabe N, Matsumura Y, Hoshino M, Higuchi M, Suzuki H, Gotoh M. Prognostic impact of the combination of glucose transporter 1 and ATP citrate lyase in node-negative patients with non-small lung cancer. Lung Cancer. 2015; 88:310–8.
50. Endo M, Tateishi U, Seki K, Yamaguchi U, Nakatani F, Kawai A, Chuman H, Beppu Y. Prognostic implications of glucose transporter protein-1 (Glut-1) overexpression in bone and soft-tissue sarcomas. Jpn J Clin Oncol. 2007; 37:955–60.
51. Cho H, Lee YS, Kim J, Chung JY, Kim JH. Overexpression of Glucose transporter-1 (GLUT-1) predicts poor prognosis in epithelial ovarian cancer. Cancer Invest. 2013; 31:607–15.
52. Kunkel M, Reichert TE, Benz P, Lehr HA, Jeong JH, Wieand S, Bartenstein P, Wagner W, Whiteside TL. Overexpression of Glut-1 and increased glucose metabolism in tumors are associated with a poor prognosis in patients with oral squamous cell carcinoma. Cancer. 2003; 97:1015–24.
53. Davis-Yadley AH, Abbott AM, Pimiento JM, Chen DT, Malafa MP. Increased expression of the glucose transporter type 1 gene is associated with worse overall survival in resected pancreatic adenocarcinoma. Pancreas. 2016; 45:974–9.
54. Goos JA, de Cuba EM, Coupe VM, Diosdado B, Delis-Van Diemen PM, Karga C, Belien JA, Menke-Van der Houven van Oordt CW, Geldof AA, Meijer GA, Hoekstra OS, Fijneman RJ. Glucose transporter 1 (SLC2A1) and vascular endothelial growth factor A (VEGFA) predict survival after resection of colorectal cancer liver metastasis. Ann Surg. 2015; 00:1–8.
55. Hong DG, Park NY, Chong GO, Cho YL, Park IS, Jeong MJ, Park JY, Lee YS. The correlation between expression of synuclein-γ, Glucose transporter-1, and survival outcomes in endometrioid endometrial carcinoma. Eur J Gynaec Oncol. 2013; 2:128–131.
56. Meijer TW, Schuurbiers OC, Kaanders JH, Looijen-Salamon MG, de Geus-Oei LF, Verhagen AF, Lok J, van der Heijden HF, Rademakers SE, Span PN, Bussink J. Differences in metabolism between adeno- and squamous cell non-small cell lung carcinomas: spatial distribution and prognostic value of GLUT1 and MCT4. Lung Cancer. 2012; 76:316–23.
57. Lyshchik A, Higashi T, Hara T, Nakamoto Y, Fujimoto K, Doi R, Imamura M, Saga T, Togashi K. Expression of Glucose transporter-1, hexokinase-II, proliferating cell nuclear antigen and survival of patients with pancreatic cancer. Cancer Invest. 2007; 25:154–62.
58. Pizzi S, Porzionato A, Pasquali C, Guidolin D, Sperti C, Fogar P, Macchi V, De Caro R, Pedrazzoli S, Parenti A. Glucose transporter-1 expression and prognostic significance in pancreatic carcinogenesis. Histol Histopathol. 2009; 24:175–85.
59. Cantuaria G, Fagotti A, Ferrandina G, Magalhaes A, Nadji M, Angioli R, Penalver M, Mancuso S, Scambia G. GLUT-1 expression in ovarian carcinoma: association with survival and response to chemotherapy. Cancer. 2001; 92:1144–50.
60. Kawamura T, Kusakabe T, Sugino T, Watanabe K, Fukuda T, Nashimoto A, Honma K, Suzuki T. Expression of Glucose transporter-1 in human gastric carcinoma: association with tumor aggressiveness, metastasis and patient survival. Cancer. 2001; 92:634–41.
61. Kang SS, Chun YK, Hur MH, Lee HK, Kim YJ, Hong SR, Lee JH, Lee SG, Park YK. Clinical significance of glucose transporter 1 (GLUT1) expression in human breast carcinoma. Jpn J Cancer Res. 2002; 93:1123–8.
62. Haber RS, Rathan A, Weiser KR, Pritsker A, Itzkowitz SH, Bodian C, Slater G, Weiss A, Burstein DE. GLUT1 glucose transporter expression in colorectal carcinoma: a marker for poor prognosis. Cancer. 1998; 83:34–40.
63. Younes M, Juarez D, Lechago LV, Lerner SP. Glut1 expression in transitional cell carcinoma of the urinary bladder is associated with poor patient survival. Anticancer Res. 2001; 21:575–8.
64. Mineta H, Miura K, Takebayashi S, Misawa K, Araki K, Misawa Y, Ueda Y. Prognostic value of glucose transporter 1 expression in patients with hypopharyngeal carcinoma. Anticancer Res. 2002; 22:3489–94.
65. Kim YW, Park YK, Yoon TY, Lee SM. Expression of the GLUT1 glucose transporter in gallbladder carcinomas. Hepato-Gastroenterol. 2002; 49:907–11.
66. Kato H, Takita J, Miyazaki T, Nakajima M, Fukai Y, Masuda N, Fukuchi M, Manda R, Ojima H, Tsukada K, Kuwano H. Glut-1 glucose transporter expression in esophageal squamous cell carcinoma is associated with tumor aggressiveness. Anticancer Res. 2002; 22:2635–40.
67. Chen X, Lu P, Zhou S, Zhang L, Zhao JH, Tang JH. Predictive value of Glucose transporter-1 and glucose transporter-3 for survival of cancer patients: A meta-analysis. Oncotarget. 2017; 8:13206–13213. https://doi.org/10.18632/oncotarget.14570.
68. Li CX, Sun JL, Gong ZC, Lin ZQ, Liu H. Pronostic value of GLUT-1 expression in oral squamous cell carcinoma. Medicine. 2016; 95:45–52.