
INTRODUCTION
EGFR tyrosine kinase inhibitor (EGFR TKI) therapies have shown to be of great benefit to non-small cell lung cancer (NSCLC) patients harboring EGFR activating mutations, such as L858R and exon 19 deletions [1, 2]. However, most patients develop drug resistance one or two years after first-generation EGFR TKI treatment, and the T790M mutation accounts for over half of acquired resistance cases [3, 4, 5]. Since the third generation EGFI-TKI AZD9291 (Osimertinib) is highly effective in NSCLC patients with EGFR T790M mutation and has been approved by the US FDA [6, 7, 8], it is recommended that tumor tissue biopsy results be obtained to assess EGFR mutation status so that those patients can receive the appropriate treatment.
Tumor biopsy is usually used as the gold standard for detecting gene mutation. However, it might not supply a sufficient amount of tumor tissue for mutation analysis, and meanwhile, invasive intervention may be risky and discomforting for patients, especially in those who need serial biopsy to monitor treatment response or recurrence. Moreover, the gene mutations in a single tumor biopsy may not represent the overall gene mutation profiles of a patient with heterogeneous cancer or multiple metastases [9, 10]. Recently, circulating tumor DNA (ctDNA) has emerged as an alternative DNA source for detecting EGFR mutations. Several studies have demonstrated that the EGFR mutations detected in plasma ctDNA are highly concordant with those detected in the tumor tissue of patients [11, 12, 13], indicating that ctDNA in plasma can serve as an alternative to tissue biopsy. Although ctDNA has shown a great potential for clinical application, the amount of ctDNA appears to be very low, and the mutation abundance in ctDNA is lower than that in tumor tissue [14, 15, 16]. Therefore, a highly sensitive method with a low detection limit is required to provide precise and valuable mutation information for clinical decision-making [17].
Several methods for assessing EGFR mutation in NSCLC have been developed, such as the conventional Scorpion amplification refractory mutation system (ARMS), next-generation sequencing (NGS) and digital PCR. Both ARMS PCR and NGS have been widely used in clinical laboratories, but they have been challenged on the accuracy of detecting low mutation allele frequencies [18]. Digital PCR is a promising new technique that can provide an absolute quantification of gene mutations, without any external calibrators, and the greatest strength of digital PCR is its ability to identify mutation allele frequencies as low as 0.1%.
In the current study, we evaluated the outperformance of digital PCR in the identification of low frequency EGFR L858R, T790M and exon 19 deletion mutations in tumor tissue samples from advanced lung adenocarcinoma patients through comparison with those detected using Ion AmpliSeq Cancer Hotspot Panel V2 (Thermo Fisher Scientific, Waltham, MA) and ARMS PCR. To evaluate its performance in ctDNA mutation detection and analyze the relationship between the mutation abundances of tumor tissue and ctDNA, which might provide a clinical reference, we assessed the consistency between the mutation detection of tumor tissue and the mutation detection of ctDNA using the digital PCR platform and analyzed the cutoff value of tumor tissue mutation abundance that could detect mutation in the corresponding ctDNA.
RESULTS
Patient characteristics and sample collection
A total of forty-seven patients diagnosed with NSCLC adenocarcinoma were enrolled in this study. The patient cohort was composed of 21 females (44.68%) and 26 males (55.32%). The majority of patients were stage IV (36, 76.60%), with 6 (12.77%) patients being stage IIIB and 5 (10.64%) patients being stage IIIA. Forty-two patients were EGFR TKI treatment naive, while the other 5 patients experienced disease progression after first generation EGFR TKI treatment. The patient characteristics and sample types are presented in Table 1, and a full summary of patient characteristics and gene mutations in matched tumor tissue DNA and ctDNA detected by three platforms is presented in Figure 1 and Supplementary Table 1.
Table 1: Clinical features of 47 patients with non-small cell lung cancer
Characteristics |
Number (%) |
|---|---|
Sex |
|
Male |
21 (44.68%) |
Female |
26 (55.32%) |
Tumor stage |
|
IIIA |
6 (12.77%) |
IIIB |
5 (10.64% ) |
IV |
36 (76.60%) |
EGFR-TKIs treatment history |
|
EGFR-TKIs naïve patients |
42 (89.36%) |
EGFR-TKIs experienced patients |
5 (10.64%) |
Sample type |
|
Tumor tissue |
42 (89.36%) |
Pleural effusion |
6 (12.77%) |
Plasma |
47 (100%) |
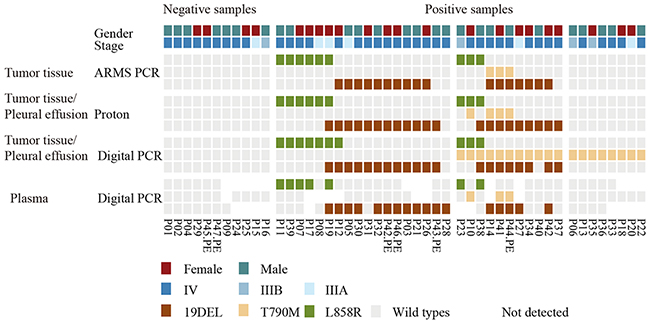
Figure 1: EGFR mutations detected by three platforms using tumor tissue and plasma samples. A heatmap representation of mutations detected from paired tumor tissue/pleural effusion and plasma samples, which were collected from 47 patients. The sample types and platforms used are shown in the left column. Forty-seven tumor tissue samples were detected using ARMS PCR, while 42 tumor samples and 6 pleural effusion samples were detected using Proton and the digital PCR platform. Patients with tumor tissue samples in ARMS PCR, but with pleural effusion samples in Proton and digital PCR were marked with the symbol “PE”. P42 had both tumor tissue and pleural effusion samples detected in Proton and digital PCR. Forty-seven paired plasma samples were detected using digital PCR only. The top two rows show patients’ gender and clinical stage, the upper middle three rows show tumor tissue samples tested by ARMS PCR, the middle six rows show tumor tissue or pleural effusion samples tested by Proton and digital PCR, and the bottom three rows show plasma samples tested by digital PCR only. Mutation events are represented by different colors, e.g., L858R by green, T790M by yellow, 19del by brown, and wild-type mutations by gray. The sites of ctDNA that were not detected are shown as blank.
Platform comparison of EGFR mutation detection in tumor tissue
We first compared the performance of three platforms in their abilities to detect mutations in tumor tissue. Using ARMS PCR results as the gold standard, high sensitivity was observed for both Proton and digital PCR, which had sensitivities of 100.00% (25/25) and 96.00% (24/25), respectively. However, digital PCR failed to detect one exon 19 deletion (Table 2). The mutation patterns of tumor tissue classified by the three platforms were different. ARMS PCR showed that 48.94% (23/47) of the patients harbored activating mutations, 6.38% (3/47) had a co-occurrence of activating mutations and the T790M mutation, and zero had only the T790M mutation. For the Proton platform, 50.00% (21/42) of the patients harbored activating mutations, 7.14% (3/42) had the T790M mutation plus activating mutations, and zero had only the T790M mutation. However, digital PCR detected activating mutations in 33.33% (14/42) of the patients, a co-occurrence of activating mutations and the T790M mutation in 21.43% (9/42), and only the T790M mutation in 21.43% (9/42). These results indicated that digital PCR could identify more gene mutations and thus provides more information for clinical decision-making (Figure 2; Supplementary Table 2).
Table 2: Performance of Proton and Digital PCR for detecting of EGFR mutation from tumor tissue DNA compared with ARMS PCR
EGFR mutation |
ARMS |
Proton |
Performance of Proton |
Digital PCR |
Performance of Digital PCR |
||||||
|---|---|---|---|---|---|---|---|---|---|---|---|
Positive |
Negative |
Sensitivity (%) |
Specificity (%) |
Concordance (%) |
Positive |
Negative |
Sensitivity (%) |
Specificity (%) |
Concordance (%) |
||
L858R |
Positive |
9 |
0 |
100% |
100% |
100% |
9 |
0 |
100% |
96.97% |
97.62% |
Negative |
0 |
33 |
1 |
32 |
|||||||
19 DEL |
Positive |
14 |
0 |
100% |
89.29% |
92.86% |
13 |
1 |
92.86% |
89.29% |
90.48% |
Negative |
3 |
25 |
3 |
25 |
|||||||
T790M |
Positive |
2 |
0 |
100% |
97.50% |
97.62% |
2 |
0 |
100% |
60.00% |
61.90% |
Negative |
1 |
39 |
16 |
24 |
|||||||
Total* |
Positive |
25 |
0 |
100% |
94.17% |
96.83% |
24 |
1 |
96.00% |
80.20% |
83.33% |
Negative |
4 |
97 |
20 |
81 |
|||||||
*. Comparison of Proton/ Digital PCR with ARMS PCR was based on 42 tumor biopsies all tested in three platforms. Each EGFR mutation type had 42 sites’ result, the sensitivity and specificity were counted take site as unit.
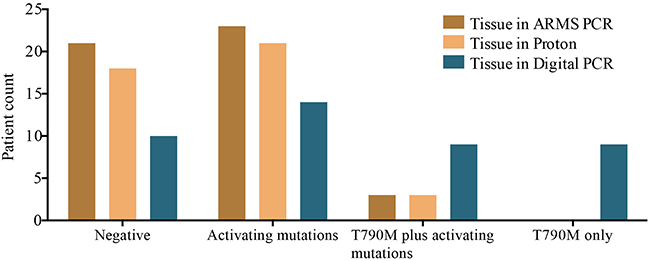
Figure 2: Classification of patients by EGFR mutation status identified by three platforms. The x-axis is classified into four groups: no mutations detected, either L858R or exon 19 deletions or double mutants, referred to as activating mutations, T790M plus activating mutations, and T790M mutation only. The y-axis shows patient counts according to different mutation patterns detected in the three platforms.
Since the digital PCR was shown to be discordant with AMRS PCR and Proton, we next compared the difference in EGFR mutation abundance between Proton and digital PCR. Compared with Proton, digital PCR had a higher sensitivity, with results of 100%, 94.12% and 100.00% for L858R, exon 19 deletions and T790M mutations, respectively (Table 3). Of the seventeen discordant mutations (Supplementary Table 3), one L858R positive mutation in digital PCR was determined as negative in Proton, and digital PCR missed an exon 19 deletion mutation that was identified by Proton with an abundance of 2.91%. The other fifteen T790M mutations were identified by digital PCR only and had mutation frequencies that ranged from 0.10% to 0.32%. Overall, digital PCR was more sensitive than ARMS PCR and Proton in detecting EGFR mutations, especially in the detection of low abundance T790M mutations.
Table 3: Concordance between Digital PCR and Proton for detection of EGFR mutations from tumor tissue DNA
Mutation type |
Proton |
Digital PCR |
Performance of Digital PCR |
|||
|---|---|---|---|---|---|---|
Positive |
Negative |
Sensitivity (%) |
Specificity (%) |
Concordance (%) |
||
L858R |
Positive |
9 |
0 |
100% |
96.97% |
97.62% |
Negative |
1 |
32 |
||||
19 DEL |
Positive |
16 |
1 |
94.12% |
100% |
97.62% |
Negative |
0 |
25 |
||||
T790M |
Positive |
3 |
0 |
100% |
61.54% |
64.29% |
Negative |
15 |
24 |
||||
Total |
Positive |
28 |
1 |
96.55% |
83.51% |
86.51% |
Negative |
16 |
81 |
||||
The comparison was limited in a total of 42 tumor tissue samples detected using Proton and Digital PCR.
Concordance of EGFR mutation detection in plasma and tissue
Due to having an insufficient amount of ctDNA to analyze all of the gene mutations (L858R, T790M and exon 19 deletion mutations) in each patient, we performed a total of 111 EGFR mutation (L858R: 35; T790M: 39; exon 19 deletions: 37) in 47 plasma samples by digital PCR. Compared with ARMS PCR in the detection of mutations in tumor tissue, 91.89% (102/111) of the sites were fully concordant, with twenty-three being positively concordant and seventy-nine being negatively concordant. The remaining 8.11% (9/111) of the sites were discordant, with five of them being detected in only tumor tissue and four being detected in only plasma ctDNA. Importantly, three of the four positive sites that were detected in only the ctDNA were validated in Proton or digital PCR tumor tissue. Benchmarking against the ARMS PCR tumor tissue results, which was used as the gold standard, the sensitivity and concordance rates for plasma mutation detection by digital PCR were 77.78% and 94.29%, respectively, for the L858R mutation, 82.35% and 83.38%, respectively, for the exon 19 deletion, and 100.00% and 97.44%, respectively, for the T790M mutation. The overall sensitivity, specificity and concordance were 82.14%, 95.18% and 91.89%, respectively (Table 4). ctDNA detection using digital PCR showed a high concordance with ARMS PCR.
Table 4: Concordance of EGFR mutation between tumor tissue detected using ARMS PCR and plasma detected using digital PCR
Mutation type |
Tumor tissue |
Plasma |
Performance of plasma |
|||
|---|---|---|---|---|---|---|
Positive |
Negative |
Sensitivity (%) |
Specificity (%) |
Concordance (%) |
||
L858R |
Positive |
7 |
2 |
77.78% |
100.00% |
94.29% |
Negative |
0 |
26 |
||||
19 del |
Positive |
14 |
3 |
82.35% |
85.00% |
83.38% |
Negative |
3 |
17 |
||||
T790M |
Positive |
2 |
0 |
100.00% |
97.30% |
97.44% |
Negative |
1 |
36 |
||||
Total* |
Positive |
23 |
5 |
82.14% |
95.18% |
91.89% |
Negative |
4 |
79 |
||||
*. Total was counted by three EGFR mutation types.
To further evaluate the detection performance of digital PCR for ctDNA and analyze the relationship between mutation abundance in tumor tissue and mutation abundance in ctDNA, we compared the consistence between tumor tissue and ctDNA in the digital PCR platform. To eliminate the confusion from sample types, ctDNA mutation detection was compared with genomic DNA (gDNA) detection in tumor tissue and pleural effusion separately. ctDNA identified all of the mutation types detected in pleural effusion. However, the detection rate varied for different mutation abundance levels between tumor tissue gDNA and ctDNA. The detection rates of plasma, compared to paired tumor tissue, were 3.03% when tumor tissue abundance was below 0.1%, 66.67% when tumor tissue abundance was between 0.5% and 1%, 50.00% when tumor tissue abundance was between 1% and 5%, and 87.50% when tumor tissue abundance was above 5% (Table 5). Of the twenty-two discordant mutations (Supplementary Table 4), fourteen of the T790M mutations that were negative in ctDNA were positive in tumor tissue, with a frequency below 0.32%. The others were three L858R and five exon 19 deletion mutations. The mutation abundance distribution of tumor tissue was higher than that of the paired ctDNA, and it appeared that the use of ctDNA could not identify mutations when the mutation abundance was very low in the paired tumor tissue (Figure 3). We further compared the relationship between the mutations identified in both tumor tissue and plasma. The Wilcoxon matched-pairs signed-rank test showed that there was a statistically significant difference between the abundance distributions in the two sample types (P<0.0001), and the Spearman’s rank correlation coefficient showed them to have a positive correlation, with an R2 value of 0.6274 (P< 0.0001). We further evaluated the detection sensitivity and specificity of plasma mutations obtained using digital PCR by comparing them with the mutation abundance in tumor tissue or pleural effusion samples. We performed receiver operator characteristic curve (ROC) analysis to evaluate the relationship between the mutation abundance in tumor tissue and the corresponding mutation status in plasma and achieved an area under the curve (AUC) value of 0.8352 (Z=0.1408, P=0.0091). With the optimal sensitivity and specificity being 85.19% and 85.00%, respectively, the cut-off value for the mutation abundance in tumor tissue was determined to be 3.81% (Figure 4; Supplementary Table 5). The interpretation of this is that when the mutation abundance in tumor tissue is lower than 3.81%, it is difficult to detect the corresponding mutation in plasma.
Table 5: Detection rate of plasma according to tumor tissue abundance
Tumor tissue abundance |
Plasma |
Performance of Plasma |
|
|---|---|---|---|
Negative |
Positive |
Detection rate (%) |
|
MAF<0.1% |
64 |
2 |
3.03% (2/66) |
0.1%<=MAF<0.5% |
10 |
0 |
0.00% (0/10) |
0.5%<=MAF<1% |
1 |
2 |
66.67% (2/3) |
1%<=MAF<5% |
2 |
2 |
50.00% (2/4) |
MAF>=5% |
3 |
21 |
87.50% (21/24) |
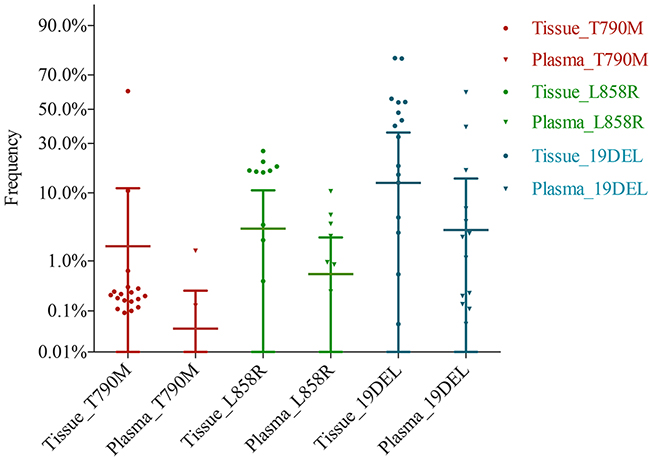
Figure 3: EGFR mutation frequency distribution of paired tumor tissue and plasma. gDNA and ctDNA were detected in the digital PCR platform, and the frequency of tumor tissue is shown as a dot symbol, while the frequency of plasma is shown as a triangle symbol. Mutation types are shown by different colors. The frequency of plasma was lower than that of tumor tissue, and plasma did not detect a few positive sites in tumor tissue.
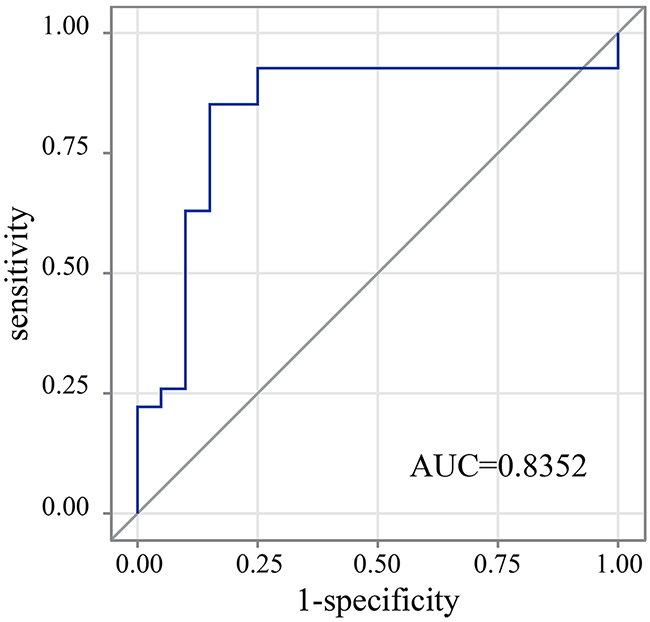
Figure 4: ROC analysis of plasma sample detection from tumor tissue mutation positive samples. The AUC value is 0.8352, which is significant, with a P value of 0.0091. The cut-off value = max (sensitivity + specificity -1). The figure also shows a maximum sensitivity and specificity of 85.19% and 85.00%, respectively.
DISCUSSION
In this study, we have demonstrated that digital PCR is a low detection limit method for detecting low abundance mutations in tumor tissue and ctDNA based on the following results: (1) digital PCR had a higher detection rate of EGFR mutations than ARMS PCR or Proton, (2) digital PCR outperformed Proton in the detection of low abundance mutations, and (3) ctDNA mutations detected by digital PCR had a high rate of concordance with tumor tissue mutations detected by ARMS PCR. We also have shown that the use of digital PCR can achieve a high sensitivity for identifying mutations in ctDNA when the mutation abundance in paired tumor tissue DNA is above 3.81%.
A high sensitivity method with a low detection limit may increase the mutation detection rate in patients with low abundance T790M mutation. In this study, the EGFR T790M mutation detection rate in tumor tissue obtained by digital PCR was 42.86% (18/42). This detection rate was lower than that of droplet digital PCR (ddPCR), which was 79.9% in tumor tissue, and our lower T790M detection rate might be partly due to the 30 ng DNA input, as ddPCR required at least 50-100 ng DNA input to ensure the sensitivity to detect a mutation abundance as low as 0.009% [19]. DNA input might influence mutation detection because decreasing the DNA input would lead to a declined sensitivity [20]. Unlike Proton, which has a low detection limit of 1% that is subject to background noise levels [21], digital PCR provides a linear response to the number of target DNA copies and thus allows the precise measurement of the target concentration. The DNA sample is partitioned in digital PCR so that individual DNA molecules within the sample are divided into many separate regions, and DNA molecules are then quantified by counting the regions containing positive reactions after PCR [22]. A previous study has demonstrated that patients who harbored low abundance of active EGFR mutation might benefit less from EGFR-TKI therapy [16], however, for the EGFR T790M mutation, the detection of low abundance may relate to clinical practice. As we know, EGFR T790M mutation was an independent predictor of decreased progression-free survival (PFS) in patients with NSCLC who received TKI treatment [23], pre-existing EGFR T790M clones may induce early EGFR T790M-acquired resistance [24]. Therefore, low limit detection may help identify patients with resistance mutation in advance so that they can obtain more opportunities to prevent or overcome resistance in the clinic.
Circulating tumor DNA can be used for mutation detection in clinical practice, tumor burden monitoring, and dynamic surveillance to overcome difficulties of re-biopsy and tumor heterogeneity. Several studies had confirmed that EGFR mutations in NSCLC could be detected in ctDNA, and a meta-analysis reported that ctDNA offered 62.00% sensitivity and 95.90% specificity compared with tumor tissue DNA among the Asian population [12]. In the current study, the sensitivity and specificity of ctDNA detected by digital PCR were 82.14% and 95.18%, respectively, compared with tumor tissue detected by ARMS PCR. The use of digital PCR facilitated the mutation detection rate in ctDNA. However, the ctDNA gained a sensitivity of 55.32% compared with the tumor tissue DNA in the digital PCR platform, the concordance rate between tumor tissue and ctDNA was very low at a low mutation level abundance in tumor tissue, and the mutation abundance distribution range in ctDNA (interquartile range of 1.50% to 6.37%) was lower than that in paired tumor tissue DNA (interquartile range of 19.34% to 51.35%). This general observed trend was consistent with other oncogenic advanced studies that focused on NSCLC patients with advanced disease [15], which suggests that the reason might be that the mutated allele was too low in some tumor tissues, and once released into plasma, ctDNA was further diluted and thus became undetectable. Next, we used the ROC to explore the relationship of mutation abundance between ctDNA and tumor tissue. This showed that with the cutoff of 3.81% mutation abundance in tumor tissue, mutation status in paired ctDNA could be identified with optimized sensitivity and specificity (85.19% and 85.00%, respectively). This result suggested that when the frequency in tumor tissue was higher than 3.81%, a higher possibility to identify EGFR mutation in plasma by digital PCR would exist; otherwise, it might become undetectable.
Understanding the detection limit of ctDNA may inform strategies for dynamic surveillance and targeted therapy. For example, mutations detected in ctDNA were related to mutations in tumor tissue with an abundance higher than 3.81%. Since a previous study reported that T790M abundance was 2.0% in a post-therapy sample taken after clinical relapse [25] and the risk of disease progression after EGFR-TKI therapy in NSCLC patients began to increase while the T790M mutation abundance was at 3.2% [26], we recommended that once mutations are detected in ctDNA, patients should consider taking the targeted therapy to gain the greatest benefit. However, for those negative for mutations in ctDNA, it is still unclear whether the undetected reason was due to no mutation or a low abundance of mutations. In this case, patients could further confirm their gene mutation status by tissue biopsy or long-term plasma monitoring. The current study has demonstrated that digital PCR outperformed in the detection of low abundance mutations, so we suggest that digital PCR could be used as a high-sensitivity platform to overcome the low detection rate of ctDNA compared with tumor tissue. Overall, the relationship of mutation abundance between tumor tissue and ctDNA needs further investigation, but lower detection limit methods may be useful for a more detailed assessment of mutant allelic levels and a potential correlation with clinical response.
MATERIALS AND METHODS
Ethical compliance
The patient information and clinical samples were obtained from the First Affiliated Hospital of SunYat-sen University. The sample collection and preparation protocols were approved by the SunYat-sen Hospital Ethics Committee. All of the patients provided written informed consent and consented to gene analysis prior to being included in this study.
Patient enrollment and sample collection
Forty-seven patients from the First Affiliated Hospital of SunYat-sen University were enrolled based on the following inclusion criteria: 1) patients with a diagnosis of stage III or IV NSCLC, 2) patients with a histological type of adenocarcinoma, and 3) treatment naïve patients or those who experienced disease progression after first-generation EGFR-TKI therapy at least one week prior to enrolling in the study. Furthermore, tumor tissue/pleural effusion and plasma samples were collected from the patients under the following procedure: 1) either matched tissue and plasma samples were collected at the time of surgery or plasma samples were collected before tissue samples by no more than one week [27]; 2) surgical tumor tissue was fixed in 10% buffered formalin as quickly as possible after surgical removal, then embedded in paraffin blocks and sectioned; 3) to obtain enough genomic DNA yields, 4-8 pieces of paraffin sections (5-10 μm thickness, 1x1 cm2 surface area) and one additional H&E slide were required for marking for tumor enrichment by a pathologist, and then, dissection of tissue from unstained tissue was performed; 4) pleural effusion samples were collected simultaneously when tissue biopsies might not be sufficient for gene analysis; and 5) at least 80-100 ml from pleural effusion samples was required, and at least 10-15 ml blood was required for the extraction of a sufficient amount of ctDNA.
An ARMS PCR assay of tumor tissue samples from the forty-seven patients was performed using the AmoyDx EGFR Gene mutation Detection Kit (Amoy Diagnostics, Xiamen, China). Due to a lack of a sufficient amount of tumor samples, pleural effusion samples were collected from six patients. Genomic DNA from tumor tissue/pleural effusions was sequenced in Proton and digital PCR, and ctDNA from forty-seven plasma samples was analyzed in digital PCR only. Because of the lack of a sufficient amount of ctDNA, sites detected with a mutation in the corresponding tumor tissue samples were assessed with priority (see Supplementary Figure 1 for the overall study design).
DNA extraction and quantification
All extractions were conducted according to the manufacturer’s instructions. gDNA from FFPE samples was extracted using a TIANamp FFPE DNA Kit (Tiangen, Beijing, China). Pleural effusions were centrifuged at 3000 rpm for 15 min at RT, and then, gDNA was extracted from them using a TIANamp Blood DNA kit (Tiangen, Beijing, China). Before ctDNA extraction, plasma was obtained by centrifuging blood at 2000 x g for 10 min at 4°C, and the plasma layer was centrifuged at 16000 x g for 10 min at 4°C in order to further remove cell debris. Then, ctDNA was extracted from approximately 5 ml plasma using a QIAamp Circulating Nucleic Acid Kit (Qiagen, Valencia, CA) and eluted in a final volume of 30 μl. The DNA concentration was measured by a Qubit dsDNA HS assay kit on the Quantus Fluorometer according to the manufacturing protocol (Thermo Fisher Scientific, Waltham, MA). The DNA quality (A260/280) was determined by a Nanodrop 2000 spectrophotometer (Thermo Fisher Scientific, Waltham, MA) and agarose gel. The DNA was stored at -80°C for future use.
Library preparation and sequence data processing
A total of 10-20 ng gDNA was used as the template, according to different DNA qualities. DNA libraries were prepared using an Ion AmpliSeq Library Kit 2.0 and Ion AmpliSeq Cancer Hotspot Panel V2, and ligated adapters were prepared using an Ion Xpress Barcode Adapter 1-96 kit (Thermo Fisher Scientific, Waltham, MA) according to the manufacturer’s protocol. The library concentration was quantified using a Qubit dsDNA HS assay kit (Thermo Fisher Scientific, Waltham, MA) and the Agilent 2100 Bioanalyzer instrument. Based on the result, emulsion PCR and enrichment steps were prepared using an Ion OneTouch 2 System (Thermo Fisher Scientific, Waltham, MA). Then, the amplicon library was sequenced via an Ion Proton system with an Ion PI chip (Thermo Fisher Scientific, Waltham, MA).
Data analysis was performed based on the Torrent Suite Software version 4.4 (Thermo Fisher Scientific, Waltham, MA). The sequencing reads were aligned to the reference human genome sequence (hg19) using the Torrent Mapping Alignment Program (TMAP) with the default parameters. Quality control was performed following the manufacturer’s standard protocol, the average depth per sample required higher than 3000X, and the variant depth required higher than 4500X. However, to enhance EGFR exon 19 deletions, we added an additional Torrent Variant Caller (TVC) step with modified TMAP parameter (--softclip-type 3, do not allow soft-clipping), hotspot VCF file and bed file of EGFR exon 19. For a mutation abundance below 1%, we used IGV software to make up for TVC being missing. Mutations were determined to be positive when IGV clearly presented an abundance higher than 1%.
Detection of EGFR mutations by QuantStudio 3D Digital PCR
Digital PCR assays were conducted using a QuantStudio 3D Digital PCR system (Thermo Fisher Scientific, Waltham, MA). A total of 30 ng gDNA/ctDNA was amplified using Taqman SNP Genotyping Assays, in which the probes were chosen according to specific EGFR gene mutations (L858R, T790M and exon 19 deletions). Since three EGFR mutation types were analyzed in a single assay, samples without enough ctDNA (90 ng) would exhibit a positive mutation prior to the negative sites, according to the detection in paired tumor tissue, and when ctDNA was less than 30 ng, we did not perform the assay. PCR reagents were loaded with a QuantStudio 3D Digital PCR 20K Chip v2. The subsequent analysis and post-processing were performed with the QuantStudio 3D AnalysisSuite Software.
Statistics
The statistical data were analyzed with SAS software ver. 9.2 (SAS Institute, Cary, NC). The Wilcoxon matched-pairs signed-rank test was used to compare the mutation abundance detection in tumor tissue and plasma using the digital PCR platform. Spearman’s rank correlation coefficient was used to analyze the correlation between tumor frequency and plasma mutation abundance. ROC analysis was used to evaluate the detection sensitivity, specificity and cut-off value of tumor tissue mutation abundance. P<0.05 was considered statistically significant.
Abbreviations
ctDNA: circulating tumor DNA; NSCLC: non-small cell lung cancer; EGFR: epidermal growth factor receptor; EGFR TKIs: EGFR tyrosine kinase inhibitors; NGS: next-generation sequencing; PCR: polymerase chain reaction; PD: progressive disease; ARMS: Scorpion amplification refractory mutation system; gDNA: genomic DNA; TMAP: Torrent Mapping Alignment Program; TVC: Torrent Variant Caller; ddPCR: droplet digital PCR; MAF: mutation allele frequency; FFPE: formalin-fixed paraffin-embedded.
Author contributions
Jincui Gu and Wanchun Zang acted as study investigators and contributed to study design, enrollment and management of patients, interpretation of data, and drafted the article. Yanbin Zhou and Yang Yu designed and supervised this study. Bing Liu, Lixia Huang and Shaoli Li performed sample collection and data analysis. GuanHua Rao and Lei Li provided critical revision of the article. All authors participated in writing and review of the manuscript and approved of the version to be published.
ACKNOWLEDGMENTS
We acknowledge all other studies that supported our work and were not cited due to length limitations. We are thankful to Ran Ding, Hongwang Li, Jian Lin and Fei Gai from Novogene Bioinformatics Institute for their assistance in study design, sequencing and data analysis.
CONFLICTS OF INTEREST
Authors Wanchun Zang, Bing Liu, Lei Li, Guanhua Rao, Yang Yu are employees of Novogene Bioinformatics Institute, Beijing, China. All other authors have no conflicts of interest to disclose.
FUNDING
This work was supported by the National Natural Science foundation of China [grant number 81570008]; the Natural Science Foundation of Guangdong Province of China [grant number 2014A030313052]; the Science and Technology Program of Guangzhou, China [grant number 2014J4100132]; and the Medical Scientific Research Foundation of Guangdong Province of China [grant number A2015311].
REFERENCES
1. Dietel M, Jöhrens K, Laffert MV, Hummel M, Bläker H, Pfitzner BM, Lehmann A, Denkert C, Darb-Esfahani S, Lenze D, Heppner FL, Koch A, Sers C, et al. A 2015 update on predictive molecular pathology and its role in targeted cancer therapy: a review focussing on clinical relevance. Cancer Gene Ther. 2015; 22: 417–30. doi: 10.1038/cgt.2015.39.
2. Sequist LV, Martins RG, Spigel D, Grunberg SM, Spira A, Jänne PA, Joshi VA, McCollum D, Evans TL, Muzikansky A, Kuhlmann GL, Han M, Goldberg JS, et al. First-line gefitinib in patients with advanced non-small-cell lung cancer harboring somatic EGFR mutations. J Clin Oncol. 2008; 26: 2442–9. doi: 10.1200/JCO.2007.14.8494.
3. Yu HA, Arcila ME, Rekhtman N, Sima CS, Zakowski MF, Pao W, Kris MG, Miller VA, Ladanyi M, Riely GJ. Analysis of tumor specimens at the time of acquired resistance to EGFR TKI therapy in 155 patients with EGFR mutant lung cancers. Clin Cancer Res. 2013; 19: 2240–7. doi: 10.1158/1078-0432.CCR-12-2246.
4. Kobayashi S, Boggon TJ, Dayaram T, Jänne PA, Kocher O, Meyerson M, Johnson BE, Eck MJ, Tenen DG, Halmos B. EGFR mutation and resistance of non-small-cell lung cancer to gefitinib. N Engl J Med. 2005; 352: 786–92. doi: 10.1056/NEJMoa044238.
5. Pao W, Miller VA, Politi KA, Riely GJ, Somwar R, Zakowski MF, Kris MG, Varmus H. Acquired resistance of lung adenocarcinomas to gefitinib or erlotinib is associated with a second mutation in the EGFR kinase domain. PLoS Med. 2005; 2: e73. doi: 10.1371/journal.pmed.0020073.
6. Jänne PA, Yang JC, Kim DW, Planchard D, Ohe Y, Ramalingam SS, Ahn MJ, Kim SW, Su WC, Horn L, Haggstrom D, Felip E, Kim JH, et al. AZD9291 in EGFR inhibitor-resistant non-small-cell lung cancer. N Engl J Med. 2015; 372: 1689–99. doi: 10.1056/NEJMoa1411817.
7. Goss G, Tsai CM, Shepherd FA, Bazhenova L, Lee JS, Chang GC, Crino L, Satouchi M, Chu Q, Hida T, Han JY, Juan O, Dunphy F, et al. Osimertinib for pretreated EGFR Thr790Met-positive advanced non-small-cell lung cancer (AURA2): a multicentre, open-label, single-arm, phase 2 study. Lancet Oncol. 2016; 17: 1643–52. doi: 10.1016/S1470-2045(16)30508-3.
8. Ramalingam SS, Rukazenkov Y, Thomas K, Soria JC. A randomized, phase III study (FLAURA) of AZD9291, a novel EGFR-TKI, versus gefitinib or erlotinib in treatment-naïve patients with advanced non-small cell lung cancer and an EGFR-TKI-sensitizing mutation. J Clin Oncol. 2015; 33: abstr TPS8102.
9. Marusyk A, Polyak K. Tumor heterogeneity: causes and consequences. Biochim Biophys Acta. 2010; 1805: 105–17. doi: 10.1016/j.bbcan.2009.11.002.
10. Kawamura T, Kenmotsu H, Taira T, Omori S, Nakashima K, Wakuda K, Ono A, Naito T, Murakami H, Mori K, Nakajima T, Ohde Y, Endo M, et al. Rebiopsy for patients with non-small-cell lung cancer after epidermal growth factor receptor-tyrosine kinase inhibitor failure. Cancer Sci. 2016; 107: 1001–5. doi: 10.1111/cas.12963.
11. Crowley E, Di Nicolantonio F, Loupakis F, Bardelli A. Liquid biopsy: monitoring cancer-genetics in the blood. Nat Rev Clin Oncol. 2013; 10: 472–84. doi: 10.1038/nrclinonc.2013.110.
12. Qiu M, Wang J, Xu Y, Ding X, Li M, Jiang F, Xu L, Yin R. Circulating tumor DNA is effective for the detection of EGFR mutation in non-small cell lung cancer: a meta-analysis. Cancer Epidemiol Biomarkers Prev. 2015; 24: 206–12. doi: 10.1158/1055-9965.EPI-14-0895.
13. Thress KS, Brant R, Carr TH, Dearden S, Jenkins S, Brown H, Hammett T, Cantarini M, Barrett JC. EGFR mutation detection in ctDNA from NSCLC patient plasma: a cross-platform comparison of leading technologies to support the clinical development of AZD9291. Lung Cancer. 2015; 90: 509–15. doi: 10.1016/j.lungcan.2015.10.004.
14. Diaz LA Jr, Bardelli A. Liquid biopsies: genotyping circulating tumor DNA. J Clin Oncol. 2014; 32: 579–86. doi: 10.1200/JCO.2012.45.2011.
15. Morelli MP, Overman MJ, Dasari A, Kazmi SM, Mazard T, Vilar E, Morris VK, Lee MS, Herron D, Eng C, Morris J, Kee BK, Janku F, et al. Characterizing the patterns of clonal selection in circulating tumor DNA from patients with colorectal cancer refractory to anti-EGFR treatment. Ann Oncol. 2015; 26: 731–6. doi: 10.1093/annonc/mdv005.
16. Zhou Q, Zhang XC, Chen ZH, Yin XL, Yang JJ, Xu CR, Yan HH, Chen HJ, Su J, Zhong WZ, Yang XN, An SJ, Wang BC, et al. Relative abundance of EGFR mutations predicts benefit from gefitinib treatment for advanced non-small-cell lung cancer. J Clin Oncol. 2011; 29: 3316–21. doi: 10.1200/JCO.2010.33.3757.
17. Newman AM, Bratman SV, To J, Wynne JF, Eclov NC, Modlin LA, Liu CL, Neal JW, Wakelee HA, Merritt RE, Shrager JB, Loo BW Jr, Alizadeh AA, et al. An ultrasensitive method for quantitating circulating tumor DNA with broad patient coverage. Nat Med. 2014; 20: 548–54. doi: 10.1038/nm.3519.
18. Newton CR, Graham A, Heptinstall LE, Powell SJ, Summers C, Kalsheker N, Smith JC, Markham AF. Analysis of any point mutation in DNA. The amplification refractory mutation system (ARMS). Nucleic Acids Res. 1989; 17: 2503–16. doi: 10.1093/nar/17.7.2503.
19. Watanabe M, Kawaguchi T, Isa SI, Ando M, Tamiya A, Kubo A, Saka H, Takeo S, Adachi H, Tagawa T, Kakegawa S, Yamashita M, Kataoka K, et al. Ultra-sensitive detection of the pretreatment EGFR T790M mutation in non-small cell lung cancer patients with an EGFR-activating mutation using droplet digital PCR. Clin Cancer Res. 2015; 21: 3552–60. doi: 10.1158/1078-0432.CCR-14-2151.
20. Zhang Y, Xu Y, Zhong W, Zhao J, Chen M, Zhang L, Li L, Wang M. Total DNA input is a crucial determinant of the sensitivity of plasma cell-free DNA EGFR mutation detection using droplet digital PCR. Oncotarget. 2017; 8: 5861–73. doi: 10.18632/oncotarget.14390.
21. Lin MT, Mosier SL, Thiess M, Beierl KF, Debeljak M, Tseng LH, Chen G, Yegnasubramanian S, Ho H, Cope L, Wheelan SJ, Gocke CD, Eshleman JR. Clinical validation of KRAS, BRAF, and EGFR mutation detection using next-generation sequencing. Am J Clin Pathol. 2014; 141: 856–66. doi: 10.1309/AJCPMWGWGO34EGOD.
22. Huggett JF, Foy CA, Benes V, Emslie K, Garson JA, Haynes R, Hellemans J, Kubista M, Mueller RD, Nolan T, Pfaffl MW, Shipley GL, Vandesompele J, et al. The digital MIQE guidelines: minimum information for publication of quantitative digital PCR experiments. Clin Chem. 2013; 59: 892–902. doi: 10.1373/clinchem.2013.206375.
23. Su KY, Chen HY, Li KC, Kuo ML, Yang JC, Chan WK, Ho BC, Chang GC, Shih JY, Yu SL, Yang PC. Pretreatment epidermal growth factor receptor (EGFR) T790M mutation predicts shorter EGFR tyrosine kinase inhibitor response duration in patients with non-small-cell lung cancer. J Clin Oncol. 2012; 30: 433–40. doi: 10.1200/JCO.2011.38.3224.
24. Hata AN, Niederst MJ, Archibald HL, Gomez-Caraballo M, Siddiqui FM, Mulvey HE, Maruvka YE, Ji F, Bhang HC, Krishnamurthy Radhakrishna V, Siravegna G, Hu H, Raoof S, et al. Tumor cells can follow distinct evolutionary paths to become resistant to epidermal growth factor receptor inhibition. Nat Med. 2016; 22: 262–9. doi: 10.1038/nm.4040.
25. Egholm M, Nickerson E, Thomas R, Turenchalk G, Desany B, Ronan M, Hutchison S, Knight J, Du L, Leamon J. Ultra-Deep Sequencing of EGFR from Lung Carcinoma preveals low abundance drug response mutations. 2005. Available from http://www.ashg.org/genetics/ashg05s/f472.htm.
26. Lee Y, Lee GK, Lee YS, Zhang W, Hwang JA, Nam BH, Kim SH, Kim JH, Yun T, Han JY, Kim HT, Lee JS. Clinical outcome according to the level of preexisting epidermal growth factor receptor T790M mutation in patients with lung cancer harboring sensitive epidermal growth factor receptor mutations. Cancer. 2014; 120: 2090–8. doi: 10.1002/cncr.28711.
27. Hong B, Zu Y. Detecting circulating tumor cells: current challenges and new trends. Theranostics. 2013; 3: 377–94. doi: 10.7150/thno.5195.