
INTRODUCTION
The outcome of patients with colorectal cancer (CRC) strongly depends on tumor stage at time of diagnosis. Whereas stage I CRC patients have a 5-year overall survival of more than 90%, in stage IV CRC patients it declines to ~20% or less [1]. When unresectable distant metastases develop, palliative systemic therapy is the only treatment option available to these patients. The backbone of this is a fluoropyrimidine, e.g. capecitabine (CAP) or 5-fluorouracil (5-FU) in combination with either oxaliplatin or irinotecan [2]. Addition of targeted agents directed against vascular epithelial growth factor (VEGF) (bevacizumab) or epidermal growth factor receptor (EGFR) (cetuximab and panitumumab) has been demonstrated to give additional outcome benefit. [3] Only a subset of patients benefit from these regimens, while those patients that do not, may still suffer from considerable toxicity. With the exception of KRAS/NRAS mutation status that predicts resistance to EGFR-targeted therapy [4, 5], no other biomarkers exist that adequately predict treatment response in metastatic CRC. Thus, predictive biomarkers are urgently needed to identify the subset of patients who will benefit from a specific treatment.
Hypermethylated genes form a particular category of biomarkers and a number of these have been reported to predict drug response in CRC patients [6, 7]. but inconsistent results for the same markers have been reported [8, 9]. Hypermethylated genes are of particular interest, since DNA methylation is potentially reversible by DNA methyltransferase inhibitors, which could provide a way to restore expression of genes silenced by DNA hypermethylation and thus increase the sensitivity of tumor cells to the agents the gene is associated with [10, 11].
In the present study we set out to identify and validate novel hypermethylated genes that could potentially predict response to treatment with irinotecan in patients with metastatic CRC, using material from two clinical trials, i.e. the Dutch CApecitabine, IRinotecan and Oxaliplatin (CAIRO) study [12] and the Fluorouracil, Oxaliplatin, CPT-11: Use and Sequencing (FOCUS-1) study from the UK [13].
RESULTS
Candidate gene selection
Correlation analyses of the DNA methylation status with drug sensitivity in 32 cell lines yielded 22 genes associated with topoisomerase inhibitor-related mode of action. These genes were analyzed for DNA methylation status in the discovery set (n=185). Methylation frequencies ranged from 1% to 98%, average 43% (Table 1).
Table 1: Discovery set: observed methylation frequencies of candidate genes
Gene symbol |
Methylation frequency |
|---|---|
BIK |
27% |
CAT |
14% |
CCND2 |
31% |
CDK5 |
17% |
DAPK1 |
23% |
DCR1 |
39% |
EEF1A2 (primer set 1) |
1% |
EEF1A2 (primer set 2) |
5% |
HOXA9 |
40% |
IRAK1 |
40% |
LIG4 |
92% |
NUDT1 |
92% |
PAX3 (primer set 1) |
85% |
PAX3 (primer set 2) |
98% |
PRKCB1 |
23% |
PROK2 |
19% |
PROP1 |
93% |
PTGS2 |
8% |
RASSF1 |
14% |
RBBP8 |
45% |
RHOB |
4% |
SPO11 |
96% |
TBX5 |
96% |
TIPARP |
19% |
Evaluation of biomarker potential in the discovery set (CAIRO)
In concordance with the original CAIRO study [12], the sub selection of patients in the discovery set showed significantly longer PFS when treated with CAPIRI (n=95) compared to CAP alone (n=90) (median PFS of 252 vs 182 days for CAPIRI vs CAP, respectively; HR=0.67 (95% CI 0.50-0.90, p=0.007) (Figure 1A). DCR1 was methylated in 72/185 (39%) tumors. To assess the predictive value of each candidate gene, a multivariate survival model was generated including clinical variables, treatment arm, and an interaction term between treatment arm and candidate gene. After correcting for multiple testing, the treatment arm*candidate gene interaction remained significant for Tumor Necrosis Factor Receptor Superfamily member 10c (TNFRSF10c, also known as Decoy Receptor 1 (DCR1)) and Interleukin-1 Receptor-Associated Kinase 1 (IRAK1). This indicates that the methylation status of these candidate genes exerted an independent effect on PFS that was different between treatment arms (Table 2).
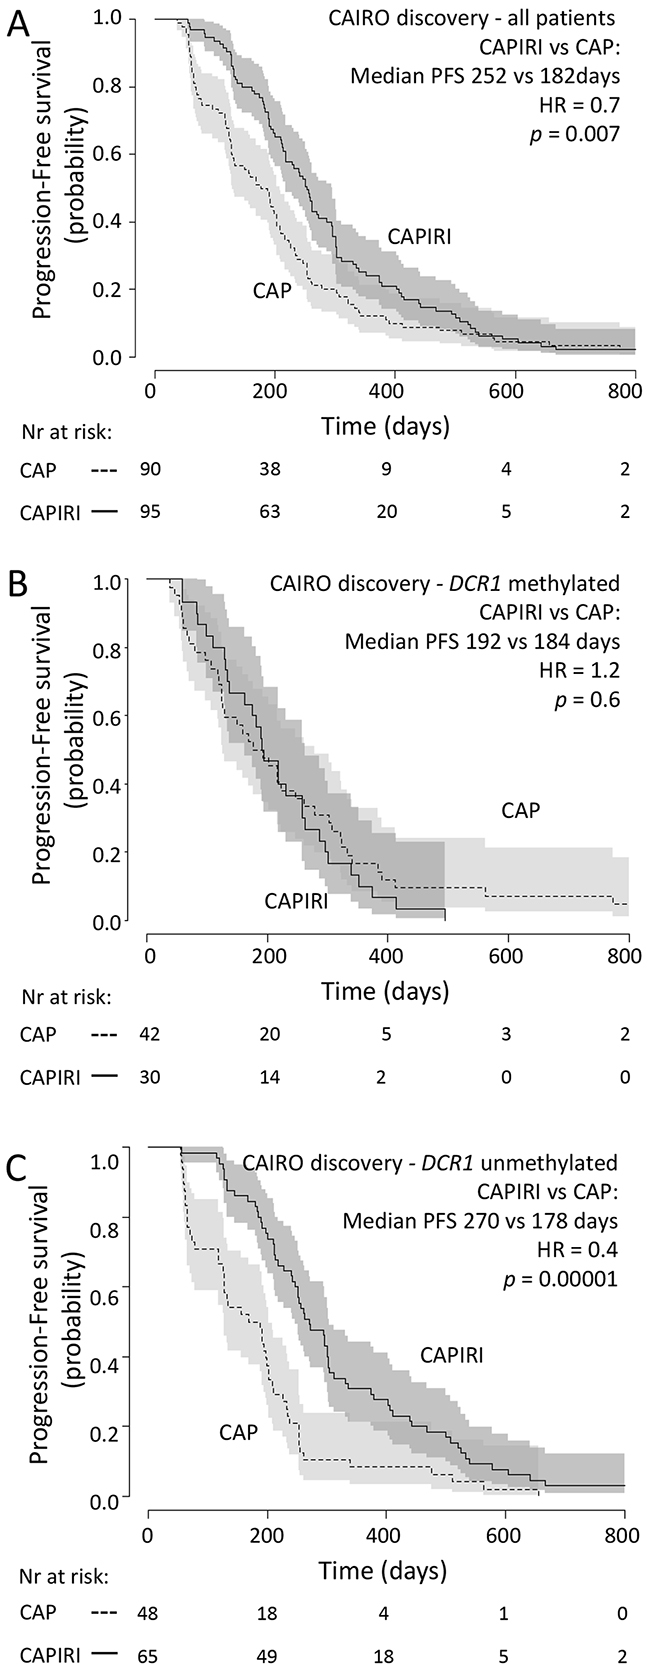
Figure 1: CAIRO discovery set: Progression-free survival Progression free survival in metastatic CRC cancer patients treated in first-line with CAP (dashed line) or CAPIRI (solid line)in (A) all patients from the CAIRO discovery set, in (B) patientswith methylated tumor DCR1or in (C) patients with unmethylated tumor DCR1. 95% confidence interval of the survival probability is shown by dark and light grey shades. HR=Hazard Ratio (CAPIRI versus CAP).
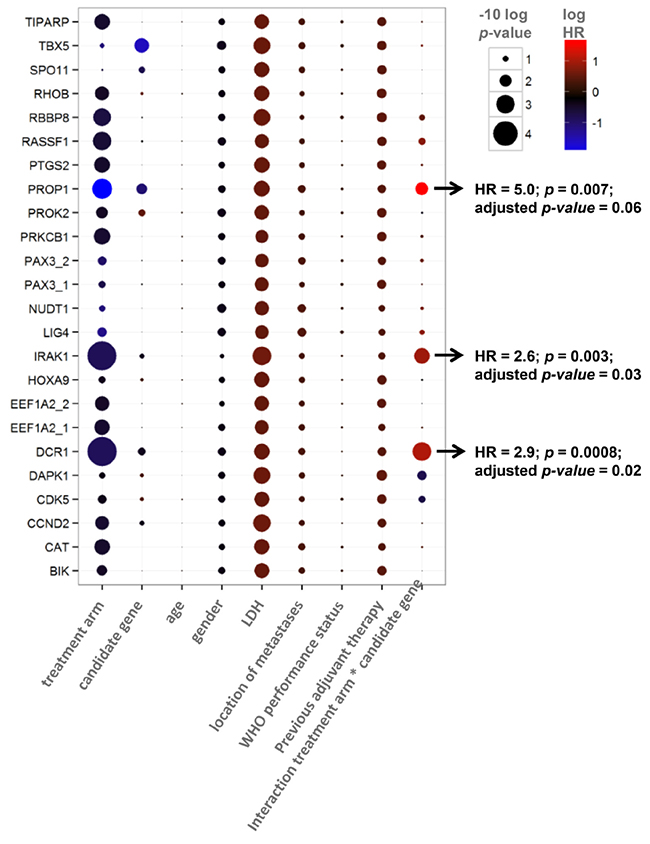
Table 2: Multivariate analysis for predictive value of candidate genes, showing p-values (size) and Hazard Ratio’s (color).
Kaplan-Meyer curve analysis revealed that out of the two final candidate genes, the methylation status of DCR1 was predictive for PFS after treatment with CAPIRI, but not for PFS after treatment with CAP; patients with methylated DCR1 tumors progressed more quickly than patients with unmethylated DCR1 tumors when treated with CAPIRI (HR=2.1 (95% CI 1.3-3.3, p=0.001), but no difference was observed between patients with unmethylated or methylated DCR1 tumors when treated with CAP (HR=0.7 (95% CI 0.5-1.1, p=0.1) (Supplementary Figure 1). IRAK1 methylation was predictive of PFS after treatment with CAP, but not for CAPIRI (Supplementary Figure 1), and hence was not further studied.
Because CAIRO was a randomized controlled trial, we were able to estimate the benefit of CAPIRI treatment over CAP treatment for patients with methylated or unmethylated DCR1 tumors by comparing PFS between the different treatment arms. Patients with methylated DCR1 (72 out of 185; 39%) did not benefit from adding irinotecan to CAP (median PFS of 192 vs 184 days for CAPIRI vs CAP, respectively; HR=1.2 (95%CI 0.7-1.9, p=0.6; Figure 1B)). In contrast, patients with unmethylated DCR1 showed a significantly longer PFS when treated with CAPIRI compared to CAP alone (median PFS of 270 vs 178 days for CAPIRI vs CAP, respectively; HR=0.4 (95% CI 0.3-0.6, p=0.00001; Figure 1C)).
Internal validation set (CAIRO)
In the second set of patients from the CAIRO study, in concordance with the original CAIRO study [12], PFS was significantly longer for patients treated with CAPIRI (n=88) compared to patients treated with CAP alone (n=78) (median PFS of 267 vs 200 days for CAPIRI vs CAP, respectively; HR=0.6 (95% CI 0.5-0.9, p=0.003; Figure 2A)).
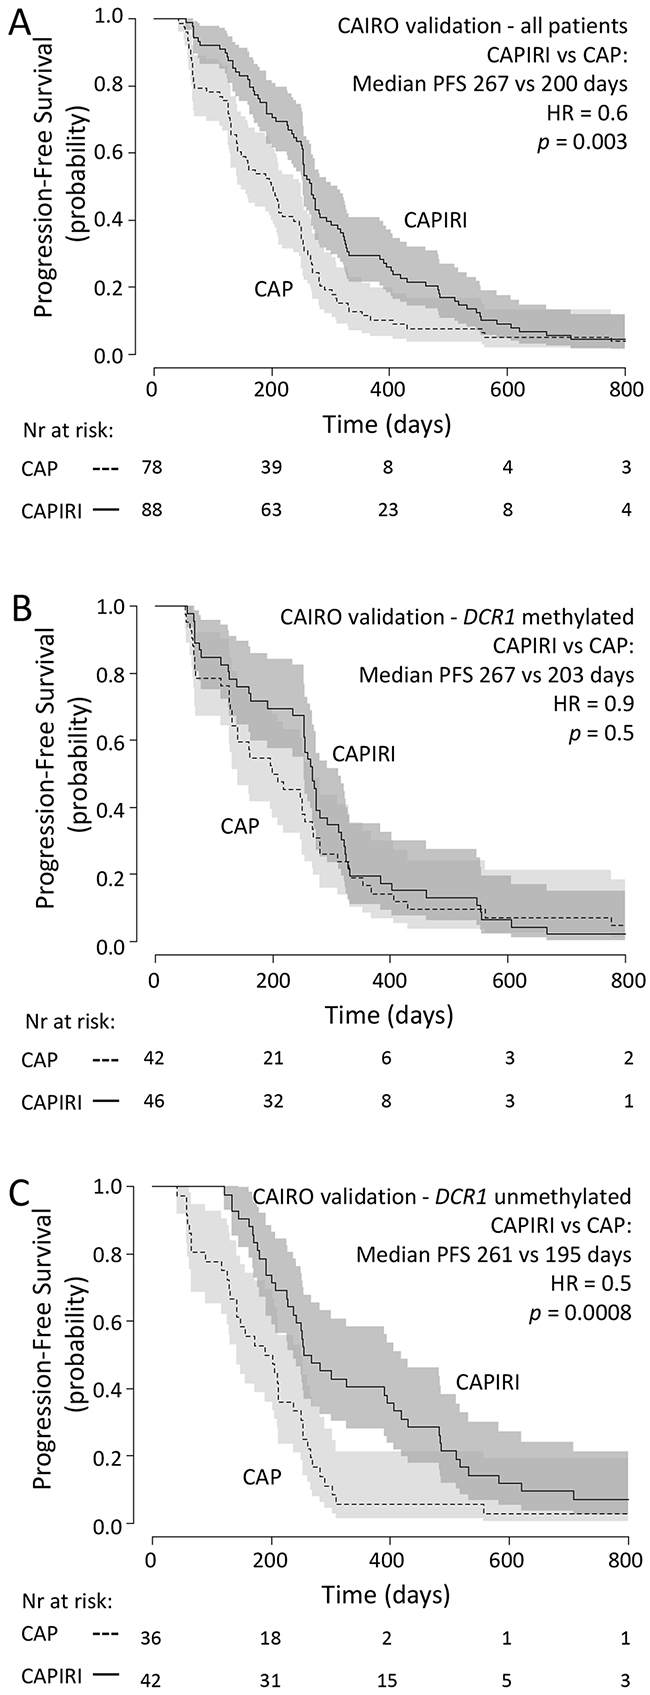
Figure 2: CAIRO validation set: Progression-free survival Progression free survival in metastatic CRC cancer patients treated in first-line with CAP (dashed line) or CAPIRI (solid line)in (A) all patients from the CAIRO validation set, in (B) patientswith methylated tumor DCR1or in (C) patients with unmethylated tumor DCR1. 95% confidence interval of the survival probability is shown by dark and light grey shades. HR=Hazard Ratio (CAPIRI versus CAP).
DCR1 was methylated in 88 out of 166 (53%) tumors. A multivariate analysis, as described for the discovery set, showed a significant interaction between treatment arm and DCR1 methylation (p=0.04, Table 3). Kaplan-Meyer analyses confirmed that patients with methylated DCR1 tumors did not significantly benefit from CAPIRI treatment over CAP treatment (median PFS of 267 vs 203 days for CAPIRI vs CAP, respectively; HR=0.9 (95%CI 0.6-1.4, p=0.5; Figure 2B)), whereas patients with unmethylated DCR1 tumors did (median PFS of 261 vs 195 days for CAPIRI vs CAP, respectively; HR=0.5 (95%CI 0.3-0.7, p=0.0008) (Figure 2C)).
Table 3: Evaluation of predictive value of DCR1 methylation on progression after treatment(multivariate cox proportional hazard model)
Variables in the model |
CAIRO discovery set |
CAIRO validation set |
FOCUS validation set |
|||
|---|---|---|---|---|---|---|
HR |
p-value |
HR |
p-value |
HR |
p-value |
|
Treatment |
0.4 |
0.00002 |
0.4 |
0.0001 |
0.9 |
0.4 |
DCR1 methylation status |
0.6 |
0.05 |
0.8 |
0.3 |
1.1 |
0.6 |
Age |
1.0 |
0.8 |
1.0 |
0.03 |
1.0 |
0.05 |
Gender |
0.7 |
0.05 |
1.0 |
0.9 |
0.9 |
0.5 |
WHO performance status |
1.1 |
0.5 |
1.1 |
0.5 |
1.0 |
0.8 |
Previous adjuvant therapy |
1.5 |
0.04 |
1.2 |
0.5 |
1.1 |
0.6 |
LDH |
1.7 |
0.002 |
1.5 |
0.02 |
na |
na |
location of metastases |
1.4 |
0.07 |
0.8 |
0.2 |
na |
na |
Interaction treatment*DCR1 methylation status |
2.9 |
0.0008 |
2.0 |
0.04 |
0.8 |
0.3 |
HR = hazard ratio
External validation set (FOCUS)
As an independent validation series, we analyzed 467 tumor samples from another randomized controlled phase III clinical trial (FOCUS) [13]. In this series, similar to the original trial, PFS was significantly longer for patients treated with FOLFIRI (n=136) compared to patients treated with 5-FU alone (n=331) (median PFS of 272 vs 231 days for FOLFIRI vs 5-FU, respectively; HR=0.8 (95%CI 0.6-1.0, p=0.02); Figure 3A).
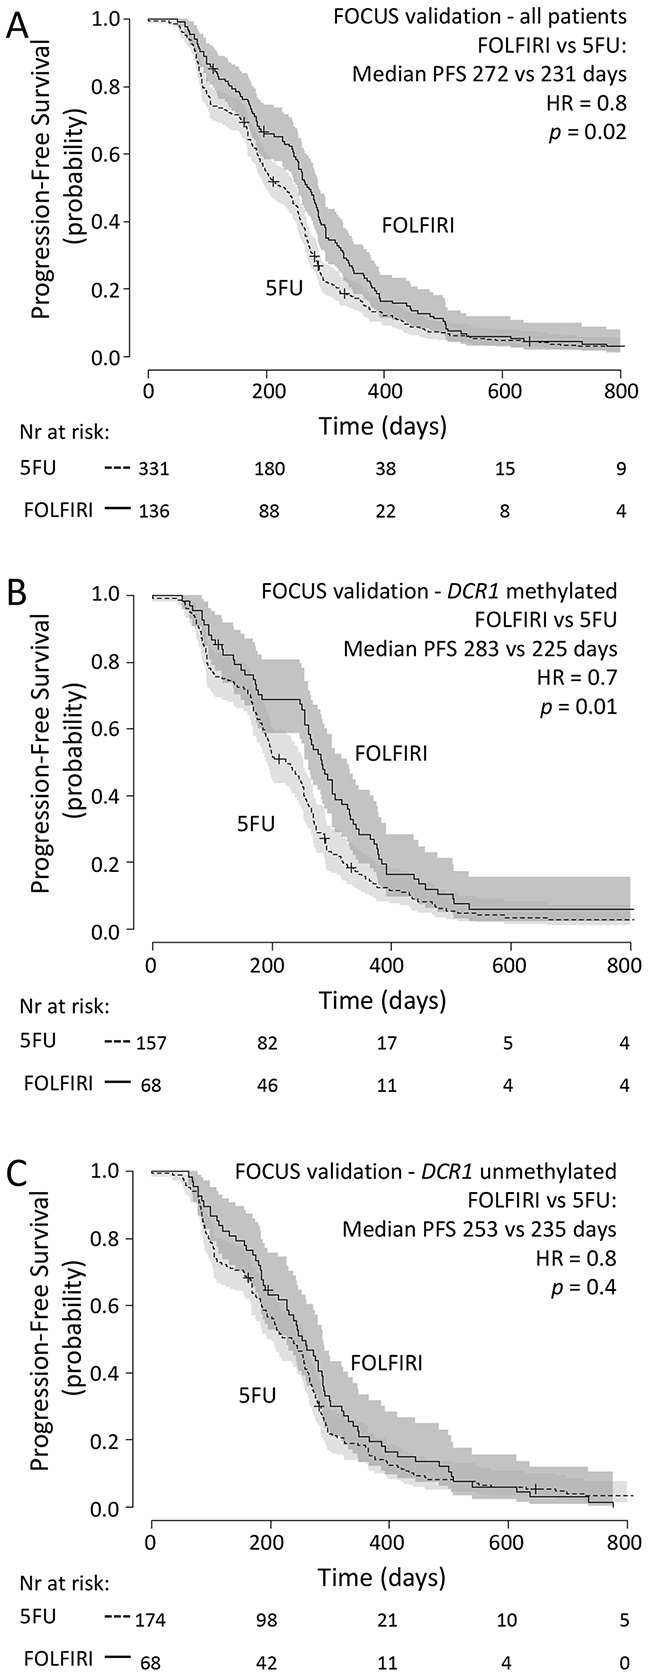
Figure 3: FOCUS validation set: Progression-free survival Progression free survival in metastatic CRC cancer patients treated in first-line with 5-FU (dashed line) or FOLFIRI (solid line)in (A) all patients from the FOCUS validation set, in (B) patientswith methylated tumor DCR1or in (C) patients with unmethylated tumor DCR1. 95% confidence interval of the survival probability is shown by dark and light grey shades. HR=Hazard Ratio (FOLFIRI versus 5-FU).
DCR1 was methylated in 225 out of 467 (48%) tumors. Multivariate analysis revealed that there was no significant interaction between treatment arm and DCR1 methylation status (p=0.3, Table 3). Indeed, Kaplan-Meyer analyses revealed that patients with methylated or unmethylated DCR1 had a similar effect size from FOLFIRI treatment over 5-FU treatment, as based on HR (methylated DCR1: median PFS of 283 vs 225 days for FOLFIRI vs 5-FU, respectively; HR=0.7 (95%CI 0.5-0.9, p=0.01) (Figure 3B); unmethylated DCR1: median PFS of 253 vs 235 days for FOLFIRI vs 5-FU, respectively; HR=0.8 (95%CI 0.6-1.2, p=0.4) (Figure 3C)).
Methylation of DCR1 is associated to decreased gene expression
The relation between DCR1 promoter hypermethylation and gene expression was investigated in vitro in a panel of 13 CRC cell lines. Ten out of 13 CRC cell lines were fully methylated for DCR1 and showed low or absent gene expression. The other three CRC cell lines were hemi-methylated and showed clearly higher gene expression levels (Figure 4A). Treatment of two CRC cell lines, HCT116 and Colo205, with the demethylating agent DAC resulted in increased DCR1 expression (p=0.005 and p=0.08, respectively; Figure 4B). In addition, data from The Cancer Genome Atlas (TCGA) database (http://cancergenome.nih.gov), including 223 CRC tumors, confirmed a negative correlation between DCR1 DNA methylation and DCR1 mRNA expression (Pearson correlation of -0.4, p=3.4E-9; Figure 4C).
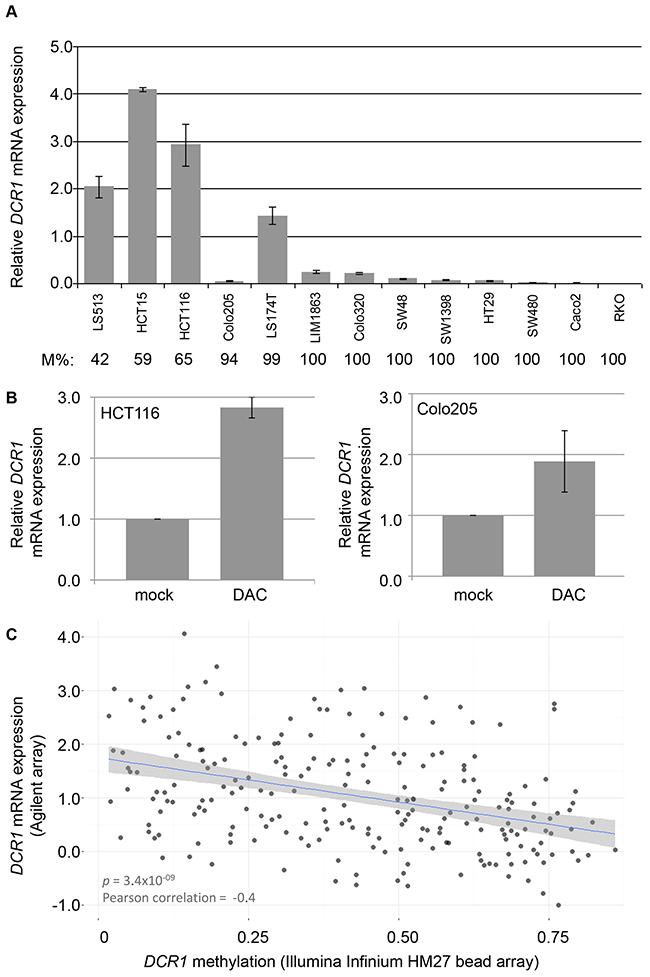
Figure 4: DCR1 methylation and mRNA expression levels (A) DCR1 mRNA expression analysis in CRC cell lines by RT-PCR. DCR1 DNA methylation percentage as measured by qMSP (M%) is indicated below each cell line. Quantifications represent mean expression values from three independent experiments. (B) DCR1 mRNA expression analysis by RT-PCR of HCT116 (left panel) and Colo205 (right panel) with and without DAC treatment (p=0.005 and p=0.08, respectively). (C) Scatter plot including a linear regression line and 95% confidence interval, showing the correlation of DCR1 methylation levels and DCR1 mRNA expression in 223 CRC tissues from TCGA.
DISCUSSION
In the present study we used a candidate gene approach to identify methylation markers for response to treatment with irinotecan-based therapy. We first made a selection of candidate genes based on in vitro findings on their function in relation to the mode of action of irinotecan, i.e. topoisomerase inhibition. Next, we tested for correlation of the methylation status of the candidate genes and PFS after treatment with CAPIRI therapy of metastatic CRC patients participating to the phase III CAIRO trial [12], which identified DCR1 as a candidate marker. Because patients treated with CAP alone were used as a control group, this analysis showed DCR1 methylation as a potential negative predictive marker for response to irinotecan-based therapy. The initial finding in the discovery set could be confirmed in a second series of patients from the same CAIRO study, which indicated that the initial finding was not a stochastic statistical finding. However, validation in a second, independent series of metastatic CRC patients from the phase III FOCUS trial [13], treated with first-line FOLFIRI or 5-FU alone, did not confirm DCR1 methylation status as negative predictive marker for response to irinotecan-based therapy.
Developing predictive biomarkers that reach the phase of introduction into clinical practice has proven to be highly challenging. The literature is full of proof of concept publications on potential biomarkers, but in most instances no further validation follows or if so they fail to publish. The current study was carefully designed in order to overcome most common pitfalls in biomarker discovery [14, 15]; i.e. a strong biological rationale existed for the preselected candidate genes, and extensive evaluation (discovery, internal validation and external validation) was performed in a prospective-retrospective design [16] on a total of 818 archival tumor samples derived from two similar well-conducted phase III randomized clinical trials, providing the highest quality of clinical annotation [12, 13] In addition, both clinical trials included a control group (i.e. CAP as control group for CAPIRI and 5-FU as control group for FOLFIRI), which is required to distinguish predictive from prognostic markers. Furthermore, biomarker independence was tested by including potential confounding factors in the statistical models. Nonetheless, after initial validation in a second sub-sample of the CAIRO study, we could not validate DCR1 methylation as a negative predictive marker for response to irinotecan-based therapy in the independent patient series from FOCUS. A lack of correlation between DCR1 methylation and DCR1 gene expression could be one of the reasons why DCR1 methylation as a marker for response to irinotecan-based therapy did not validate. However, our cell-line experiments as well as analysis of a large series from the TCGA database did show a correlation between DCR1 DNA methylation and gene expression silencing. All this data together would suggest to simply discard DCR1 methylation as a potential biomarker for response to irinotecan-based therapy, although our findings could still be otherwise explained. The two trials for instance, while they show substantial resemblances at first glance, differ in a number of features related to inclusion (e.g. the performance scores leading to differences in patient characteristics), population differences (methylation varies between populations and races [17]) and importantly treatment (e.g. different backbone treatment; CAP versus 5-FU). 5-FU, in contrast to CAP, is given in combination with Leucovorin, which is a reduced folic acid. Folic acid is implicated in regulation of DNA methylation and aberrant folic acid levels may affect global or site-specific DNA methylation levels in tissues [18, 19]. Treatment with Leucovorin thus could potentially affect DNA methylation levels in tumor tissue over time and thereby influencing the association with an a priori measured DNA methylation marker and drug sensitivity.
The current study has some limitations. For example, the drug-response screen on candidate genes was performed on cell lines rather than on actual human tumor samples. Although the use of cell lines reduces the number of confounding factors as compared to human tumor samples, it remains a challenge to translate the relevance of the observed data to the in vivo situation [20], and other interesting genes might have been missed by this approach.
Another limitation of the current study is that measurements were performed on samples from the primary tumor, while patients were treated for their metastases, raising the question whether intra tumor heterogeneity could play a role. Although metastases can acquire additional genomic alterations, they keep most of the alterations present in the primary tumor [21, 22]. As DNA methylation is usually an early event in colorectal carcinogenesis, this is likely to be the case here as well [23].
Lastly, DCR1 methylation analyses were performed with identical primers but with different reagents in different laboratories for the three study cohorts. This could have introduced variability in test results. The proportion of patients having a positive test result was slightly different for the three cohorts indeed (39% in the discovery set, 53% in the internal validation set and 48% in the external validation set). However, because the predictive value of DCR1 methylation with regard to irinotecan-based therapy showed similar results in the two cohorts with largest relative difference in prevalence of methylation (39% vs 53%), this variability is not likely to be the cause of the inability to validate DCR1 methylation as a predictive biomarker.
Another challenge is the biological complexity underlying tumor response to treatments and the question if a single biomarker can capture responses of a system as a whole. Moreover, the biology of DCR1, which acts in the TRAIL pathway, is complex. In normal tissue DCR1 is thought to work as a decoy receptor for the TNF-related apoptosis-inducing ligand (TRAIL), thus having an anti-apoptotic effect in the TRAIL pathway [24]. There are some indications, however, that TRAIL receptors in cancer have an anti-apoptotic role via the NF-кB survival pathway and hence silencing of DCR1 would subject a cancer cell to a pro-survival and pro-growth signal [25, 26]. The latter supports our finding in the CAIRO study that patients with a methylated DCR1 tumor have a worse outcome. Although our candidate gene selection revealed that DCR1 methylation is associated with sensitivity to topoisomerase inhibitor-related mode of action, the specific functional role of DCR1 methylation with regard to irinotecan is not known. It would be interesting to study this in colorectal cancer but because we could not validate DCR1 methylation as predictive marker for irinotecan treatment response, we feel that functional experimental analyses to dissect the role of DCR1 methylation and its interaction with irinotecan treatment are beyond the scope of the present study.
In conclusion, DCR1 methylation status was identified as a predictive marker for irinotecan-based therapy in metastatic colorectal cancer in both a discovery and an initial validation set. This could not be confirmed in an external validation data set, for which the difference in backbone treatments (5FU vs capecitabine) may possibly be an explanation. The present study highlights the challenge and importance of extensive evaluation of potential biomarkers. It also shows the complexity and extensiveness of systematic evaluation of a potential biomarker in order to generate more than just a proof of concept, and that a well-designed study is not a guarantee of success. Improvements in multi-team collaborations and in organizing data acquisition and biobanking in clinical trials will be necessary for efficient and successful discovery of predictive biomarkers in the future.
MATERIALS AND METHODS
Candidate gene selection
Candidate gene selection was based on correlations between methylation of 389 genes involved in DNA Damage Repair and Response and drug response in 32 cell lines, which is described in detail in the supplementary information. Because irinotecan is a topoisomerase-I inhibitor, genes associated sensitivity to topoisomerase inhibitor-related mode of action were considered.
Patient sample selection
Patients selected for the current study participated in either of two phase III trials, namely the CApecitabine, IRinotecan and Oxaliplatin (CAIRO) study of the Dutch Colorectal Cancer Group (DCCG) (CKTO 2002-07, ClinicalTrials.gov; NCT00312000) [12], and the Medical Research Council Fluorouracil, Oxaliplatin, CPT-11: Use and Sequencing (FOCUS) study (ISRCTN 79877428) under the auspices of the United Kingdom National Cancer Research Institute Colorectal Cancer Studies Group [13]. Written informed consent was required from all patients before study entry, and included consent for translational research on tumor tissue.
CAIRO biomarker populations
In the CAIRO study, 820 patients were randomized between sequential (arm-A, first-line CAP, second-line irinotecan and third-line CAPOX) and combination treatment (arm-B, first-line CAPIRI and second-line CAPOX). Patient and sample selection for molecular research purposes have been described before [27]. In short, we selected patients of whom FFPE tissue of the primary tumor was available through the Dutch national pathology registry PALGA [28]. Inherently these are the patients who underwent resection of the primary tumor (n=633), of which tissue samples were available for 478 patients. To be sure that the effect that we observed on outcome was related to the response to treatment and not to an unrelated intrinsic prognostic factor, patients that received only 1 or 2 cycles of therapy were excluded. In order to prevent that we would lose early progressors that could still be related to treatment, we did include those patients that received 2 cycles when death followed due to progressive disease. These selection criteria left us with 425 tissue samples for further analysis. Finally, only tumors containing an area of at least 70% tumor cells were selected for DNA extraction, leaving 351 tissue samples for further analysis DNA. The CAIRO discovery was done on a series of samples available that had been used in a previous study [27]. This series consisted of 185 patients, of which 90 patients were treated with first-line capecitabine (CAP) and 95 were treated with first-line capecitabine plus irinotecan (CAPIRI). The patient samples were matched according to the stratification factors in the original study (for the subgroup of patients that underwent resection of the primary tumor, since these are the patients from whom material was available to be included in this study) [12], that is, performance status, predominant metastatic site, previous adjuvant therapy and serum lactate dehydrogenase level (LDH).
For the initial validation set, patients were selected, with no further criteria, from the remaining patients of which tumor DNA samples were available. These comprised 166 patients, of which 78 were treated with first-line CAP and 88 were treated with first-line CAPIRI.
FOCUS biomarker validation population
In the FOCUS study, 2135 patients without pretreatment were randomly assigned to three treatment strategies in the ratio 1:1:1. In strategy A (control group) patients received first-line 5FU, followed by second-line irinotecan. In strategy B patients received first-line 5FU, followed by second-line 5-FU plus irinotecan (FOLFIRI; Strategy B-ir) or 5-FU plus oxaliplatin (FOLFOX; strategy B-ox). In strategy C patients received FOLFIRI (C-ir) or FOLFOX (C-ox) from the outset. For the current study, patients from strategy A (first-line 5FU), strategy B-ir (first-line 5FU) and strategy C-ir (first-line FOLFIRI) were selected, for which a total of 515 tumor DNA samples were available. From these, patients treated with at least three cycles of first-line therapy were selected, leaving 467 samples. These came from 331 patients treated with at least three cycles of first-line 5-FU (249 from strategy A and 82 from strategy B-ir) and 136 patients treated with at least three cycles of first-line 5-FU plus irinotecan (FOLFIRI; strategy C-ir).
DNA isolation and methylation analysis
Tumor samples from the CAIRO trial were retrieved through the Dutch national pathology registry PALGA [28] DNA was extracted from formalin-fixed paraffin-embedded tissue samples of primary tumors, resected before chemotherapy, as described before. [29, 30] DNA concentrations were quantified using the Nanodrop 1000 UV spectrophotometer (Nanodrop Technologies Inc, Wilmington, DE, USA). DNA was subjected to sodium bisulfite conversion using the EZ DNA Methylation Kit (Zymo Research, Orange, CA, USA) according to the manufacturer’s protocol.
Tumor DNA from the FOCUS trial was extracted as described in 7 [29]. DNA samples were subsequently cleaned by ethanol precipitation and DNA concentrations were quantified using the Nanodrop 1000 UV spectrophotometer (Nanodrop Technologies Inc).
All methylation assays were performed blind to information on treatment or survival outcome. The CAIRO discovery set was subjected to high-throughput LightCycler MSP assay (LightCycler 480 SYBR Green I Master kit (Roche, Vilvoorde, Belgium)) for the 22 selected candidate genes. Primers were designed to promoter regions (i.e. -1000 to +200 bp relative to the transcription start site). Primers from the literature were used when they experimentally passed our quality control; see Table 4 for primer sequences. Quality control was performed with in vitro Methylated DNA (Chemicon, Temecula, CA) as a positive control and DNA from the unmethylated human HCT116 DKO cell line as a negative control. Per sample, 20 ng bisulfite-modified DNA was amplified with the following PCR conditions: 95°C for 10 minutes followed by 45 cycles of 95°C for 10 seconds, 60°C for 30 seconds and 72°C for one second. Amplification of beta-actin was used as an unmethylated reference gene. The amplicons were checked for size and quantified by capillary electrophoresis (LC90 Labchip; Caliper Lifesciences).
Table 4: MSP primer sequences
Name |
Lightcycler MSP primers |
|
|---|---|---|
S primer |
AS primer |
|
BIK |
TTTTTGGAGTTTCGGTTTTTAC |
CTTTACACGAATAACCTCCGTTC |
CAT |
GTTTGTTGTTTCGAGTTCGTG |
ATCTTAACCTACCTAACGCCGA |
CCND2 |
CGGGGTTGTTTTATTCGTATCG |
CAACCAACTTACGTCACCGCT |
CDK5 |
AGTTTTGCGGGAAATGTTAATAC |
AAACTCCGATCTCAACAACGA |
DAPK1 |
TAAGGAGTCGAGAGGTTGTTTC |
CCTACCGCTACGAATTACCGA |
DCR1 |
TTACGCGTACGAATTTAGTTAAC |
CATCAAACGACCGAAACG |
EEF1A2 (1) |
GTTCGTGATTAGTAGAGTCGGGT |
ACAACGAATAAAAATAAAACGCC |
EEF1A2 (2) |
TTAGGTTGGGTACGTTCGTGA |
ACAACGAATAAAAATAAAACGCC |
HOXA9 |
AGGAGCGTATGTATTTGTCGTTC |
AACGCTATACCCGCTACGATA |
IRAK1 |
AGGATGTGTACGAGGTCGGTT |
CGAACTACGACTATACGAACGCT |
LIG4 |
GAGTTAAAAACGGGAGAAATCGT |
CACAACGCTATAAACTACGCC |
NUDT1 |
GTATTTTTCGAGTTCGTTACGTTT |
TCCTCTTAACGTCCAACGAC |
PAX3 (1) |
TTTGGGTATAGCGTCGGTT |
ATTCCCGAAAATCATCCGC |
PAX3 (2) |
ATAGTTTTCGAGGGTTATTCGC |
CCTAAACACAACGCCGACC |
PRKCB1 |
GTATCGCGTTTAGGTTTCGTTT |
CCGACGCTACAAAACTACGA |
PROK2 |
ATAAAGGTTAGTTTCGTCGTGA |
ACACGTACTCGTCTAAAAACCG |
PROP1 |
CGAGTTATGGAAGTAGAAAGGAGGC |
ATAATCGAAATCCCAATAACCGA |
PTGS2 |
TTACGGAAATGAGAAAATCGG |
GCCTAAAACGATAAAACTCGAAA |
RASSF1 |
GCGTATTGTAGGTTTTTGCGT |
TAATCCCTAACCGTAACCACCG |
RBBP8 |
GTATTTTTATACGGGTAAGGCGA |
TACCCCGCTACTCTACTCCGC |
RHOB |
AGGAGGGGATTCGGGTATC |
TAATTAACGACCCAAACCG |
SPO11 |
AGTGTGGGTCGCGTAGGTATC |
CTAAATCCAATATCCGCAACACG |
TBX5 |
TCGGTATTGATAGGCGAAGAC |
CTATAAAACTTAAAAACGTCACGAA |
TIPARP |
TAAGGTTTACGAAATAGTCGGTC |
ACTACCACCAAACGAAATCGC |
Beta Actin |
TAGGGAGTATATAGGTTGGGGAAGTT |
AACACACAATAACAAACACAAATTCAC |
Name |
qMSP primers |
|
S primer |
AS primer |
|
Beta Actin |
TGGTGATGGAGGAGGTTTAGTAAGT |
GAATTTTTTTATGTGTATGAATTTAGTTAAT |
DCR1_U |
GAATTTTTTTATGTGTATGAATTTAGTTAAT |
CCATCAAACAACCAAAACA |
DCR1_M |
TTACGCGTACGAATTTAGTTAAC |
CATCAAACGACCGAAACG |
For the CAIRO validation set and CRC cell lines a quantitative MSP (qMSP) assay for DCR1 was used. The primers for methylated DNA were the same primer sequences as the primers used for LightCycler analyses described above and were designed at the exact location as described before [31]. qMSP reactions were carried out in duplicate in 25 μl reaction volumes, each containing 36 ng of bisulfite-treated DNA, 10 pmol of each primer and 1x Power SYBR Green PCR Master Mix (Applied Biosystems, Foster City, CA). Each plate included no template controls and a standard curve with a serial dilution of bisulfite-modified DNA from a mixture of methylated cell line (HCT116) and unmethylated cell line (HCT116-DKO). PCR conditions were 95°C for 15 minutes, followed by 40 cycles at 95°C for 30 seconds, 56°C for 30 seconds and 72°C for 30 seconds, followed by a melt curve stage to check the specificity of the amplification reaction. Cycle threshold (Ct) values were measured at a fixed fluorescence threshold, which was always in the exponential phase of the amplification curves. The methylation percentage per sample was calculated according to the formula 2e-[mean CtM-reaction]/(2e–[mean CtM-reaction]+2e-[mean CtU-reaction])x100. The U (unmethylated) and M (methylated) reactions were amplified with comparable efficiencies. A sample was called methylated when the methylation percentage was higher than observed in a panel of 21 normal colon mucosa from non-cancer patients as measured in triplicate (median plus two times the standard deviation = 6%).
The FOCUS validation set was analyzed with a qMSP assay for DCR1 as well. The primers for methylated DNA were equal to the primers used in the CAIRO discovery and validation study. qMSP reactions were carried out using a 7500 Fast Real-Time PCR System (Applied Biosystem,) in duplicate in 25 μl reaction volumes, where each reaction contained 40 ng of bisulfite-treated DNA, 10 pmol of each primer and 12·5 μl SYBR Green PCR Master Mix (Applied Biosystems). Each plate included no-template controls and a standard curve with a serial dilution of bisulfite-modified DNA prepared from in vitro Methylated DNA (Chemicon). PCR conditions were 95°C for 15 minutes, 40 cycles at 95°C for 15 seconds, 60°C for 60 seconds, followed by melt curve analysis to check the specificity of the amplification reaction. Amplification of beta-actin was used as an unmethylated reference gene, using the same PCR conditions. The Ct ratio per sample was calculated according to the formula 2e-[mean CtDCR1 – mean CtACTB]. A sample was called methylated when the Ct ratio was higher than observed in a panel of 22 normal colon mucosa from non-cancer patients as measured in duplicate (median plus two times the standard deviation = 0·006)
Cell lines
HCT15, HCT116, LS513, LS174T, Colo320, SW48, SW1398, HT29, Colo205, SW480, and RKO were cultured in Dulbecco’s modified Eagle’s medium (DMEM; Lonza Biowhittaker, Verviers, Belgium) containing 10% fetal bovine serum (Hyclone, Perbio, UK). Caco-2 was cultured in RPMI 1640 (Lonza Biowhittaker) containing 20% fetal bovine serum. LIM1863 was cultured in RPMI 1640 (Lonza Biowhittaker) containing 5% FCS, 0·01 mg/ml thioglycerol, 1 mg/ml insulin and 1 μg/ml hydrocortisone. All cell culture media were supplemented with 2 mM L-glutamine, 100 IU/ml sodium penicillin (Astellas Pharma B.V., Leiderdorp, The Netherlands) and 100 mg/ml streptomycin (Fisiopharma, Palomonta (SA), Italy). To investigate re-expression of DCR1 after inhibition of DNA metyltransferases, HCT116 and Colo205 cells were treated with 5000 nM 5-aza-2’-deoxycytidine for three days (DAC, Sigma Chemical Co., St. Louis, MO, USA).
RNA isolation and qRT-PCR
Total RNA was isolated from cell lines using TriZol reagent (Invitrogen, Breda, the Netherlands), and subjected to purification using RNeasy Mini Kit (Qiagen). After DNAse treatment (RQ1 DNAse, Promega, Leiden, the Netherlands), cDNA was made with the Iscript cDNA Synthesis Kit (BioRad, Veenendaal, the Netherlands). Quantitative RT-PCR was done using TaqMan® Gene Expression Assays from Applied Biosystems directed to DCR1 (Hs00182570_m1) and a reference gene B2M (Hs00984230_m1). Relative expression levels were determined by calculating the Ct-ratio (Ct ratio = 2e-(CtDCR1–CtB2M))x1000.
TCGA data
DCR1 DNA methylation (Illumina Infinium HM27 bead array; HM27) and mRNA expression (Agilent array) data were obtained via cBioPortal for Cancer Genomics (http://www.cbioportal.org; [32]) on 223 CRC tumors included in The Cancer Genome Atlas (TCGA) Colorectal Cancer project. This data set was downloaded on the 14th of July 2015 from all tumors with available methylation and mRNA expression data from the Colorectal Adenocarcinoma (TCGA, Nature 2012) dataset [33].
Statistical analysis
The primary endpoint of the present study was progression free survival (PFS) under first-line systemic therapy with or without irinotecan. PFS for first-line treatment was calculated from the date of randomization to the first observation of disease progression or death reported after first-line treatment. To test the predictive value of candidate genes, multivariate Cox proportional hazard models were built that included the variables treatment, candidate gene and an interaction term treatment*candidate gene. In the CAIRO as well as the FOCUS trial, patients were randomized between treatment arms, which resulted in similar clinical characteristics between the treatment arms. However, because we were analyzing patient subsets from the original trials, for DCR1-specific analyses we corrected the estimates of predictive value for those variables that could have possible prognostic effect, by including them in the multivariate analyses. These were age, gender, WHO performance status and prior adjuvant therapy for both the CAIRO and the FOCUS samples, plus normal or abnormal LDH and location of metastases for CAIRO. Cox proportional hazard models were used to estimate Hazard Ratios (HR) and 95% confidence intervals (CI). Kaplan-Meier analyses and log-rank tests were used to estimate survival over time. Correction for multiple testing in the discovery set was done by the Benjamini Hochberg method.
Student’s T-test was used for comparison of DCR1 expression levels before and after DAC treatment of HCT116 and Colo205. Pearson correlation analysis was used to measure correlation between DCR1 methylation and mRNA expression levels from 223 primary CRC tissue samples as provided by The Cancer Genome Atlas (TCGA) database.
Statistical analyses were performed using the computing environment R version 3.2 [34], including the packages survival and rms [35–37].
Abbreviations
CRC, Colorectal Cancer; TNFRSF10C, Tumor Necrosis Factor Receptor Super Family 10C; DCR1, Decoy Receptor 1; MSP, Methylation Specific PCR; PFS, Progression Free Survival; CAIRO trial, Capecitabine Irinotecan and Oxaliplatin trial; FOCUS trial, Fluorouracil, Oxaliplatin, CPT-11: Use and Sequencing study; MOA, common modes of action; QC, quality control; Ct, Cycle threshold; DAC, 5-aza-2’-deoxycytidine
Author contributors
Conception and design: LJWB, WvC, BC, GAM
Data acquisition: LJWB, GT, PS, SM
Data analysis and interpretation: all authors
Statistical analyses: LJWB, VMHC
Manuscript drafting: LJWB, BC and GAM;
Critical revision of the manuscript: all authors;
Obtained funding: GAM;
Provided study materials: IDN, MK, JT, CJAP, SDR, PQ, MTS.
FUNDING
Support for these studies was provided by SenterNovem (IS052034), Aegon International Scholarship in Oncology, and Dutch Cancer Society (KWF-VU-2007-3832; KWF Fellowship 2013-5885). Support for these studies was also provided by CRUK/NIHR Experimental Cancer Medicine Centre and Yorkshire Cancer Research (L3547PA). Parts of this study were performed within the framework of CTMM, the Center for Translational Molecular Medicine, DeCoDe project (grant 03O-101) and the Dutch Colorectal Cancer Group (DCCG).
CONFLICTS OF INTEREST
LJWB, GT, BC and GAM are listed as inventors on a patent application titled “Methylation of dcr1 as predictive marker for drug response” (applicant MdxHealth SA, application number PCT/IB2013/002642, publication number WO2014064526 A3), but have no related financial interest.
WvC is listed as an inventor on a patent application titled “Methylation of dcr1 as predictive marker for drug response” (applicant MDxHealth SA, application number PCT/IB2013/002642, publication number WO2014064526 A3), and is an employee of and holds stock options in MDxHealth.
All other authors have nothing to declare
REFERENCES
1. Lievre A, Bachet JB, Boige V, Cayre A, Le CD, Buc E, Ychou M, Bouche O, Landi B, Louvet C, Andre T, Bibeau F, Diebold MD, et al. KRAS mutations as an independent prognostic factor in patients with advanced colorectal cancer treated with cetuximab. J Clin Oncol. 2008; 26:374-379.
2. Koopman M, Punt CJ. Chemotherapy, which drugs and when. Eur J Cancer. 2009; 45 Suppl 1:50-56.
3. Tol J, Punt CJ. Monoclonal antibodies in the treatment of metastatic colorectal cancer: a review. Clin Ther. 2010; 32:437-453.
4. Amado RG, Wolf M, Peeters M, Van CE, Siena S, Freeman DJ, Juan T, Sikorski R, Suggs S, Radinsky R, Patterson SD, Chang DD. Wild-type KRAS is required for panitumumab efficacy in patients with metastatic colorectal cancer. J Clin Oncol. 2008; 26:1626-1634.
5. Tol J, Koopman M, Cats A, Rodenburg CJ, Creemers GJ, Schrama JG, Erdkamp FL, Vos AH, van Groeningen CJ, Sinnige HA, Richel DJ, Voest EE, Dijkstra JR, et al. Chemotherapy, bevacizumab, and cetuximab in metastatic colorectal cancer. N Engl JMed. 2009; 360:563-572.
6. Agrelo R, Cheng WH, Setien F, Ropero S, Espada J, Fraga MF, Herranz M, Paz MF, Sanchez-Cespedes M, Artiga MJ, Guerrero D, Castells A, von KC, et al. Epigenetic inactivation of the premature aging Werner syndrome gene in human cancer. Proc Natl Acad Sci U S A. 2006; 103:8822-8827.
7. Nagasaka T, Sharp GB, Notohara K, Kambara T, Sasamoto H, Isozaki H, MacPhee DG, Jass JR, Tanaka N, Matsubara N. Hypermethylation of O6-methylguanine-DNA methyltransferase promoter may predict nonrecurrence after chemotherapy in colorectal cancer cases. Clin Cancer Res. 2003; 9:5306-5312.
8. Chen SP, Chiu SC, Wu CC, Lin SZ, Kang JC, Chen YL, Lin PC, Pang CY, Harn HJ. The association of methylation in the promoter of APC and MGMT and the prognosis of Taiwanese CRC patients. Genet Test Mol Biomarkers. 2009; 13:67-71.
9. Ogino S, Meyerhardt JA, Kawasaki T, Clark JW, Ryan DP, Kulke MH, Enzinger PC, Wolpin BM, Loda M, Fuchs CS. CpG island methylation, response to combination chemotherapy, and patient survival in advanced microsatellite stable colorectal carcinoma. Virchows Arch. 2007; 450:529-537.
10. Yacqub-Usman K, Richardson A, Duong CV, Clayton RN, Farrell WE. The pituitary tumour epigenome: aberrations and prospects for targeted therapy. Nat Rev Endocrinol. 2012; 8:486-494.
11. Sharma A, Vatapalli R, Abdelfatah E, Wyatt McMahon K, Kerner Z, A Guzzetta A, Singh J, Zahnow C, B Baylin S, Yerram S, Hu Y, Azad N, Ahuja N. Hypomethylating agents synergize with irinotecan to improve response to chemotherapy in colorectal cancer cells. PLoS One. 2017; 12:e0176139.
12. Koopman M, Antonini NF, Douma J, Wals J, Honkoop AH, Erdkamp FL, de Jong RS, Rodenburg CJ, Vreugdenhil G, Loosveld OJ, van BA, Sinnige HA, Creemers GJ, et al. Sequential versus combination chemotherapy with capecitabine, irinotecan, and oxaliplatin in advanced colorectal cancer (CAIRO): a phase III randomised controlled trial. Lancet. 2007; 370:135-142.
13. Seymour MT, Maughan TS, Ledermann JA, Topham C, James R, Gwyther SJ, Smith DB, Shepherd S, Maraveyas A, Ferry DR, Meade AM, Thompson L, Griffiths GO, et al. Different strategies of sequential and combination chemotherapy for patients with poor prognosis advanced colorectal cancer (MRC FOCUS): a randomised controlled trial. Lancet. 2007; 370:143-152.
14. Drucker E, Krapfenbauer K. Pitfalls and limitations in translation from biomarker discovery to clinical utility in predictive and personalised medicine. EPMAJ. 2013; 4:7.
15. Ioannidis JP. Biomarker failures. Clin Chem. 2013; 59:202-204.
16. Simon RM, Paik S, Hayes DF. Use of archived specimens in evaluation of prognostic and predictive biomarkers. J Natl Cancer Inst. 2009; 101:1446-1452.
17. Yi JM, Dhir M, Van Neste L, Downing SR, Jeschke J, Glockner SC, de Freitas Calmon M, Hooker CM, Funes JM, Boshoff C, Smits KM, van Engeland M, Weijenberg MP, et al. Genomic and epigenomic integration identifies a prognostic signature in colon cancer. Clin Cancer Res. 2011; 17:1535-1545.
18. Crider KS, Yang TP, Berry RJ, Bailey LB. Folate and DNA methylation: a review of molecular mechanisms and the evidence for folate’s role. Adv Nutr. 2012; 3:21-38.
19. Farias N, Ho N, Butler S, Delaney L, Morrison J, Shahrzad S, Coomber BL. The effects of folic acid on global DNA methylation and colonosphere formation in colon cancer cell lines. J Nutr Biochem. 2015; 26:818-826.
20. Jack J, Rotroff D, Motsinger-Reif A. Lymphoblastoid cell lines models of drug response: successes and lessons from this pharmacogenomic model. Curr Mol Med. 2014; 14:833-840.
21. Knijn N, Mekenkamp LJ, Klomp M, Vink-Borger ME, Tol J, Teerenstra S, Meijer JW, Tebar M, Riemersma S, van Krieken JH, Punt CJ, Nagtegaal ID. KRAS mutation analysis: a comparison between primary tumours and matched liver metastases in 305 colorectal cancer patients. Br J Cancer. 2011; 104:1020-1026.
22. Mekenkamp LJ, Haan JC, Israeli D, van Essen HF, Dijkstra JR, van CP, Punt CJ, Meijer GA, Nagtegaal ID, Ylstra B. Chromosomal copy number aberrations in colorectal metastases resemble their primary counterparts and differences are typically non-recurrent. PLoS One. 2014; 9:e86833.
23. Derks S, Postma C, Moerkerk PT, van den Bosch SM, Carvalho B, Hermsen MA, Giaretti W, Herman JG, Weijenberg MP, de Bruine AP, Meijer GA, van EM. Promoter methylation precedes chromosomal alterations in colorectal cancer development. Cell Oncol. 2006; 28:247-257.
24. Verbrugge I, Johnstone RW, Smyth MJ. SnapShot: extrinsic apoptosis pathways. Cell. 2010; 143:1192, 1192 e1191-1192.
25. Chaudhary PM, Eby M, Jasmin A, Bookwalter A, Murray J, Hood L. Death receptor 5, a new member of the TNFR family, and DR4 induce FADD-dependent apoptosis and activate the NF-kappaB pathway. Immunity. 1997; 7:821-830.
26. Venza M, Visalli M, Catalano T, Fortunato C, Oteri R, Teti D, Venza I. Impact of DNA methyltransferases on the epigenetic regulation of tumor necrosis factor-related apoptosis-inducing ligand (TRAIL) receptor expression in malignant melanoma. Biochem Biophys Res Commun. 2013; 441:743-750.
27. Haan JC, Labots M, Rausch C, Koopman M, Tol J, Mekenkamp LJ, van de Wiel MA, Israeli D, van Essen HF, van Grieken NC, Voorham QJ, Bosch LJ, Qu X, et al. Genomic landscape of metastatic colorectal cancer. Nat Commun. 2014; 5:5457.
28. Casparie M, Tiebosch AT, Burger G, Blauwgeers H, van de Pol A, van Krieken JH, Meijer GA. Pathology databanking and biobanking in The Netherlands, a central role for PALGA, the nationwide histopathology and cytopathology data network and archive. Cell Oncol. 2007; 29:19-24.
29. Braun MS, Richman SD, Quirke P, Daly C, Adlard JW, Elliott F, Barrett JH, Selby P, Meade AM, Stephens RJ, Parmar MK, Seymour MT. Predictive biomarkers of chemotherapy efficacy in colorectal cancer: results from the UK MRC FOCUS trial. J Clin Oncol. 2008; 26:2690-2698.
30. Buffart TE, Tijssen M, Krugers T, Carvalho B, Smeets SJ, Brakenhoff RH, Grabsch H, Meijer GA, Sadowski HB, Ylstra B. DNA quality assessment for array CGH by isothermal whole genome amplification. Cell Oncol. 2007; 29:351-359.
31. van Noesel MM, van BS, Salomons GS, Voute PA, Pieters R, Baylin SB, Herman JG, Versteeg R. Tumor-specific down-regulation of the tumor necrosis factor-related apoptosis-inducing ligand decoy receptors DcR1 and DcR2 is associated with dense promoter hypermethylation. Cancer Res. 2002; 62:2157-2161.
32. Cerami E, Gao J, Dogrusoz U, Gross BE, Sumer SO, Aksoy BA, Jacobsen A, Byrne CJ, Heuer ML, Larsson E, Antipin Y, Reva B, Goldberg AP, et al. The cBio cancer genomics portal: an open platform for exploring multidimensional cancer genomics data. Cancer Discov. 2012; 2:401-404.
33. Cancer Genome Atlas Research Network. Comprehensive molecular characterization of human colon and rectal cancer. Nature. 2012; 487:330-337.
34. Team RC. R: A language and environment for statistical computing. R foundation for statistical computing. Vienna. Austria. 2015. https://www.r-project.org/. 2014.
35. Harrel FE. rms: regression modeling strategies. R package version 4.3-1. https://cran.r-project.org/package=rms. 2015.
36. Therneau TM. A package for survival analysis in S. R package. version 2.37-7. https://cran.r-project.org/package=survival. 2014.
37. Therneau TM, Grambsch PM. (2000). Modeling Survival Data: Extending the Cox Model: Springer, New York.