
INTRODUCTION
Mitochondrial dysfunction constitutes one of the more distinctive characteristics of aging [1-6]. In human muscle, the activity of the mitochondrial enzymes responsible for energy production has been shown to decline progressively with age [2], accompanied by reduction in mitochondrial volume, altered mitochondrial morphology, increased oxidative stress, compromised proteostasis and accumulation of mitochondrial DNA mutations [7-10]. Similar phenomena have been observed in the nematode C. elegans. Body wall muscle mitochondria undergo progressive fragmentation with aging, together with a decrease in mitochondrial length and area, and an increase in mitochondrial circularity [4]. The mechanism and functional significance of this progressive mitochondrial alteration is still obscure, particularly because a series of C. elegans mutants with mild mitochondrial alterations have extended lifespan [11]. This apparent paradox - aging is accompanied by mitochondrial alterations, but mitochondrial alterations promote survival - is still unresolved, but probably depends on the activation of specific survival pathways following early mitochondrial alteration [12-16].
Mitochondria have a central role in cellular energetics and ATP production, and one of the main modulators of these pathways is the Ca2+ ion. When cells are activated, the [Ca2+] rises first in the cytosol and then enters the mitochondria through the mitochondrial Ca2+ uniporter, activating several key dehydrogenases to boost substrate oxidation and ATP production [17-19]. Then, when cells return to the resting state, Ca2+ is extruded from mitochondria through Na+/Ca2+ or H+/Ca2+ exchangers [20, 21]. This transient mitochondrial Ca2+ uptake is driven by the mitochondrial membrane potential, and therefore reflects in some way the functional state of mitochondria. In addition, the exchangers responsible of Ca2+ release from mitochondria are thought to be electrogenic (i.e., stoichiometry 3Na+/1Ca2+) and thus they are also driven by the membrane potential. Therefore, both mitochondrial Ca2+ uptake and release are energized by the mitochondrial membrane potential.
We have decided to monitor mitochondrial [Ca2+] ([Ca2+]M) dynamics in C. elegans pharynx in vivo during aging, in order to study if the progressive mitochondrial alteration induces changes in [Ca2+]M dynamics. We have targeted a yellow cameleon YC3.60 Ca2+ sensor [22] to the mitochondrial matrix of C. elegans pharynx using the myo-2 promoter and a mitochondrial targeting presequence. Using this probe we have measured for the first time mitochondrial Ca2+ dynamics in C. elegans pharynx, both in wild type worms and in mitochondrial complex I nuo-6 mutants. Our data show that [Ca2+]M is able to undergo fast oscillations during pharynx pumping, with a frequency similar to the cytosolic [Ca2+] oscillations ([Ca2+]C) we have previously reported [23]. In addition, prolonged “square-wave” [Ca2+]M elevations were also observed, similar to those we have previously described in cytosolic [Ca2+] [23], and they were also more frequent in young worms. [Ca2+]M oscillations were observed with similar frequency along the whole life of the worms, both in control worms and in nuo-6 mutants, although both width and height decreased with age. In addition, [Ca2+]M oscillations in nuo-6 mutant worms showed reduced height and frequency, and increased width, compared with wild-type worms.
RESULTS
Generation of the mitochondrially-targeted Ca2+ sensor
To monitor mitochondrial [Ca2+], control N2 C. elegans nematodes were microinjected with the plasmid for expression of mitochondrially-targeted YC3.60 in pharynx under the myo-2 promoter. The transformed strain, named AQ3055, showed fluorescence in the pharynx with a typical striped mitochondrial distribution when analyzed by confocal microscopy (Figure 1a). Note the difference with the more homogeneous fluorescence of the cytosolic YC3.60 sensor expressed under the same promoter (Figure 1b). In addition, this fluorescence colocalized with that of mitotracker deep red (Figure 1c), indicating a correct mitochondrial localization of the Ca2+ sensor. Note that YC3.60 labels only pharynx mitochondria, while mitotracker deep red is not specific for the pharynx and labels mitochondria in every cell.
We have also studied mitochondrial Ca2+ signaling in respiratory chain complex I nuo-6 mutants. nuo-6 mutants expressing the mitochondrially-targeted Ca2+-sensitive protein (named here as Mnuo-6) were obtained by crossing AQ3055 worms with nuo-6 (qm200) mutants [24], obtained from the Caenorhabditis Genetics Center. Figures 1d and 1e show two confocal planes of the YC3.60 fluorescence in the Mnuo-6 mutants, showing also a typical mitochondrial pattern, which colocalized with mitotracker deep red. Therefore, the Ca2+ sensor is correctly targeted to the mitochondria also in this strain.
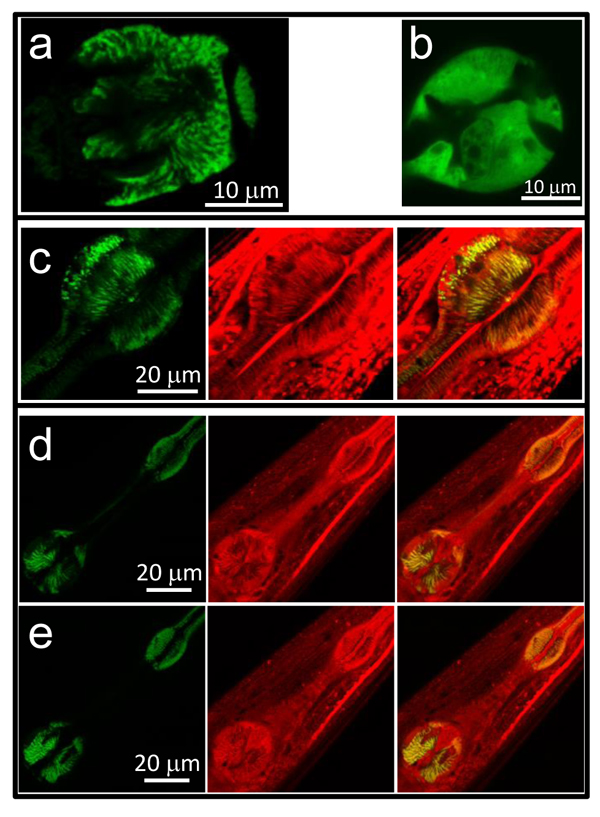
Figure 1: Confocal images of AQ3055, AQ3059 and Mnuo-6 worms. Panel a. shows an image of the fluorescence of the terminal bulb in an AQ3055 worm expressing the mitochondrially-targeted YC3.60 Ca2+ sensor. Panel b. shows an image of the fluorescence of the terminal bulb in an AQ3059 worm expressing the cytosolic YC3.60 Ca2+ sensor. Panel c. shows images of the AQ3055 worm loaded with mitotracker deep red. The images show the YC3.60 fluorescence (left) the mitotracker deep red fluorescence (middle) and the merge of both (right). Panels d. and e. show two confocal planes of a Mnuo-6 worm loaded with mitotracker deep red. The images show in each case the YC3.60 fluorescence (left) the mitotracker deep red fluorescence (middle) and the merge of both (right).
Mitochondrial Ca2+ dynamics in wild-type worms during aging
[Ca2+]M was first monitored in the AQ3055 C. elegans strain, in live worms glued to the agar pad and subjected to stimulation of pharynx pumping with serotonin, as described previously [23]. Figure 2 shows several representative traces of [Ca2+]M dynamics monitored continuously at 2.5Hz for 30 min in live worms of 2, 5, 8 and 12 days old. The left panels show typical 30 min records of [Ca2+]M dynamics obtained in different worms, two of them for every age. The middle panels show 5 min records taken each one from the insets in the corresponding left panels expanded. The right panels show 1 min records taken again each one from the insets in the corresponding middle panel expanded. The traces show that [Ca2+]M undergoes rapid and persistent oscillations similar to those we have previously described in cytosolic [Ca2+] [23]. In addition, some worms had large and persistent increases in [Ca2+]M, that in some cases could last for many minutes until the end of the experiment (see 2nd trace of day 2) or in other cases could be shorter and reversible (see 2nd trace of day 5 and 1st trace of day 8). Similar prolonged increases in [Ca2+]M were also found in cytosolic [Ca2+], where we called them “square-wave” [Ca2+] increases [23]. Therefore, cytosolic and mitochondrial [Ca2+] dynamics behave similarly, suggesting that [Ca2+]M in the pharynx directly follows the dynamics of cytosolic [Ca2+], responding with fast [Ca2+]M oscillations when cytosolic [Ca2+] is oscillating, and with persistent increases in [Ca2+]M when cytosolic [Ca2+] keeps persistently high.
To obtain more information on the complex [Ca2+]M dynamics data obtained, we have made a series of experiments like those shown in Figure 2 in 29-35 worms of every age, and then we have made a detailed computer analysis of the main characteristics of each Ca2+ transient measured. As described previously [23], our analysis provides information on the width, the height and the frequency of every [Ca2+] peak in our experiments. Then, we can pool together all the data corresponding to every age and follow the evolution with the age of every parameter.
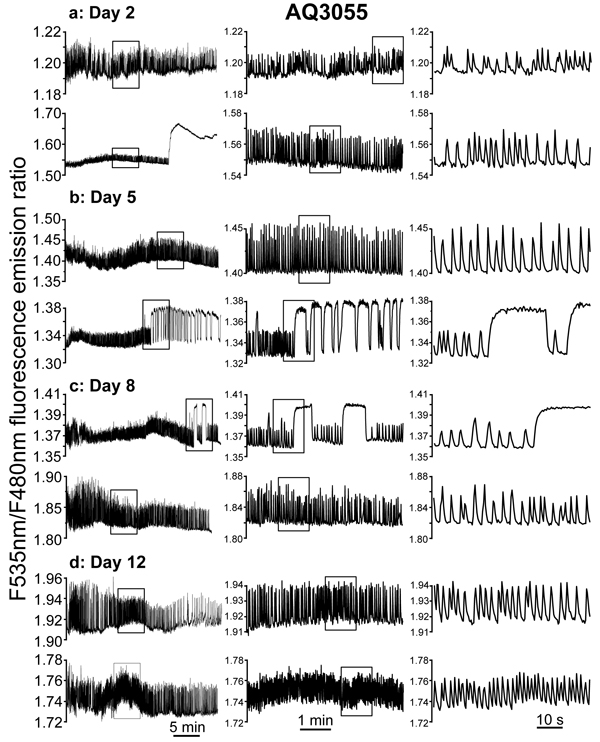
Figure 2: Representative traces of [Ca2+]M dynamics in pharynx of C. elegans. AQ3055 (N2 worms expressing the mitochondrial Ca2+ sensor) worms of 2 panel a., 5 panel b., 8 panel c. and 12 panel d. days old. Each panel shows two typical experiments performed in worms of a given age. The insets in the left panels are shown expanded in the middle panels, and the insets in the middle panels are shown expanded in the right panels.
Figure 3, panels a-d, shows plots of peak height against peak width for all the [Ca2+]M peaks obtained in AQ3055 worms of day 2, 5, 8 and 12 of adult life. In this plot, the prolonged “square-wave” [Ca2+]M peaks correspond to the points having larger width, those placed at the right of every graph (note the logarithmic scale). As previously shown for the cytosolic [Ca2+] peaks, the proportion of long “square-wave” [Ca2+]M peaks was higher in young worms (day 2) and decreased progressively as they get older (day 12). As shown before for cytosolic [Ca2+] [23], many of these long [Ca2+]M peaks started at some point along the experiment and stayed at high [Ca2+] until the end of the experiment (as shown in Figure 2, 2nd trace of day 2). We have hypothesized that these long peaks are due to energy depletion of the pharynx cells, although paradoxically they occur more frequently in younger worms. Figure 3e shows the variation of the percentage of worms having long “square-wave” [Ca2+]c (AQ2038 strain) or [Ca2+]M (AQ3055 strain) peaks during aging. Very similar values were obtained when either [Ca2+]c or [Ca2+]M was measured. This could be expected, because a persistent increase in [Ca2+]c should also induce a large [Ca2+] accumulation inside mitochondria. The [Ca2+]c data in this and the following panels correspond to experiments performed in the AQ2038 strain at 2.5Hz image rate.
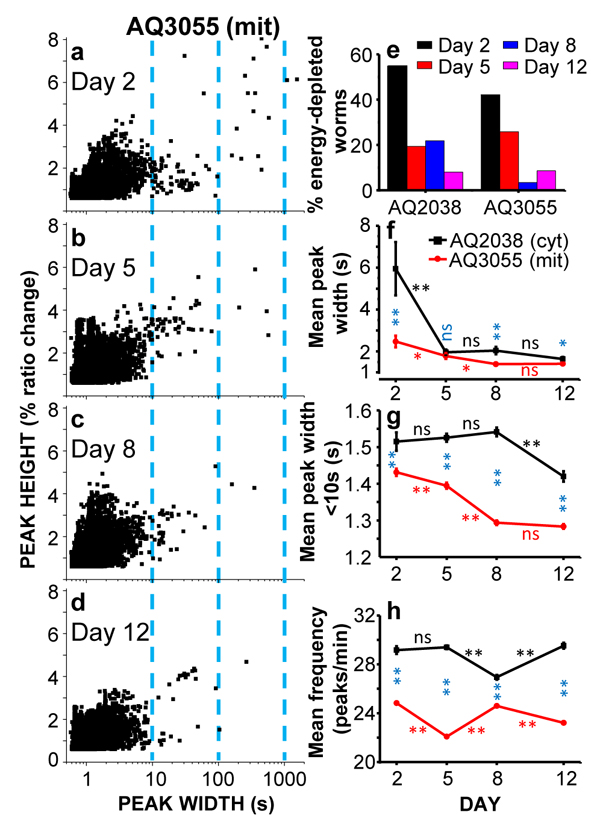
Figure 3: Comparative analysis of [Ca2+]C and [Ca2+]M dynamics in AQ2038 (N2 worms expressing the cytosolic [Ca2+] sensor) or AQ3055 (N2 worms expressing the mitochondrial Ca2+ sensor) worms of 2, 5, 8 and 12 days old, at 2.5Hz image resolution. Panels a-d show plots of peak height against peak width for all the [Ca2+]M peaks analyzed in AQ3055 worms of 2 (panel a., 8414 peaks from 38 worms studied), 5 (panel b., 9365 peaks from 29 worms studied), 8 (panel c., 10802 peaks from 29 worms studied) and 12 (panel d., 11232 peaks from 35 worms studied) days old. Panel e. shows the percentage of worms considered as energy-depleted because the [Ca2+]c or [Ca2+]M record shows or ends in prolonged “square wave” [Ca2+] peaks. Panels f.-h. show the variation with worm age of the main parameters analyzed in the Ca2+ imaging experiments performed in AQ2038 and AQ3055 worms: mean peak width (panel f), mean peak width considering only peaks with width < 10s (panel g) and mean peak frequency (panel h). Significance was obtained by the ANOVA test (*, p < 0,05; **, p < 0,001; ns, not significant) comparing: i) the [Ca2+]C and [Ca2+]M data of the same day (blue symbols), ii) the [Ca2+]C data of every two consecutive days (black symbols) and iii) the [Ca2+]M data of every two consecutive days (red symbols).
The decrease with the age in the number of long [Ca2+]M peaks can be seen also when we calculate the mean width of all the [Ca2+]M peaks obtained at every age. Panel f shows the evolution of the mean peak width with worm age, comparing the data obtained in pharynx cytosolic [Ca2+] in the AQ2038 strain with those obtained in pharynx mitochondrial [Ca2+] in the AQ3055 strain. The mean peak width of [Ca2+]M peaks was smaller than the corresponding one of [Ca2+]C at every age, but it followed the same decreasing trend with age. This decrease was mainly due to the disappearance of the long “square-wave” [Ca2+] peaks, because when the mean width was calculated using only the [Ca2+] peaks having a width smaller than 10s (Figure 3g), the changes with age were much smaller. In any case, the mean peak width of the [Ca2+]M peaks was always smaller than that of the [Ca2+]C peaks and decreased further during aging. Part of this effect may be due to the fact that mitochondria takes up Ca2+ from the cytosol with low Ca2+-affinity, hence mitochondrial Ca2+ uptake only occurs when [Ca2+]c is above certain values.
The frequency of the [Ca2+] peaks was little modified with age, both in the case of [Ca2+]C and [Ca2+]M
measurements (Figure 3h). However, the frequency of the [Ca2+]M peaks was about 20% smaller than that of the [Ca2+]C peaks at every age. This may probably be due to the presence of [Ca2+]C peaks which are too small to evoke a significant [Ca2+]M response.
Mitochondrial Ca2+ dynamics in mutant nuo-6 worms
We have then performed similar experiments with nuo-6 respiratory chain mutants (Mnuo-6 strain) expressing the mitochondrial [Ca2+] probe. Probably because of the slower rate of development of these mutant worms, the level of fluorescence of the probe was very small at day 2 of adult life, so that measurements were too noisy at that age. By this reason, in this strain we have performed measurements only at days 5, 8 and 12 of adult life. Figure 4 shows a series of typical [Ca2+]M records obtained in this mutant strain at 5, 8 and 12 days of adult life. The traces show that mitochondrial Ca2+ oscillations are still present and are apparently very similar to the control ones (compare Figures 2 and 4). In addition, some prolonged “square wave” [Ca2+]M increases could also be observed (see 2nd trace of day 5). Therefore, in spite of the reduced mitochondrial respiratory chain function of the nuo-6 strain [13,24], the main patterns of [Ca2+]M dynamics were similar to those in the controls. However, a more detailed analysis including data from 23-36 different worms of every age uncovered significant differences.
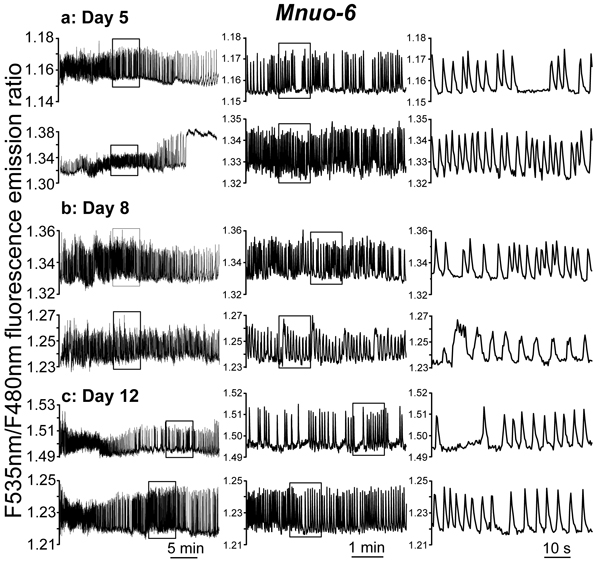
Figure 4: Representative traces of [Ca2+]M dynamics in pharynx of C. elegans Mnuo-6 worms. (nuo-6 mutant worms expressing the mitochondrial Ca2+ sensor) of 5 panel a., 8 panel b. and 12 panel c. days old. Each panel shows two typical traces obtained in worms of a given age, using different time scales in the middle and right panels to expand the insets and appreciate better the dynamics.
Figure 5 shows a comparative analysis of the [Ca2+]M peaks obtained in the AQ3055 (mitochondrial probe in control worms) and Mnuo-6 strains (mitochondrial probe in nuo-6 mutants). Panels a-c show the plots of peak height against peak width in Mnuo-6 mutant worms of days 5, 8, and 12 of adult life. As in the controls (see Figure 3), the proportion of long “square-wave” [Ca2+]M transients decreased with age, but the percent of worms categorized as energy-depleted was smaller at every age (Figure 5d). This is consistent with our previous [Ca2+]C data in nuo-6 worms [23], which also showed a reduced percentage of energy-depleted nuo-6 worms compared with the controls at every age. On the other hand, the mean peak width of the [Ca2+]M peaks was larger in the nuo-6 mutant worms than in the controls at days 5 and 8, and similar at day 12 (Figure 5e). The same happened with the mean peak width calculated excluding the [Ca2+]M peaks longer than 10s (Figure 5f), and these data follow exactly the same pattern we have previously described for the [Ca2+]C peaks in the nuo-6 mutant strain compared with the control [23]. Therefore, nuo-6 worms have wider [Ca2+]C and [Ca2+]M peaks than controls at days 5 and 8 of adult life, and return to the control values at day 12. There were also significant differences in the frequency of the [Ca2+]M peaks (Figure 5g), which was much smaller in nuo-6 mutant worms than in the controls at every age, as occurs also with the frequency of the [Ca2+]C peaks [23]. Finally, the height of the [Ca2+]M peaks, was also smaller in nuo-6 mutant worms than in the controls at every age (Figure 5h).
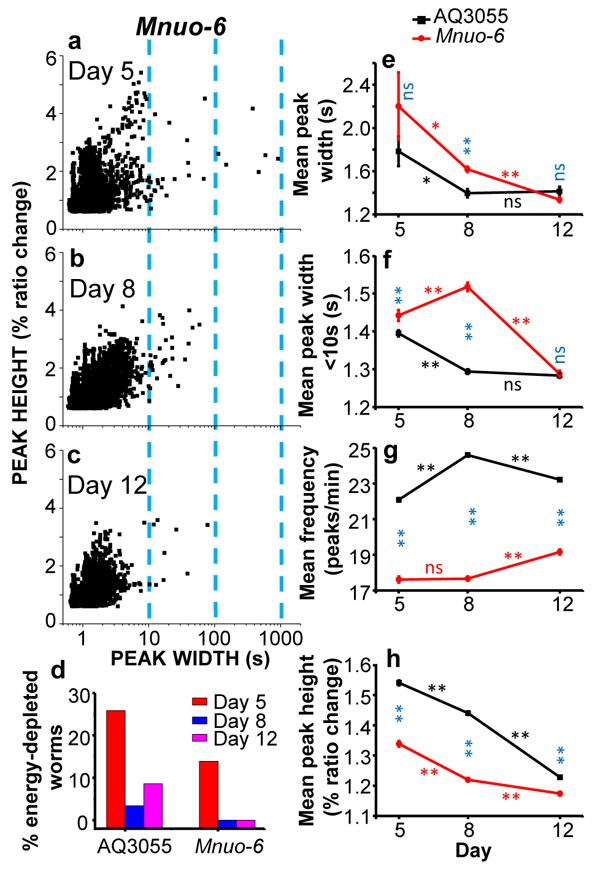
Figure 5: Comparative analysis of [Ca2+]M dynamics in AQ3055 or Mnuo-6 worms of 5, 8 and 12 days old. Panels a.-c. show plots of peak height against peak width for all the [Ca2+]M peaks analyzed in Mnuo-6 worms of 5 (panel a, 4016 peaks from 36 worms studied), 8 (panel b, 5512 peaks from 28 worms studied) and 12 (panel d, 4430 peaks from 23 worms studied) days old. Panel d. shows the percentage of worms considered as energy-depleted in each case. The other panels e.-h. compare the evolution with age of the main parameters analyzed in both types of worms, AQ3055 and Mnuo-6: mean peak width (panel e), mean peak width considering only peaks with width < 10s (panel f), mean peak frequency (panel g) and mean peak height (panel h). Significance was obtained by the ANOVA test (*, p < 0,05; **, p < 0,001; ns, not significant) comparing: i) the control and mutant nuo-6 [Ca2+]M data of the same day (blue symbols), ii) the control [Ca2+]M data of every two consecutive days (black symbols) and iii) the mutant nuo-6 [Ca2+]M data of every two consecutive days (red symbols).
Age-dependence of the frequency of pharynx [Ca2+]M oscillations
The dynamics of [Ca2+]M spiking along the experiments is better appreciated by looking at the variation of the frequency of oscillation during the 30 minutes of experiment. Figure 6 shows the individual frequency data accumulated for all the worms studied of every age. Each point represents the frequency value assigned to each peak, as described in Methods, and the time the peak appeared within the 30 min experiment. Panels a-c correspond to the [Ca2+]M data obtained in control AQ3055 worms, and show that the frequency kept quite stable for the whole time of the experiment, with maximum frequencies near 60 peaks/min. Therefore, mitochondria were able to maintain high frequencies of [Ca2+] oscillation for very long times in vivo. In the case of the Mnuo-6 mutant worms (panels d-f), it is apparent that the frequency was smaller than in the controls. Many worms were still able to keep oscillations until the end of the 30 minutes, as shown in Figure 4, but there was some decay in the frequency along the experiment. This was mainly due to some worms that stopped [Ca2+]M oscillations before the end of the experiment. The same behavior was found for the [Ca2+]C oscillations in nuo-6 mutant worms (data not shown), indicating that the decay of the [Ca2+]M oscillations may be just a consequence of the decay in the [Ca2+]C oscillations. In these cases, when [Ca2+] oscillations stop, [Ca2+]C and [Ca2+]M stay at resting levels and thus it cannot be attributed to energy depletion in the pharynx, but to some other reason that affects transmission of the pumpìng signal to the pharynx.
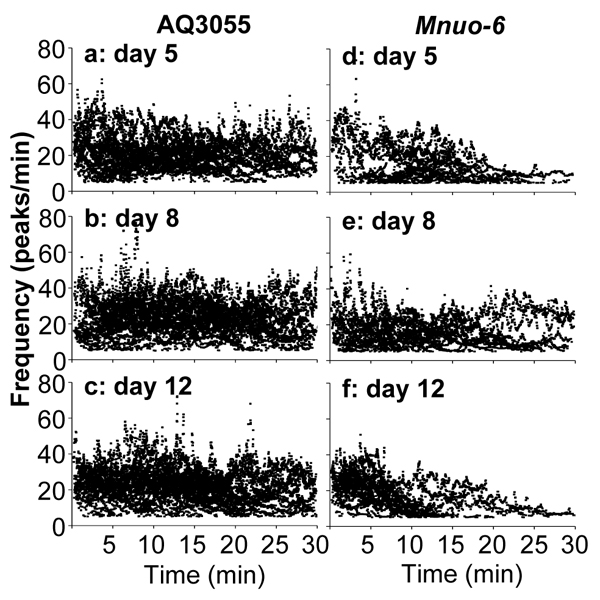
Figure 6: Evolution of the [Ca2+]M oscillation frequency along the experiments. Each point indicates the individual frequency value assigned to each peak as described in Methods, and the time point corresponding to that peak within the experiment. Panels a.-c. correspond to AQ3055 worms of 5, 8 and 12 days old, respectively. Panels d.-f. correspond to Mnuo-6 worms of 5, 8 and 12 days old, respectively.
DISCUSSION
As far as we know, the data we present in this paper constitute the first measurements of the dynamics of mitochondrial [Ca2+] in the pharynx of live C. elegans worms. Our data show the behavior of C. elegans pharynx [Ca2+]M dynamics for long periods of time, and how it may depend on the worm age and on the presence of a respiratory chain complex I mutation. Mitochondrial [Ca2+] has been measured previously in worm hypodermis [25].
The first conclusion we can draw from our data is that mitochondrial [Ca2+] is able to oscillate at high frequency, reproducing the oscillations of cytosolic [Ca2+]. We have recorded frequencies of [Ca2+]M oscillation up to 1Hz. This point is important because the C. elegans pharynx is a neuromuscular organ which has been compared to the heart because it has similar electrical properties and its development is controlled by similar genes [26]. Mitochondrial [Ca2+] signaling in the heart is controversial because there are now two different models to explain how the [Ca2+]C oscillations are translated to mitochondria. One of the models suggests that mitochondria rapidly follow “beat-to-beat” the oscillations in [Ca2+]C, while the other model proposes that [Ca2+]M only reflects a slow integration of the [Ca2+]C transients [27]. The two models predict very different [Ca2+]M kinetics in response to the repetitive cytosolic [Ca2+] spikes, either repetitive [Ca2+]M spikes in the first model or a slow progressive increase in the second. Our data clearly show that the C. elegans pharynx mitochondria behave in a “beat-to-beat” mode, indicating that Ca2+ uptake and release from the mitochondria are fast enough to recover the resting levels after each Ca2+ spike. This point has several physiological implications. On the first place, energy consumption is higher with this model, because both Ca2+ uptake and release by mitochondria consume mitochondrial membrane potential. In addition, larger amounts of Ca2+ are taken up by mitochondria during each [Ca2+]c spike, so that mitochondrial Ca2+ buffering may potentially become an important regulator of cytosolic [Ca2+] and thus, of contraction.
When we examine in detail the parameters of the [Ca2+]M peaks, we find that they show a smaller width and frequency with respect to the [Ca2+]C peaks. Considering only the [Ca2+] peaks having a width smaller than 10s at all ages, the peak width of the [Ca2+]M peaks was 11.1±0.6% (mean±s.e.) smaller than that of the corresponding [Ca2+]C
peaks. Similarly, pooling all the frequency data at every age together, the frequency of the [Ca2+]M peaks was 17.3±0.5% (mean±s.e.) smaller than that of the corresponding [Ca2+]C peaks. In both cases, the difference was highly significant (p < 0.001). This may be due to the low Ca2+-affinity of the mitochondrial Ca2+ uniporter [20, 28], that may open only when [Ca2+]c is near the peak levels, thus reducing the time mitochondrial Ca2+ uptake is active. The decrease in frequency could also be attributed to the presence of [Ca2+]C peaks too small to evoke any mitochondrial Ca2+ uptake. On the other hand, we find that the [Ca2+]M oscillation frequency hardly changes during aging, but there is however a progressive reduction in the width and amplitude of the [Ca2+]M peaks with the age. Our data therefore indicate that mitochondrial Ca2+ fluxes in C. elegans pharynx are progressively reduced during aging, although mitochondria keep able to follow “beat-to-beat” the cytosolic [Ca2+] oscillations.
Together with the fast [Ca2+]M oscillations, we could also find prolonged elevations of [Ca2+]M similar to the “square-wave” [Ca2+]C increases we have recently reported [23]. Many of them also lasted for many minutes and sometimes [Ca2+]M stayed high for the rest of the experiment. The proportion of worms undergoing “square-wave” [Ca2+]C or [Ca2+]M increases decayed in parallel with the age, suggesting that they are both directly linked. Our hypothesis is that these long [Ca2+] transients can be attributed to energy depletion, which would arrest Ca2+ pumps and thus keep [Ca2+]C high, leading then also to mitochondrial Ca2+ accumulation. If energy depletion is transient, cells may recover and restart spiking, but if it is persistent, the increased [Ca2+]M may induce cellular damage by triggering ROS production or by activating apoptotic pathways. Energy depletion would be a consequence of the increased energy consumption during the experiment due to serotonin-induced accelerated pharynx pumping. The meaning of these “square-wave” [Ca2+]C or [Ca2+]M increases would be therefore that in these worms energy production is unable to cope with the increased energy consumption at some point during the 30 min of the experiment.
Nuo-6 worms have a mutation in the respiratory chain complex I that produces reduced mitochondrial function, lower oxygen consumption, slow growth, slow movement [24] and decreased ATP levels [13]. In spite of these functional defects, mitochondria were able to display beat-to-beat [Ca2+]M oscillations coupled to the [Ca2+]C dynamics also in these worms. However, [Ca2+]M
oscillations in nuo-6 mutant worms were slightly wider, and had smaller amplitude and frequency than in the controls, suggesting reduced Ca2+ fluxes in and out of the mitochondria. Nuo-6 worms also had a reduced number of “square-wave” [Ca2+]C and [Ca2+]M increases at every age. This phenomenon could be due to the smaller rate of energy consumption in these mutants, which may balance the decreased rate of energy production.
MATERIALS AND METHODS
C. elegans strains and maintenance
Strains used were: AQ2038, integrated strain expressing cytosolic yellow cameleon 2.1. (YC2.1) on pharynx cells due to the promoter sequence of the myo-2 gene (pmyo-2::YC2.1) [22, 29, 30]. AQ3059, strain expressing cytosolic yellow cameleon 3.60 (YC3.60) as extrachromosomal array on pharynx, under the myo-2 promoter (pmyo-2::YC3.60). AQ3055, strain expressing mitochondrially-targeted yellow cameleon 3.60 (YC3.60) as extrachromosomal array on pharynx, also under the myo-2 promoter (pmyo-2::2mt8::YC3.60). A signal peptide composed of the first 36 amino acids of subunit VIII of human COX, inserted in duplicate before YC3.60 [31], was used for mitochondrial targeting. Mutant nuo-6 strains expressing the mitochondrially-targeted YC3.60 (named Mnuo-6 strain) were obtained by crossing AQ3055 worms with nuo-6 (qm200) ones [24], obtained from the Caenorhabditis Genetics Center.
Handling of the worms was as previously described [32]. All the strains were grown at 20ºC on hardened agar seeded with Escherichia coli (OP50). Calcium imaging experiments were also carried out at 20oC on synchronized worms. Eggs obtained as described previously [32] were transferred to OP50-seeded NGM plates. For synchronization, young adults (day 1) were transferred to plates containing 15µM FUDR to avoid progeny.
Calcium imaging
Pharynx Ca2+ measurements were carried out as previously described [23], at days 2, 5, 8 and 12 of worm life. Briefly, worms were starved for 4 - 6 hours before the experiments. Then, they were glued (Dermabond Topical Skin Adhesive, Johnson & Johnson) on an agar pad (2% agar in M9 buffer) made on a coverslip, and 5mg/ml of serotonin was added to stimulate pumping [23, 33, 34]. The coverslip containing the glued worm was mounted in a chamber in the stage of a Zeiss Axiovert 200 inverted microscope. Fluorescence was excited at 430 nm using a Cairn monochromator (4nm bandwidth for the cytosolic Ca2+ sensor in AQ2038, 7 nm bandwidth for the mitochondrial sensor in AQ3055 and Mnuo-6, continuous excitation) and images of the emitted fluorescence obtained with a Zeiss C-apochromat 40x1,2 W objective were collected using a 450nm long pass dichroic mirror and a Cairn Optosplit II emission image splitter to obtain separate images at 480nm and 535nm emission. The splitter contained emission filters DC/ET480/40m and DC/ET535/30m, and the dichroic mirror FF509-FDi01-25x36 (all from Chroma Technology). Simultaneous 200ms images at the two emission wavelengths were recorded continuously (2.5Hz image rate) by a Hamamatsu ORCA-ER camera, in order to obtain 535nm/480nm fluorescence ratio images values of a region of interest enclosing the pharynx terminal bulb. The time resolution used here is therefore higher (2.5Hz) than that used previously (1.5Hz, see [23] Alvarez-Illera et al., 2016), and that allowed recording higher frequencies of oscillation. Thus, the cytosolic [Ca2+] measurements included here correspond to new experiments performed in the AQ2038 strain at 2,5Hz time resolution. Experiments were performed at 20ºC and carried on during 30 minutes of continuous recording.
For confocal imaging, worms anesthetized with 10mM tetramisole were imaged on a Leica TCS SP5 confocal microscope. YC3.60 fluorescence was excited at 488nm, and the fluorescence emitted between 500 and 554 nm was collected. Mitotracker Deep Red FM (Invitrogen, Catalog number M22426) was excited at 644nm, and the fluorescence emitted between 657 and 765nm was collected. Mitotracker deep red was loaded by incubating the worms for 2h with 10µM of the dye in M9 buffer.
Data analysis
Fluorescence was recorded and analyzed using the Metafluor program (Universal Imaging). The traces shown are the 535nm/480nm fluorescence emission ratio values of a region of interest enclosing the pharynx terminal bulb. [Ca2+] peaks in the ratio were only considered acceptable when inverted changes at both wavelengths were clearly observed. Fluorescence intensities and ratio changes were then analyzed with a specific algorithm designed to calculate off-line the width at mid-height expressed in seconds, the height obtained as percent of ratio change and the frequency of all the Ca2+ peaks in each experiment. The frequency was measured at each peak as 9 divided by the distance among the peak 4 positions before and the peak 4 positions after. The mean frequency was calculated as the mean of all the individual frequencies higher than 5 peaks/min obtained in worms of a given age and condition.
ACKNOWLEDGMENTS
We thank Drs. R. Branicky, M. Chatzigeorgiou and W.R. Schafer for help with the development of the AQ3055 strain and for hosting a short stay of M.M. at the MRC Laboratory of Molecular Biology, Cambridge, UK, supported by a fellowship from the Spanish Government. We thank the Caenorhabditis Genetics Center for providing the nuo-6 (qm200) strain. This work was supported by a grant from the Spanish Ministerio de Economía y Competitividad [BFU2014-55731-R]. PG-C had a FPI fellowship from Ministerio de Economía y Competitividad. JA-d-V had a fellowship from Junta de Castilla y León (JCyL). We thank technical assistance from Marta Delgado, supported from Junta de Castilla y León (JCyL) and Fondo Social Europeo (FSE).
CONFLICTS OF INTEREST
None.
Funding
This work was supported by a grant from the Spanish Ministerio de Economía y Competitividad [BFU2014-55731-R].
REFERENCES
1. Picard M, Ritchie D, Wright KJ, Romestaing C, Thomas MM, Rowan SL, Taivassalo T, Hepple RT. Mitochondrial functional impairment with aging is exaggerated in isolated mitochondria compared to permeabilized myofibers. Aging Cell. 2010; 9:1032-1046.
2. Marzetti E, Calvani R, Cesari M, Buford TW, Lorenzi M, Behnke BJ, Leeuwenburgh C. Mitochondrial dysfunction and sarcopenia of aging: from signaling pathways to clinical trials. Int J Biochem Cell Biol. 2013; 45:2288-2301.
3. Siegel MP, Kruse SE, Percival JM, Goh J, White CC, Hopkins HC, Kavanagh TJ, Szeto HH, Rabinovitch PS, Marcinek DJ. Mitochondrial-targeted peptide rapidly improves mitochondrial energetics and skeletal muscle performance in aged mice. Aging Cell. 2013; 12:763-771.
4. Regmi SG, Rolland SG, Conradt B. Age-dependent changes in mitochondrial morphology and volume are not predictors of lifespan. Aging (Albany NY). 2014; 6:118-130. doi: 10.18632/aging.100639.
5. Runkel ED, Baumeister R, Schulze E. Mitochondrial stress: balancing friend and foe. Exp Gerontol. 2014; 56:194-201.
6. Morsci NS, Hall DH, Driscoll M, Sheng ZH. Age-Related Phasic Patterns of Mitochondrial Maintenance in Adult Caenorhabditis elegans Neurons. J Neurosci. 2016; 36:1373-1385.
7. Lee CM, Lopez ME, Weindruch R, Aiken JM. Association of age-related mitochondrial abnormalities with skeletal muscle fiber atrophy. Free Radic Biol Med. 1998; 25:964-972.
8. Bua EA, McKiernan SH, Wanagat J, McKenzie D, Aiken JM. Mitochondrial abnormalities are more frequent in muscles undergoing sarcopenia. J Appl Physiol. 2002; 92:2617-2624.
9. Kimura K, Tanaka N, Nakamura N, Takano S, Ohkuma S. Knockdown of mitochondrial heat shock protein 70 promotes progeria-like phenotypes in caenorhabditis elegans. J Biol Chem. 2007; 282:5910-5918.
10. Cheema N, Herbst A, McKenzie D, Aiken JM. Apoptosis and necrosis mediate skeletal muscle fiber loss in age-induced mitochondrial enzymatic abnormalities. Aging Cell. 2015; 14:1085-1093.
11. Munkácsy E, Rea SL. The paradox of mitochondrial dysfunction and extended longevity. Exp Gerontol. 2014; 56: 221-233.
12. Shore DE, Carr CE, Ruvkun G. Induction of cytoprotective pathways is central to the extension of lifespan conferred by multiple longevity pathways. PLoS Genetics. 2012; 8:e1002792.
13. Yee C, Yang W, Hekimi S. The intrinsic apoptosis pathway mediates the pro-longevity response to mitochondrial ROS in C. elegans. Cell. 2014; 157:897-909.
14. Palikaras K, Lionaki E, Tavernarakis N. Coupling mitogenesis and mitophagy for longevity. Autophagy. 2015; 11:1428-1430.
15. Tian Y, Garcia G, Bian Q, Steffen KK, Joe L, Wolff S, Meyer BJ, Dillin A. Mitochondrial Stress Induces Chromatin Reorganization to Promote Longevity and UPR(mt). Cell. 2016; 165:1197-1208.
16. Merkwirth C, Jovaisaite V, Durieux J, Matilainen O, Jordan SD, Quiros PM, Steffen KK, Williams EG, Mouchiroud L, Tronnes SU, Murillo V, Wolff SC, Shaw RJ, et al. Two Conserved Histone Demethylases Regulate Mitochondrial Stress-Induced Longevity. Cell. 2016; 165:1209-1223.
17. McCormack JG, Halestrap AP, Denton RM. Role of calcium ions in regulation of mammalian intramitochondrial metabolism. Physiol Rev. 1990; 70:391-425.
18. Robb-Gaspers LD, Burnett P, Rutter GA, Denton RM, Rizzuto R, Thomas AP. Integrating cytosolic calcium signals into mitochondrial metabolic responses. EMBO J. 1998; 17:4987-5000.
19. Jouaville LS, Pinton P, Bastianutto C, Rutter GA, Rizzuto R. Regulation of mitochondrial ATP synthesis by calcium: evidence for a long-term metabolic priming. Proc Natl Acad Sci USA. 1999; 96:13807-13812.
20. Bernardi P. Mitochondrial transport of cations: channels, exchangers, and permeability transition. Physiol Rev. 1999; 79:1127-1155.
21. Palty R, Silverman WF, Hershfinkel M, Caporale T, Sensi SL, Parnis J, Nolte C, Fishman D, Shoshan-Barmatz V, Herrmann S, Khananshvili D, Sekler I. NCLX is an essential component of mitochondrial Na+/Ca2+ exchange. Proc Natl Acad Sci USA. 2010; 107:436-441.
22. Nagai T, Yamada S, Tominaga T, Ichikawa M, Miyawaki A. Expanded dynamic range of fluorescent indicators for Ca2+ by circularly permuted yellow fluorescent proteins. Proc Natl Acad Sci U S A. 2004; 101:10554-10559.
23. Alvarez-Illera P, Sanchez-Blanco A, Lopez-Burillo S, Fonteriz RI, Alvarez J, Montero M. Long-term monitoring of Ca2+ dynamics in C. elegans pharynx: an in vivo energy balance sensor. Oncotarget. 2016; 7:67732-67747. doi:10.18632/oncotarget.12177.
24. Yang W, Hekimi S. Two modes of mitochondrial dysfunction lead independently to lifespan extension in Caenorhabditis elegans. Aging Cell. 2010; 9:433-447.
25. Xu S, Chisholm AD. C. elegans epidermal wounding induces a mitochondrial ROS burst that promotes wound repair. Dev. Cell. 2014; 31:48-60.
26. Olson EN. Gene Regulatory Networks in the Evolution and Development of the Heart. Science. 2006; 313:1922-1927.
27. Dedkova EN, Blatter LA. Calcium signaling in cardiac mitochondria. J Mol Cell Cardiol. 2013; 58:125-133.
28. Montero M, Alonso MT, Carnicero E, Cuchillo-Ibáñez I, Albillos A, García AG, García-Sancho J, Alvarez J. Chromaffin-cell stimulation triggers fast millimolar mitochondrial Ca2+ transients that modulate secretion. Nat Cell Biol. 2000; 2:57-61.
29. Miyawaki A, Llopis J, Heim R, McCaffery JM, Adams JA, Ikura M, Tsien RY. Fluorescent indicators for Ca2+ based on green fluorescent proteins and calmodulin. Nature. 1997; 388:882-887.
30. Miyawaki A, Griesbeck O, Heim R, Tsien RY. Dynamic and quantitative Ca2+ measurements using improved cameleons. Proc Natl Acad Sci U S A. 1999; 96:2135-2140.
31. Filippin L, Abad MC, Gastaldello S, Magalhães PJ, Sandonà D, Pozzan T. Improved strategies for the delivery of GFP-based Ca2+ sensors into the mitochondrial matrix. Cell Calcium. 2005; 37:129-136.
32. Stiernagle, T. Maintenance of C. elegans (February 11, 2006), WormBook, ed. The C. elegans Research Community, WormBook, doi/10.1895/wormbook.1.101.1, http://www.wormbook.org.
33. Horvitz HR, Chalfie M, Trent C, Sulston JE, Evans PD (1982) Serotonin and octopamine in the nematode Caenorhabditis elegans. Science. 1982; 216:1012-1014.
34. Song BM, Avery L. Serotonin Activates Overall Feeding by Activating Two Separate Neural Pathways in Caenorhabditis elegans. J Neurosci. 2012; 32:1920-1931.