
INTRODUCTION
Nonalcoholic fatty liver disease (NAFLD) is one of the most common chronic liver diseases and the hepatic manifestation of obesity and metabolic syndrome. It can progress to nonalcoholic steatohepatitis (NASH), a more severe form characterized by inflammation, and then to fibrosis and cirrhosis, with consequent severe liver failure and hepatocellular carcinoma (HCC) development in a variable percentage of patients [1, 2]. The strong incidence of obesity, metabolic syndrome and NAFLD is thought to be mainly correlated to consumption of “western diet”, characterized by processed food and sweet beverages [3, 4]. Some mechanisms, such as insulin resistance, peroxidation of lipids, cytokine and adipokine production or oxidative stress, have been described in the NASH pathogenesis [5]. It is known that total high caloric intake is associated to NAFLD/NASH, and several studies have been focused on the role of specific nutrients, such as saturated fat and/or carbohydrate, in the development and transition of the disease [6, 7]. In addition, some studies have described liver tumorigenesis on animal models long term high fat or high fat/fructose diet fed [8–10], but little is known about the specific role of long term high-carbohydrate diet in hepatocarcinogenesis. A work on a NAFLD rat model [11] showed that sucrose, especially when associated to copper deficiency, may promote inflammation, fibrosis and lipogenic pathways. Moreover, some studies, mostly short term, analyzed the effects of fructose on tumor development, showing that it may be a potential risk factor for liver tumorigenesis [12, 13]. Here we used a mouse model predisposed to obesity and NAFLD to analyze long term effects of a low fat-high carbohydrate (sucrose rich) (LF-HC) diet on the progression of liver damage and disease, compared to a high fat (HF) diet. For this purpose, we evaluated the level of steatosis, inflammation and fibrosis as well as the expression of a panel of 15 microRNAs already described in the progression of the disease [10]. Standard diet (SD) fed mice were also analyzed as a control.
RESULTS
Body weights
C57BL/6J mice were HF, LF-HC or SD fed for 12 and 18 months. In Table 1 a comparison among diets, principally highlighting the main differences between fat and carbohydrate, is shown. All diets were choline-supplemented. LF-HC and HF diets differ by the sources of fat and carbohydrate (hydrogenated coconut oil and sucrose), whereas show same content of the remaining ingredients (for a complete description of nutrients, please refer to the diet data sheets as reported in Material and Methods). On the other hand, carbohydrate and fat sources in SD were represented by corn/wheat starch and ether extract (see data sheet as indicated in Materials and Methods). Body weights of mice were measured approximately once a month. Significant weight gain was detected in HF with respect to LF-HC fed mice after 3, 6, 12, and 18 months. Significant differences were also detected in the comparison HF vs. SD after 3, 6, and 12 months, and in LF-HC vs. SD after 6 and 18 months (Figure 1A, legend). SD fed mice showed body weight trend included between those obtained from HF and LF-HC diet fed animals. During the last 50 days, weight decrease was observed in HF mice, and, to a lesser extent, in LF-HC mice. Body weight differences were also detectable by comparing 18 months mice with (T) and without (NT) nodules (shown below in “Macroscopic liver features”) (T HF 42.8±2.9, NT HF 46.6±4.4; T LF-HC 32.3±2.5, NT LF-HC 36.2±1.68; weight as mean ± SEM). After 12 and 18 months, subcutaneous, thoracic and visceral fat deposition was observed in all the groups, more markedly in HF mice (data not shown).
Table 1: Comparison among diets used for long-term mice feeding, focusing on differences in terms of fat and carbohydrate content (for the comparison of the whole composition, please refer to the data sheets as indicated in Material and Methods)
Ingredient |
HF |
LF-HC |
SD |
|||
|---|---|---|---|---|---|---|
g% |
Kcal% |
g% |
Kcal% |
g% |
Kcal% |
|
Protein |
23 |
16.4 |
16.8 |
16.4 |
18.6 |
24 |
Carbohydrate |
35.5 |
25.5 |
74.3 |
73.1 |
44.2 |
58 |
Maltodextrin |
17 |
12.5 |
12.5 |
12.5 |
||
Sucrose |
17.5 |
12.5 |
61.2 |
60.5 |
||
Fat |
35.8 |
58 |
4.8 |
10.5 |
6.2 |
18 |
Soybean oil |
2.5 |
4 |
1.8 |
4 |
||
Coconut oil, hydrogenated |
33.3 |
54 |
2.9 |
6.5 |
||
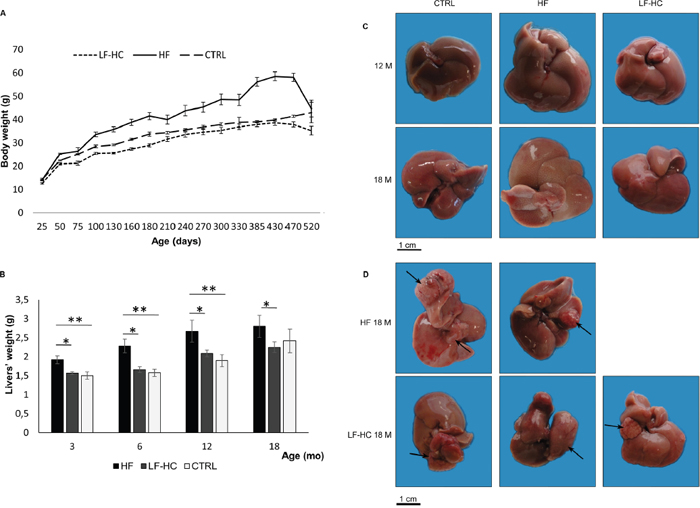
Figure 1: (A) Body weights. HF, LF-HC or SD (CTRL) control mice were weighed at the indicated time points (X axis). Values are mean ± SEM. Statistical significance as follows: HF vs. LF-HC P3M, 6M, 12M<0.001, P18M=0.004; HF vs. SD P3M=0.0003, P6M=0.0001, P12M=0.0006; LF-HC vs. SD P6M=0.002, P18M=0.013. (B) Liver weights, expressed as mean ± SEM. Statistical significance as follows: *, P<0.01; **, P<0.006. (C) Livers from 12 and 18 months HF, LF-HC and SD mice. (D) Macroscopic nodules on livers from 18M HF (2 out of 5) and LF-HC mice (arrows).
Macroscopic liver features
To define macroscopic appearance, livers from HF, LF-HC and SD fed animals were excised, weighed and analyzed. Livers from HF animals displayed higher volumes than those from LF-HC and SD, and liver significant weight increase was observed in the comparisons HF vs. LF-HC and HF vs. SD. On the contrary, no significant differences were revealed in LF-HC with respect to SD (Figure 1B). Paler color of livers, most probably correlated to steatosis, was evident in HF and, to a lesser extent, in LF-HC with respect to SD diet fed animals (Figure 1C). We previously described voluminous nodular lesions in 2/10 of 12 months HF mice [10]. After 18 months, 50% (5/10) of HF and, very interestingly, 30% (3/10) of LF-HC mice showed macroscopic nodules (Figure 1D). Overall, after 18 months, 7 and 5 macroscopic nodules were detected in HF and LF-HC livers, whose biggest dimensions were included between 0.2 and 1.8 cm in HF, and between 0.2 and 1.5 cm in LF-HC (Table 2). On the contrary, macroscopic nodules were not identifiable in SD fed controls.
Table 2: Description of macroscopic nodules in 18 months HF and LF-HC diet fed mice
Mouse ID |
Number of macroscopic nodules |
Dimensions (cm) |
|---|---|---|
32 HF |
2 |
0,6x0,7x0,3 |
37 HF |
1 |
1,4x1,8x1,2 |
38 HF |
1 |
0,3x0,3x0,3 |
39 HF |
1 |
1,0x1,3x0,8 |
40 HF |
2 |
0,6x0,6x0,3 |
35 LF-HC |
2 |
0,8x1,2x0,2 |
37 LF-HC |
1 |
2,0x1,5x0,7 |
40 LF-HC |
2 |
0,7x0,5x0,3 |
Histological livers’ features
In order to characterize the features and the extent of liver damage, microscopic analysis of hepatic tissues was performed. Progressive diet-dependent liver damage, in some cases significant, was observed at the morphological level in terms of steatosis, inflammation and fibrosis (Figure 2A, 2B). All the liver tissues from SD, LF-HC, HF diet fed animals showed a certain degree of ballooning degeneration, a reversible condition characterized by clear cytoplasm and normal nucleus in central position (Figure 2A). Increasing degree of steatosis severity was revealed by SD, LF-HC and HF diet fed animals after 12 months, and more severe steatosis was progressively detected in the above-mentioned groups after 18 months, as represented in Figure 2A (right, top).
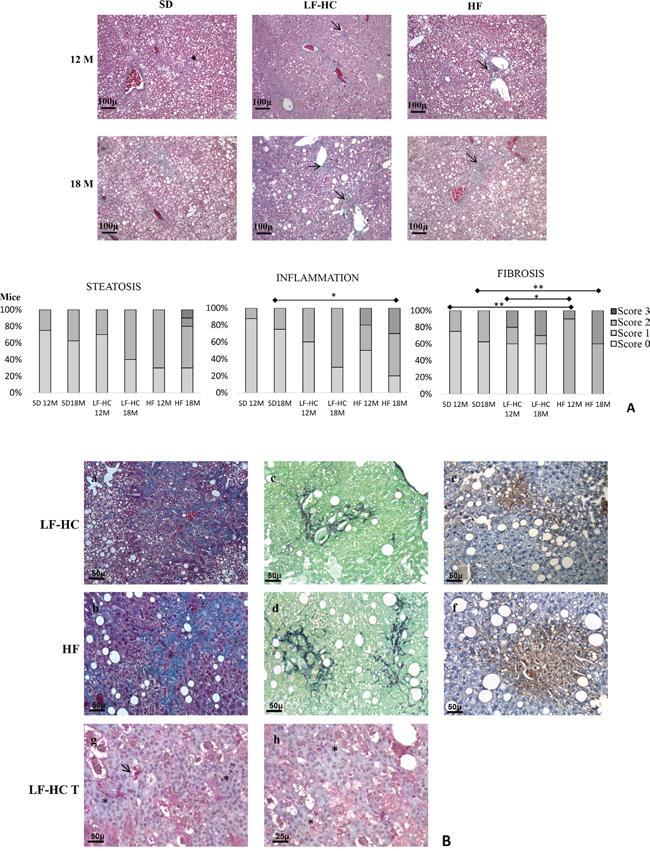
Figure 2: Histological features of hepatic tissues from SD, LF-HC and HF mice. (A) Masson’s trichrome staining (original magnification 10X, scale bar: 100 μm). Steatosis aspects were preeminent in 12 and 18 months HF mice compared to 12 and 18 months LF-HC. In SD mice ballooning degeneration was prevalent (black head arrow). Scattered inflammatory infiltrate (arrows) can be observed in LF-HC and, more severe, in HF mice. Fibrosis, was increasing in LF-HC and HF mice without resembling the typical aspect of cirrhosis. Bottom: graphical representation of the severity of pathological conditions in liver tissues from SD, LF-HC and HF mice. P as follows: * P<0.05, ** P<0.005. (B) Masson’s trichrome (a,b), Sirius Red-Fast Green staining (c,d) and immunohistochemistry for CD31 (e,f) (original magnification 20X, scale bar 50 μm) of 18 months LF-HC and HF liver tissues. The microphotographs show irregular thin trabeculae (a,b,c,d) and a certain numbers of neovessels with CD31 immunopositivity (e,f). Masson’s trichrome staining (g,h) of a macroscopic nodule’s section (LF-HC T) from a 18 months LF-HC (original magnification 20X, scale bar 50 μm and 40X scale bar 25 μm) shows an increase of cellular density (asterisk: g,h) with aspects of atypia.
Mild or moderate scattered inflammatory infiltrate, characterized by lymphocytes, plasma cells, macrophages and polymorphonuclear leucocytes (PMN), was observed in liver parenchyma (Supplementary Figure 1). The presence of inflammatory infiltrate was progressively increasing in SD, LF-HC and HF mice after 12 and, more markedly, 18 months (Figure 2A, right, center). In particular, very mild infiltrate was evidenced in SD fed mice.
Finally, we characterized the extent of fibrosis by using both Masson’s trichrome and Sirius Red-Fast Green staining. Delicate strands of collagen fibers, close to a variable number of small vessels, were identified. In accordance to that previously described, the severity of fibrosis progressively increased in SD, LF-HC and HF mice after 12 and, markedly, after 18 months (Figure 2A, right, bottom). Very light fibrosis was detected in SD fed mice. Notably, the strands of connective deposition identified did not resemble the typical aspect of cirrhotic liver even in HF mice, and no peri-portally or centrizonally septa were present (Figure 2A, left; Figure 2B, a,b,c,d).
Hepatic tissues from non tumor (NT) or tumor (T) bearing mice were also compared. Despite differences concerning the number of mice belonging to T or NT groups, a more severe trend in terms of steatosis, inflammation and fibrosis seems to be displayed by tumor-bearing mice (Supplementary Figure 2).
Nodules identified at the macroscopic level were excised and microscopically analyzed. Features of dysplastic or early hepatic cancer were evidenced (Figure 2B, g,h). In addition, we observed connective deposition characterized by irregular thin trabeculae that bordered nodules with a variable number of small microscopic vessels expressing CD31 immunopositivity (Figure 2B, e,f). A certain degree of cytological atypia, rare pseudo-glandular structures were also observed (Figure 2B, g,h).
IL-1β, IL-6, TNF-α, HGF expression
In order to further characterize that described by morphological analysis, inflammatory cytokines and hepatocyte growth factor expression was assessed by comparing pooled liver RNAs from SD as well as not-bearing (NT) and bearing tumors (T) LF-HC or HF diet fed mice. Results are shown in Figure 3. Significant expression differences were detected by comparing NT or T LF-HC and HF to SD fed mice (black stars). After 12 months, TNF-α increase was detected in both T/NT HF with respect to SD, whereas IL-1β increased only in T HF. Mild, but significant HGF decrease was also identified in both T/NT mice (RQ 0.86 and 0.68, respectively) with respect to SD fed animals. After 18 months, most of the NT and T HF or LF-HC groups displayed significant IL-1β, TNF-α, HGF increase with respect to SD controls. No significant IL-6 differences were detected, although IL-6 increase was evidenced by 12 months T HF, 18 months T LF-HC, T and, to a lesser extent, NT HF compared to SD mice. Significant expression differences were further evidenced by comparing liver tissues from NT with those from T-bearing mice (gray stars): IL-1β, IL-6, TNF-α and HGF increase was detected in 12 months T HF mice; at the same way, IL-1β, TNF-α, HGF increase was shown by 18 months T LF-HC. T LF-HC mice showed in addition IL-6 increase, although this difference was not significant. At the same way, not significant TNF-α increase and IL-6/HGF decrease was shown by 18 months T HF. Overall, these data suggest that liver damage and disease identified in LF-HC mice is similar and only delayed with respect to that detected in HF animals.
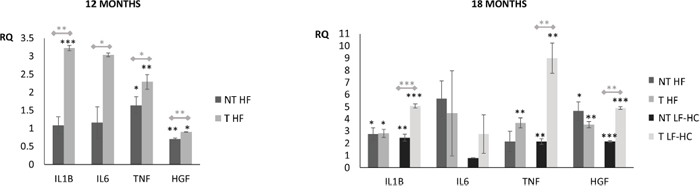
Figure 3: Cytokines and growth factor expression in liver tissues from mice without (NT) and with (T) tumors. (A) Comparison between pooled RNAs from non-tumor hepatic tissues, obtained from NT and T HF mice. Pooled RNAs from 12 months SD mice livers were used as reference. (B) Comparison between pooled RNAs from non-tumor hepatic tissues, obtained from NT and T HF or LF-HC mice. Pooled RNAs from 18 months SD mice livers were used as reference. HPRT was used as endogenous control. RQ: relative quantification. Data expressed as mean ± SE. P as follows: * P<0.05, ** P<0.005, *** P<0.0005. Black stars: significant differences resulting from T/NT LF-HC or T/NT HF vs. SD fed mice. Gray stars: significant differences resulting from the comparison between non tumor NT and tumor T bearing mice.
Clinical chemistry assays
In order to further assess liver disease, a panel of plasma biomarkers was analyzed in non-fasting mice. Differences indicating metabolic dysfunctions were detected among the groups (Table 3). After 12 months, significant increase of alanine aminotransferase (ALT) was displayed by HF and, to a lesser extent, by LF-HC mice. Low density lipoprotein (DLDL) increase was shown by HF and, less, by LF-HC mice with respect to SD, whereas ultra high density lipoprotein (UHDL) and triglycerides (TRIG) raised essentially in HF mice. High TRIG levels were also detected in SD. After 18 months, significant DLDL increase was observed in HF and, to a lesser extent, in LF-HC mice with respect to SD. TRIG increase was also detected in HF mice. Aspartate aminotransferase (AST)/ALT ratios were ≥2 in all the experimental groups, with LF-HC values higher than HF (Table 3A). Significant differences were also detected in the comparison (t-test) between HF and LF-HC AST/ALT ratio after 12 and 18 months (P12M=0.003; P18M= 0.03), ALT and UHDL levels after 12 months (PALT=0.03, PUHDL=0.02), TRIG levels after 18 months (P=0.02). In addition, we stratified HF and LF-HC mice in two groups, each developing tumors (T) or not (NT) (Table 3B). Taking into consideration the low number of animals included in each T/NT group (reported in the table), differences were detected. After 12 months, ALT increase was detected in NT HF, whereas higher glucose (GLUC), TRIG, UHDL, cholesterol (CHOL) values were detected in T HF mice. After 18 months, ALT increase was evidenced in T HF and, more, T LF-HC mice. Higher AST levels were displayed by T LF-HC, whereas T HF showed increased DLDL and CHOL levels. TRIG values diminished in both T HF and T LF-HC.
Table 3: Chemical chemistry data of plasma from non-fasted mice and AST/ALT ratios, expressed as mean ± SEM
3A: Comparisons among 12 and 18 months CTRL, HF and LF-HC mice. Statistical significance was assessed by Kruskall-Wallis test followed by Bonferroni correction (P<0.006). Comparisons were also performed between LF-HC and HF diet fed mice (see text)
Marker |
12 months |
18 months |
||||||
|---|---|---|---|---|---|---|---|---|
CTRL |
HF |
LF-HC |
P |
CTRL |
HF |
LF-HC |
P |
|
ALT U/I |
32.7±4.03 |
89±23 |
45±6.8 |
65.5±19 |
96±28 |
101±30 |
0.626 |
|
AST U/I |
123.7±24 |
156.8±24 |
203±32 |
0.109 |
219±27 |
189±37 |
318±59 |
0.147 |
AST/ALT |
2.1±0.7 |
2.3±0.3 |
5.1±0.8 |
0.016 |
4.2±0.8 |
2.6±0.3 |
3.9±0.5 |
0.078 |
DLDL mg/dl |
9.1±0.6 |
15.1±1.7 |
12.6±1 |
0.012 |
7.2±0.7 |
18.7±1.5 |
15.6±1.4 |
|
GLUC mg/dl |
335.2±30 |
388±33 |
398±30 |
0.389 |
416±12 |
356±54 |
442±29 |
0.223 |
TRIG mg/dl |
110±6.1 |
100.7±7.6 |
82±6.2 |
0.028 |
87.7±10.9 |
108±7.8 |
71±7.8 |
0.012 |
UHDL mg/dl |
77.1±2.3 |
101±7.5 |
80±2.5 |
0.025 |
77.5±1.9 |
76±10 |
71.5±5 |
0.600 |
CHOL mg/dl |
149.6±4.6 |
208±18.6 |
173±10 |
0.144 |
157±5.7 |
173±10 |
166±14 |
0.992 |
3B: Comparisons among 12 and 18 months HF, LF-HC mice without (NT) and with (T) tumors, expressed as mean ± SEM. ALT alanine aminotransferase, AST aspartate aminotransferase, DLDL direct low density lipoprotein, GLUC glucose, TRIG triglycerides, UHDL ultra high density lipoprotein, CHOL cholesterol
Marker |
12 months |
18 months |
||||
|---|---|---|---|---|---|---|
NT HF |
T HF |
NT HF |
T HF |
NT LF-HC |
T LF-HC |
|
ALT U/I |
87.2±28.4 |
65±6 |
87.6±31 |
106±50.6 |
65.2±15.2 |
185±83 |
AST U/I |
150±30.3 |
145.5±1.5 |
189.2±50 |
190±60.4 |
258±46.7 |
458±145 |
AST/ALT |
2.7±0.8 |
2.2±0.18 |
2.6±0.4 |
2.5±0.5 |
4.2±0.6 |
2.8±1.1 |
DLDL mg/dl |
14.2±5.2 |
14.5±5.5 |
15.8±1 |
21.6±2.2 |
15.5±1.5 |
15.6±3.7 |
GLUC mg/dl |
348±32 |
500±52 |
363.8±51 |
341±67.3 |
485±24.3 |
344±35 |
TRIG mg/dl |
92.4±7.3 |
120±22 |
118±14 |
98.2±5.3 |
78.5±9.3 |
53.3±7.4 |
UHDL mg/dl |
90±6.5 |
123±5 |
73±14.7 |
71.5±5 |
72±7.7 |
68.6±3 |
CHOL mg/dl |
191.5±22.4 |
228±26 |
169.8±34 |
205.6±44 |
174±18.5 |
148±10 |
MiRNA expression analysis
MicroRNAs play a pivotal role in many fundamental physiological and pathological conditions. We previously identified a panel of 15 microRNAs whose dysregulated expression was described throughout the progression of long term (12 months) diet-induced hepatic damage [10]. Here, we further extended the analysis up to 18 months, by comparing HF to LF-HC non tumor liver tissues as well as tumors to non tumor counterparts (Figure 4). Regarding the comparison between HF and LF-HC non tumor hepatic tissues (Figure 4A), miR-27a expression increase (close to 3 fold), with consequent switch from hypo- to hyper-expression, was detected in 18 months HF livers. Less marked expression increase (included between 1.5 and 1.7 fold) of miR-20a, 200c, 93, 99b, 484, 574-3p and 720 was also detected, with final global iso- expression in HF with respect to LF-HC tissues. MiR-125a-5p expression increase, maintained within the hypo-expression range, was also detected in HF after 18 months. MiR-182 overexpression was revealed by HF livers both after 12 and 18 months. Conversely, miR-155, 193b, 200a level decrease (ranging from 0.5 to 0.7 value) was observed (Figure 4A). Fluctuations were evidenced in tumors with respect to non-tumor liver tissues: after 18 months, miR-27a, 31, 99b, 484, 125a-5p switched from over- to hypo-expression in tumors. MiR-155 and 574-3p displayed similar behavior: they were overexpressed in tumors from 12 months HF and 18 months LF-HC mice, whereas showed downregulation in 18 months HF. Slighter expression changes were detected in miR-20a, 200a and 720. Hypo-expression was maintained by miR-200c, 93 and 340-5p and overexpression by miR-193b and 182 (Figure 4B). Overall, some of the miRNAs here described show more evident modulation among the groups and, for this reason, might be specifically involved in the progression of the disease, depending on the type of diet.
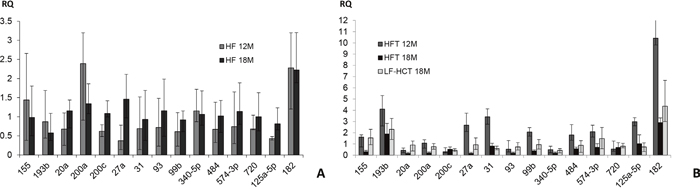
Figure 4: MiRNA expression analysis. (A) Expression of 15 miRNAs in non tumor hepatic tissues from 12 and 18 months HF vs. LF-HC mice. (B) MiRNAs expression in tumors from HF (12 and 18 months) and LF-HC (18 months) mice compared to respective normal HF and LF-HC hepatic tissues. Mamm-U6 was used as endogenous control. All the experiments are mean ± SE of three iterations. RQ: relative quantification.
DISCUSSION
NAFLD is one of the most frequent chronic diseases and is often associated to obesity, a major risk factor for several types of cancer, including that of liver [14]. Its earliest stage is characterized by steatosis which can progress to more severe NASH, with signs of liver cells damage and hepatic inflammation frequently associated to collagen deposition [15]. It is known that a variable percentage of patients affected by NASH can develop hepatic cancer [1]. Carbohydrates are a major stimulus for de novo lipogenesis, and some studies have shown that overconsumption of soft drinks and processed foods containing high-fructose corn syrup is associated with liver damage and NAFLD [16, 17]. The main sources of fructose in human diet are high-fructose corn syrup or sucrose from cane or beet sugar. Some studies, focused on explaining the correlation among fructose consumption, insulin resistance and visceral fat in NAFLD, have shown that the sugar induces hepatic and extrahepatic insulin resistance and visceral adiposity [18–21]. Fructose is barely adsorbed by the gastrointestinal tract and cleared by the liver, where it is metabolized with unique mechanism different from that used by hepatocytes for glucose [22, 23]. In the liver, fructose phosphorylation by fructokinase (KHK) generates fructose 1-phosphate which acts as a substrate for aldolase. This produces high levels of ATP and citrate, with consequent fatty acids’ and triglycerides’ biosynthesis. In this context, high fructose diets can cause fat accumulation in the liver and then hepatic damage which can drive to more severe pathological conditions. The previous evidences are supported by a study by Ishimoto et al. [24], where KHK negative mice showed only mild steatosis, without significant inflammation and fibrosis. Cellular and molecular mechanisms linking steatosis, and subsequent pathological conditions, to hepatic cancer have not been clearly defined yet. Some studies identify as major causes of cancerogenesis: a) dysregulated release of adipokines involved in insulin resistance and inflammation [25], b) hyperinsulinemia with hepatocyte proliferative activation and enhanced release of insulin-like growth factor-1 (IGF-1) [26], c) lipid peroxidation leading to oxidative stress and DNA damage [27–29], d) lipotoxicity promoting oncogenesis by PTEN tumor suppressor downregulation [30], e) low grade inflammatory status often associated to obesity, with subsequent increase of specific cytokines (i.e. TNF-α, IL-6) which exert their proliferative and anti-apoptotic effects by activation of the STAT3 oncogenic transcription factor [31]. In this work, we used high fat (HF), low fat-high carbohydrate (LF-HC) or standard (SD) diets for long-term mice feeding to analyze the extent of diet-induced liver damage and disease. Previous studies reported hepatic cancer in long-term HF diet fed mice [9, 10]. Tumor development was in addition observed in a long term study on C57BL/6J mice fed a diet similar to an American fast food diet and enriched with high fructose corn syrup [8]. Here we show for the first time liver tumors in long-term LF-HC diet fed mice, indicating that the hepatocarcinogenesis process may be attributable to high carbohydrate (sucrose) diet. After 18 months, 30% of LF-HC diet fed mice showed nodules with defined neoplastic features. Furthermore, the percentage of HF diet fed animals with hepatic cancer increased from 20% after 12 months to 50% after 18 months, supporting the enhanced detrimental effects due to prolonged HF feeding. Significant weight increase was detected in HF with respect to LF-HC mice, whereas in the last days HF and, to a lesser extent, LF-HC mice showed weight decrease, most probably due to degenerating health conditions as result of the tumors’ development. Accordingly, body weight decrease is further observed in 18 months mice with hepatic nodules with respect to those without. Interestingly, weights of SD fed mice were higher with respect to LF-HC, despite lower SD calorie count, thus suggesting that the adverse health conditions leading to severe liver damage and hepatocarcinogenesis might not merely depend on the total calorie intake or weight gain, but on the specific LF-HC diet components instead. Clinical chemistry data indicate the presence of metabolic dysfunctions, generally less marked in LF-HC and more severe in HF groups, most probably due to the advanced liver disease and possibly depending on the type of diet. Globally, these data confirm metabolic dysfunctions and advanced liver disease in HF and, less, in LF-HC mice. AST/ALT ratio more than 2 was displayed by HF, LF-HC and SD fed animals as well. The highest ratio was shown by LF-HC and this should be specifically investigated in the future. Generally, in humans, AST/ALT in NASH is ≤1, whereas values more than 2 can be attributed to acute alcoholic hepatitis or advanced fibrosis and cirrhosis in advanced chronic liver disease [32, 33]. AST/ALT ratio more than 2 is also reported in fasted 54-56 weeks-old SD/SD+HF diet fed [34] and in non fasted 56-70 days-old SD fed C57BL6/J mice (http://www.criver.com/files/pdfs/rms/c57bl6/rm_rm_d_c57bl6n_mouse.aspx).
After 12 and 18 months, both HF and LF-HC diet fed animals show different degrees of steatosis, inflammation and fibrosis. The severity of these condition is, however, less pronounced in the latter group, indicating that the process of diet-induced liver damage and disease is here just delayed. Expression analysis of inflammatory cytokines and growth factors is in line with that described at the morphological level: in particular, significant differences, more marked after 18 months, of IL-1β, TNF-α and HGF were detected in both tumor and non tumor bearing HF and LF-HC mice with respect to SD fed animals. Significant differences of IL-1β, IL-6, TNF-α and HGF were also detected in the comparison between tumor and non tumor HF and LF-HC bearing mice. Interestingly, pro-inflammatory cytokine enhancement is mostly observable in liver tissues from T-bearing mice, further confirming the role of these molecules in cancer promotion, as already described [28]. The observed HGF increase after 18 months might be correlated to a process of liver regeneration following diet-induced chronic damage [35]. Conversely, just minor percentages of SD fed mice show mild steatosis, fibrosis and very light inflammation, most probably due to old age. Accordingly, deteriorating conditions in terms of liver disease due to aging have been already described in literature [36, 37]. As a consequence, no nodules or abnormal hepatic architecture were evidenced in SD fed animals. We also analyzed the level of expression of several microRNAs, small non-coding molecules able to regulate gene expression at the post-transcriptional level, involved in many fundamental cell processes [38, 39]. Due to their structure and functions, miRNAs are strongly involved in cancer initiation and progression and considered biomarkers as well as potential therapeutic targets in several diseases, including those of liver [40–43]. We already identified and discussed fifteen microRNAs which were modulated (from 3 to 12 months) in hepatic tissues through the transition NAFL-NASH-HCC and in tumors [10]. To complete this scenario, we extended the expression analysis up to 18 months. Most of the miRs globally showed weak expression level differences in liver tissues and/or tumors, indicating that the damage induced in HF and LF-HC diet fed animals is quite similar. Others (e.g. miR-27a, 31, 99b, 484, 125a-5p) showed more pronounced fluctuations: for this reason, they could provide new interesting elements to be further investigated to examine in depth molecular mechanisms involved in liver disease induced by specific diets. Controversial functions of the above-mentioned miRs have been described in the development of hepatic cancer of other types of tumors. MiR-27a seems to act as a tumor promoter [44] or suppressor, with low expression associated to early metastasis in HCC [45]. At the same way, miR-31 overexpression was described in a similar mouse model [9] and, conversely, downregulation in a subset of HCC patients with poorer prognosis [46]. MiR-99b acts in promoting metastasis and in defining poor prognosis in HCC patients [47] or, on the other hand, in suppressing liver metastasis of colorectal cancer by mTOR downregulation [48]. MiR-125a-5p was described as a tumor promoter or a tumor suppressor in cancer [49–53]. MiR-484 is involved in IFN-signaling/microRNA pro-tumorigenic mechanisms and seems to have a crucial role in triggering the liver precancerous process [54, 55]. Finally, miR-182, already discussed and described as early over-expressed in HF with respect to LF-HC mice [10], maintained increased levels in HF non tumor hepatic tissues and in tumors after 12 and 18 months. Due to its stable up-regulation, miR-182 represents an additional interesting molecule to be deeply analyzed in order to shed light on diet-induced hepatic cancer initiation and progression.
In conclusion, results here reported provide, for the first time, evidence about long term LF-HC diet induced hepatic cancer. In the wild-type mouse model we used, tumor development can be promoted by two types of diets which differ about the high content of fat (hydrogenated coconut oil) and carbohydrate (sucrose). This indicates that also long term sucrose intake can induce, just later, pathological conditions similar to those shown by HF fed mice. Contextually, mice fed a standard diet, containing different sources of fat and carbohydrates, show very light inflammatory infiltrate, steatosis and fibrosis, confirming the fact that diet-induced hepatic damage and inflammation is linked to cancer initiation and progression. Inflammatory cytokines and HGF show expression increase in LF-HC and HF mice, especially those with tumors, further sustaining that above-reported. Several dysregulated microRNAs here identified, probably depending on the type of diet and the evolution of the disease, should be deeply analyzed to explain their role in diet-induced hepatocarcinogenesis. This could help to identify molecules to be potentially used in the management of liver illness. Additional experiments, especially focused on analyzing the level of oxidative stress, expression differences of other mediators involved in inflammation, microRNA target genes are needed to further elucidate the molecular mechanisms responsible for liver tumor formation.
MATERIALS AND METHODS
Mice treatment
C57BL/6J mice were purchased from Charles Rivers Laboratories (France) and maintained at 21°C on a 12 hours light-dark cycle. Twenty days old male mice, obtained from an established colony, were randomly assigned to 4 groups (10 animals each), and high fat (HF) (5.56 Kcal/g) (D12331, OpenSource, Research Diets) or low fat-high carbohydrate (LF-HC) (4.07 Kcal/g) (D12329, Open Source, Research Diets) diet fed for 12 and 18 months (Table 1). Both diets were choline supplemented. Control mice (2 groups, 8 animals each) were standard diet (SD) (3.1 Kcal/g; fat –ether extract- 18% Kcal, carbohydrate –mainly wheat and corn starch- 58% Kcal) (2018S Harlan Teklad) fed for 12 and 18 months. Mice were weighed at approximately one month intervals and periodically analyzed for signs of disease or morbidity. Animals were sacrificed by CO2 asphyxiation, weighed, and head-to-tail measured. Laparotomy was then performed, and livers were visualized and rapidly excised, weighed and photographed. The following parameters were considered: liver appearance, color and weight. Liver tumors were excised, counted and measured with a caliper in their major three dimensions. All experimental procedures involving animals and their care were performed in conformity with national and international laws and policies (European Economic Community Council Directive 86/609, OJ 358, 1 Dec 12, 1987; Italian Legislative Decree 116/92, Gazzetta Ufficiale della Repubblica Italiana n. 40, Feb 18, 1992; National Institutes of Health Guide for the Care and Use of Laboratory Animals, NIH publication no. 85-23, 1985). The project was approved by the Italian Ministry of Health and the internal Committee of the University of L’Aquila. All efforts were made to minimize suffering.
Histopathology
Specimens obtained from sectioned livers were washed in PBS and immediately immersed in 10% formalin in phosphate buffered saline (PBS) (pH 7.4). Then standard procedures for paraffin embedding were performed. Serial 3 μm sections were stained with Hematoxylin and Eosin (H&E) to assess the liver general architecture and inflammatory infiltrate. Masson’s trichrome and Sirius Red-Fast Green staining were also performed in order to detect connective tissue deposition and fibrosis.
We evaluated neovascularization within the liver parenchyma and nodules by immunohistochemical analyses for CD31 (1:50, ab28364, Abcam, Cambridge UK).
Two independent pathologists (AV, RS) performed quantitative analyses.
Steatosis was staged on 0-3 scale as followed: score 0, < 5%; score 1, 5%-33%; score 2, 33%-66%; score 3, >66% (for each specimen: 4 fields, 10X) [56].
Parenchymal inflammation was defined as a focus of two or more inflammatory cells within the lobule. Each focus was counted at 20X magnification (score0=none; 1≤2 foci; 2>2 foci) [57].
Stage of fibrosis was assessed as follow: score 0=none; score 1=perisinusoidal zone or periportal fibrosis; stage 2= perisinusoidal and periportal fibrosis without bridging; score 3: bridging fibrosis; score 4= cirrhosis [57].
The stained sections were then observed by using Olympus BX51 Light Microscope (Olympus, Optical Co., Ltd, Tokyo, Japan), and photographed.
Chemical chemistry assays
Blood was collected in heparin by cardiac puncture after CO2 euthanasia, then plasma was obtained by centrifugation and stored at -80°C. Analyses of biomarkers were performed by using Abbott Diagnostics Architect system and dedicated kits, according to manufacturer’s instructions.
RNA extraction and microRNA expression analysis
RNA extraction and miRNA analysis was performed as previously described [10]. Pooled RNAs from animals belonging to the same LF-HC and HF experimental group were used for miRNA comparisons.
Expression of cytokines and growth factors
Total non-tumor liver tissue RNA from mice belonging to tumor (T) or non-tumor (NT) bearing mice were pooled together, then 1 μg was retrotranscribed by using the Gene Amp RNA PCR kit (Applied Biosystems), according to the manufacturer’s instructions. One microliter of product was used for real-time PCR (2X qPCRBIO SyGreen mix lo-ROX, PCR Biosystems), according to the manufacturer’s instructions. HPRT was used as endogenous control. Primers used are reported in Supplementary Table 1. Afterwards, samples were run onto a ViiA 7 instrument (Applied Biosystems). Comparative expression analysis was performed by ViiA7 and Expression Suite softwares (Thermo Fisher).
Statistical analysis
Clinical chemistry data were analyzed by GraphPad Prism 7 software. Statistical significance was assessed by t-test or Kruskall-Wallis test. RT-qPCR data were analyzed by Expression Suite software (Thermo Fisher) and GraphPad Prism 7.
Abbreviations
NAFLD non alcoholic fatty liver disease, NASH non alcoholic steato-hepatitis, HF high fat, LF-HC low fat high carbohydrate, SD standard diet, CTRL control, TNF-α tumor necrosis factor α, IL-6 interleukin-6, IL-1 interleukin 1, HGF hepatocyte growth factor, STAT3 signal transducer and activator of transcription 3, miRNA microRNA.
Author contributions
AT conceived experiments, analyzed data and wrote manuscript; VM handled mice, collected and processed tissue samples; AV, RS, SP performed histological and immunohistochemical analyses; GC handled mice; RB collected clinical chemistry data; DC; FZ and CC revised manuscript; EA conceived project and revised manuscript. All authors have read and approved the manuscript.
ACKNOWLEDGMENTS
We thank Dr. Mauro Di Vito Nolfi for his support in art-work. This work is devoted to the memory of Nicola Tessitore.
CONFLICTS OF INTEREST
The authors declare no conflicts of interest.
FUNDING
This work was supported by MIUR-FIRB grant n. RBAP10A9H9 to Edoardo Alesse.
REFERENCES
1. Michelotti GA, Machado MV, Diehl AM. NAFLD, NASH and liver cancer. Nat Rev Gastroenterol Hepatol, 2013; 10:656-665.
2. Pagano G, Pacini G, Musso G, Gambino R, Mecca F, Depetris N, Cassader M, David E, Cavallo-Perin P, Rizzetto M. Nonalcoholic steatohepatitis, insulin resistance, and metabolic syndrome: further evidence for an etiologic association. Hepatology. 2002; 35:367-372.
3. Yilmaz Y. Review article: fructose in non-alcoholic fatty liver disease. Aliment Pharmacol Ther. 2012; 35:1135-1144.
4. Longato L. Non-alcoholic fatty liver disease (NAFLD): a tale of fat and sugar? Fibrogenesis Tissue Repair. 2013; 18:6:14.
5. Paschos P, Paletas K. Non alcoholic fatty liver disease and metabolic syndrome. Hippokratia. 2009; 13:9-19.
6. Toshimitsu K, Matsuura B, Ohkubo I, Niiya T, Furukawa S, Hiasa Y, Kawamura M, Ebihara K, Onji M. Dietary habits and nutrient intake in non-alcoholic steatohepatitis. Nutrition. 2007; 23:46-52.
7. Tetri LH, Basaranoglu M, Brunt EM, Yerian LM, Neuschwander-Tetri BA. Severe NAFLD with hepatic necroinflammatory changes in mice fed trans fats and a high-fructose corn syrup equivalent. Am J Physiol Gastrointest Liver Physiol. 2008; 295:G987-G995.
8. Dowman JK, Hopkins LJ, Reynolds GM, Nikolaou N, Armstrong MJ, Shaw JC, Houlihan DD, Lalor PF, Tomlinson JW, Hübscher SG, Newsome PN. Development of hepatocellular carcinoma in a murine model of nonalcoholic steatohepatitis induced by use of a high-fat/fructose diet and sedentary lifestyle. Am J Pathol. 2014; 184:1550-1561.
9. Hill-Baskin AE, Markiewski MM, Buchner DA, Shao H, DeSantis D, Hsiao G, Subramaniam S, Berger NA, Croniger C, Lambris JD, Nadeau JH. Diet-induced hepatocellular carcinoma in genetically predisposed mice. Hum Mol Genet. 2009; 18:2975-2988.
10. Tessitore A, Cicciarelli G, Del Vecchio F, Gaggiano A, Verzella D, Fischietti M, Mastroiaco V, Vetuschi A, Sferra R, Barnabei R, Capece D, Zazzeroni F, Alesse E. MicroRNA expression analysis in high fat diet-induced NAFLD-NASH-HCC progression: study on C57BL/6J mice. BMC Cancer. 2016; 16:3. doi: 10.1186/s12885-015-2007-1.
11. Tallino S, Duffy M, Ralle M, Cortés MP, Latorre M, Burkhead JL. Nutrigenomics analysis reveals that copper deficiency and dietary sucrose up-regulate inflammation, fibrosis and lipogenic pathways in a mature rat model of nonalcoholic fatty liver disease. J Nutr Biochem. 2015; 26:996-1006.
12. Kumamoto R, Uto H, Oda K, Ibusuki R, Tanoue S, Arima S, Mawatari S, Kumagai K, Numata M, Tamai T, Moriuchi A, Fujita H, Oketani M, et al. Dietary fructose enhances the incidence of precancerous hepatocytes induced by administration of diethylnitrosamine in rat. Eur J Med Res. 2013; 18:54. doi: 10.1186/2047-783X-18-54.
13. Laguna JC, Alegret M, Roglans N. Simple sugar intake and hepatocellular carcinoma: epidemiological and mechanistic insight. Nutrients. 2014; 6:5933-5954.
14. Sun B, Karin M. Obesity, inflammation and liver cancer. J. Hepathol. 2012; 56:704-713.
15. Cohen JC, Horton JD, Hobbs HH. Human fatty liver disease: old question and new insights. Science. 2011; 332:1519-1523.
16. Chiu S, Sievenpiper JL, de Souza RJ, Cozma AI, Mirrahimi A, Carleton AJ, Ha V, Di Buono M, Jenkins AL, Leiter LA, Wolever TM, Don-Wauchope AC, Beyene J, et al. Effect of fructose on markers of non-alcoholic fatty liver disease (NAFLD): a systematic review and meta-analysis of controlled feeding trials. Eur J Clin Nutr. 2014; 68:416-423.
17. Abdelmalek MF, Suzuki A, Guy C, Unalp-Arida A, Colvin R, Johnson RJ, Diehl AM. Nonalcoholic Steatohepatitis Clinical Research Network. Increased fructose consumption is associated with fibrosis severity in patients with nonalcoholic fatty liver disease. Hepatology. 2010; 51:1961-1971.
18. Dirlewanger M, Schneiter P, Jequier E, Tappy L. Effects of fructose on hepatic glucose metabolism in humans. Am J Physiol Endocrinol Metab. 1999; 279:e907-e911.
19. Stanhope KL, Schwarz JM, Keim NL, Griffen SC, Bremer AA, Graham JL, Hatcher B, Cox CL, Dyachenko A, Zhang W, McGahan JP, Seibert A, Krauss RM, et al. Consuming fructose-sweetened, not glucose-sweetened, beverages increases visceral adiposity and lipids and decreases insulin sensitivity in overweight/obese humans. J Clin Invest. 2009; 119:1322-1334.
20. Pollock NK, Bundy V, Kanto W, Davis CL, Bernard PJ, Zhu H, Gutin B, Dong Y. Greater fructose consumption is associated with cardiometabolic risk markers and visceral adiposity in adolescents. J Nutr. 2012; 142:251-257.
21. Hardy OT, Czech MP, Corvera S. What causes the insulin resistance underlying obesity? Curr Opin Endocrinol Diabetes Obes. 2012; 19:81-87.
22. Mayes PA. Intermediary metabolism of fructose. Am J Clin Nutr. 1993; 58:754S-765S.
23. Cantley LC. Cancer, metabolism, fructose, artificial sweeteners, and going cold turkey on sugar. BMC Biol. 2013; 12:8. doi: 10.1186/1741-7007-12-8.
24. Ishimoto T, Lanaspa MA, Rivard CJ, Roncal-Jimenez CA, Orlicky DJ, Cicerchi C, McMahan RH, Abdelmalek MF, Rosen HR, Jackman MR, MacLean PS, Diggle CP, Asipu A, et al. High-fat and high-sucrose (western) diet induces steatohepatitis that is dependent on fructokinase. Hepatology. 2013; 58:1632-1643.
25. Marra F, Bertolani C. Adipokines in liver diseases. Hepatology. 2009; 50:957-969.
26. Gallagher EJ, LeRoith D. Minireview. IGF, insulin, and cancer. Endocrinology. 2011; 152:2546-2551.
27. Yamashita T, Honda M, Takatori H, Nishino R, Minato H, Takamura H, Ohta T, Kaneko S. Activation of lipogenic pathway correlates with cell proliferation and poor prognosis in hepatocellular carcinoma. J Hepatol. 2009; 50:100-110.
28. Marra M, Sordelli IM, Lombardi A, Lamberti M, Tarantino L, Giudice A, Stiuso P, Abbruzzese A, Sperlongano R, Accardo M, Agresti M, Caraglia M, Sperlongano P. Molecular targets and oxidative stress biomarkers in hepatocellular carcinoma: an overview. J Transl Med. 2011; 9:171. doi: 10.1186/1479-5876-9-171.
29. Caraglia M, Giuberti G, Marra M, Addeo R, Montella L, Murolo M, Sperlongano P, Vincenzi B, Naviglio S, Prete SD, Abbruzzese A, Stiuso P. Oxidative stress and ERK1/2 phosphorylation as predictors of outcome in hepatocellular carcinoma patients treated with sorafenib plus octreotide LAR. Cell Death Dis. 2011; 2:e150. doi: 10.1038/cddis.
30. Vinciguerra M, Carrozzino F, Peyrou M, Carlone S, Montesano R, Benelli R, Foti M. Unsaturated fatty acids promote hepatoma proliferation and progression through downregulation of the tumor suppressor PTEN. J Hepatol. 2009; 50:1132-1141.
31. Park EJ, Lee JH, Yu GY, He G, Ali SR, Holzer RG, Osterreicher CH, Takahashi H, Karin M. Dietary and genetic obesity promote liver inflammation and tumorigenesis by enhancing IL-6 and TNF expression. Cell. 2010; 140:197-208.
32. Giannini EG, Testa R, Savarino V. Liver enzyme alteration: a guide for clinicians. CMAJ. 2005; 172:367-379.
33. Botros M, Sikaris KA. The de ritis ratio: the test of time. Clin Biochem Rev. 2013; 34:117-130.
34. Nunes-Souza V, César-Gomes CJ, Da Fonseca LJ, Da Silva Guedes G, Smaniotto S, Rabelo LA. Aging increases susceptibility to high fat diet-induced metabolic syndrome in C57BL/6 mice: improvement in glycemic and lipid profile after antioxidant therapy. Oxid Med Cell Longev. 2016; 2016:1987960. doi: 10.1155/2016/1987960.
35. Michalopoulos GK. Liver regeneration. J Cell Physiol. 2007; 213:286-300.
36. Kim IH, Kisseleva T, Brenner DA. Aging and liver disease. Curr Opin Gastroenterol. 2015; 31:184-91.
37. Sheedfar F, Di Biase S, Koonen D, Vinciguerra M. Liver diseases and aging: friends or foes? Aging Cell. 2013; 12:950-954.
38. Bartel DP. MicroRNAs: genomics, biogenesis, mechanism, and function. Cell. 2004; 116:281-97.
39. Tessitore A, Cicciarelli G, Del Vecchio F, Gaggiano A, Verzella D, Fischietti M, Vecchiotti D, Capece D, Zazzeroni F, Alesse E. MicroRNAs in the DNA damage/repair network and cancer. Int J Genomics. 2014; 2014:820248. doi: 10.1155/2014/820248.
40. Di Leva G, Garofalo M, Croce CM. MicroRNAs in cancer. Annu Rev Pathol. 2014; 9:287-314.
41. Tessitore A, Cicciarelli G, Mastroiaco V, Vecchio FD, Capece D, Verzella D, Fischietti M, Vecchiotti D, Zazzeroni F, Alesse E. Therapeutic use of microRNAs in cancer. Anticancer Agents Med Chem. 2016; 16:7-19.
42. Del Vecchio F, Gallo F, Di Marco A, Mastroiaco V, Caianiello P, Zazzeroni F, Alesse E, Tessitore A. Bioinformatics approach to predict target genes for dysregulated microRNAs in hepatocellular carcinoma: study on a chemically-induced HCC mouse model. BMC Bioinformatics. 2015; 16:408. doi: 10.1186/s12859.
43. Stiuso P, Potenza N, Lombardi A, Ferrandino I, Monaco A, Zappavigna S, Vanacore D, Mosca N, Castiello F, Porto S, Addeo R, Prete SD, De Vita F, et al. MicroRNA-423-5p promotes autophagy in cancer cells and is increased in serum from hepatocarcinoma patients treated with sorafenib. Mol Ther Nucleic Acids. 2015; 4:e233. doi: 10.1038/mtna.2015.8.
44. Li S, Li J, Fei BY, Shao D, Pan Y, Mo ZH, Sun BZ, Zhang D, Zheng X, Zhang M, Zhang XW, Chen L. MiR-27a promotes hepatocellular carcinoma cell proliferation through suppression of its target gene peroxisome proliferator-activated receptor γ. Chin Med J. 2015; 128:941-7.
45. Zhao N, Sun H, Sun B, Zhu D, Zhao X, Wang Y, Gu Q, Dong X, Liu F, Zhang Y, Li X. MiR-27a-3p suppresses tumor metastasis and VM by down-regulating VE-cadherin expression and inhibiting EMT: an essential role for Twist-1 in HCC. Sci Rep. 2016; 6:23091.
46. Kim HS, Lee KS, Bae HJ, Eun JW, Shen Q, Park SJ, Shin WC, Yang HD, Park M, Park WS, Kang YK, Nam SW. MicroRNA-31 functions as a tumor suppressor by regulating cell cycle and epithelial-mesenchymal transition regulatory proteins in liver cancer. Oncotarget. 2015; 6:8089-102. doi: 10.18632/oncotarget.3512.
47. Yang J, Liu X, Yuan X, Wang Z. MiR-99b promotes metastasis of hepatocellular carcinoma through inhibition of claudin 11 expression and may serve as a prognostic marker. Oncol Rep. 2015; 34:1415-1423.
48. Li W, Chang J, Wang S, Liu X, Peng J, Huang D, Sun M, Chen Z, Zhang W, Guo W, Li J. MiRNA-99b-5p suppresses liver metastasis of colorectal cancer by down-regulating mTOR. Oncotarget. 2015; 6:24448-62. doi: 10.18632/oncotarget.4423.
49. Yang Y, Li X, Yang Q, Wang X, Zhou Y, Jiang T, Ma Q, Wang YJ. The role of microRNA in human lung squamous cell carcinoma. Cancer Genet Cytogenet. 2010; 200:127-133.
50. Dettmer MS, Perren A, Moch H, Komminoth P, Nikiforov YE, Nikiforova MN. MicroRNA profile of poorly differentiated thyroid carcinomas: new diagnostic and prognostic insights. J Mol Endocrinol. 2014; 52:181-189.
51. Tang H, Li RP, Liang P, Zhou YL, Wang GW. MiR-125a inhibits the migration and invasion of liver cancer cells via suppression of the PI3K/AKT/mTOR signaling pathway. Oncol Lett. 2015; 10:681-686.
52. Kim JK, Noh JH, Jung KH, Eun JW, Bae HJ, Kim MG, Chang YG, Shen Q, Park WS, Lee JY, Borlak J, Nam SW. Sirtuin7 oncogenic potential in human hepatocellular carcinoma and its regulation by the tumor suppressors MiR-125a-5p and MiR-125b. Hepatology. 2013; 57:1055-1067.
53. Potenza N, Mosca N, Zappavigna S, Castiello F, Panella M, Ferri C, Vanacore D, Giordano A, Stiuso P, Caraglia M, Russo A. MicroRNA-125a-5p is a downstream effector of sorafenib in its antiproliferative activity toward human hepatocellular carcinoma cells. J Cell Physiol. 2017; 232:1907-1913.
54. Yang Y, Lin X, Lu X, Luo G, Zeng T, Tang J, Jiang F, Li L, Cui X, Huang W, Hou G, Chen X, Ouyang Q, et al. Interferon-microRNA signalling drives liver precancerous lesion formation and hepatocarcinogenesis. Gut. 2016; 65:1186-201.
55. Lechel A, Gougelet A. Early HCC treatment: a future strategy against interferon/miR-484 axis to revert precancerous lesions? Gut. 2016; 65:1073-1074.
56. Kleiner DE, Brunt EM, Van Natta M, Behling C, Contos MJ, Cummings OW, Ferrell LD, Liu YC, Torbenson MS, Unalp-Arida A, Yeh M, McCullough AJ, Sanyal AJ. Nonalcoholic Steatohepatitis Clinical Research Network. Design and validation of a histological scoring system for nonalcoholic fatty liver disease. Hepatology. 2005; 41:1313-1321.
57. Bedossa P, Poitou C, Veyrie N, Bouillot JL, Basdevant A, Paradis V, Tordjman J, Clement K. Histopathological algorithm and scoring system for evaluation of liver lesions in morbidly obese patients. Hepatology. 2012; 56:1751-1759.