
INTRODUCTION
Liver cancer is the second leading cause of cancer-related death among men worldwide. There were an estimated 782,500 new liver cancer cases and 745,500 liver cancer-related deaths in 2012 worldwide. China alone accounted for approximately 50% of the total number of cases and deaths [1]. Liver cancer is a complex and multifactorial disease regulated by both genetic and environmental factors. Epidemiological studies have shown that the major environmental risk factors for liver cancer include chronic Hepatitis B virus (HBV) and Hepatitis C virus (HCV) infection, dietary aflatoxin exposure, alcohol consumption, cigarette smoking, obesity, diabetes, and iron overload [2, 3]. However, not all individuals with exposure to these risk factors develop liver cancer. Hepatocellular carcinoma (HCC) accounts for between 70% and 85% of primary liver cancers. Recently, some Genome-wide association studies (GWAS) have identified several loci associated with the risk of HCC, such as SNPs in the gene KIF1B, MICA, HLA-DQA/DQB, and GRIK1, respectively [4–6].
Acylphosphatase 2 (ACYP2) encodes a small cytosolic enzyme (11 kDa) that is widely expressed in vertebrates. Two isoenzymes have been identified (muscle and erythrocyte) that share 56% sequence identity [7]. ACYP2 hydrolyzes the phosphoenzyme intermediate of various membrane pumps such as the Ca2+/Mg2+-ATPase from the sarcoplasmic reticulum of skeletal muscle [8]. Overexpression of ACYP2 induces cell differentiation [9] and apoptosis [10]. In addition, a genome wide association study demonstrated an association between ACYP2 polymorphisms and telomere length [11].
Interestingly, telomere length was also correlated with risk of liver cancer [12, 13]. However, a direct association between single nucleotide polymorphisms (SNPs) in ACYP2 and susceptibility to liver cancer has not been established. We hypothesized that genetic variations in ACYP2 could influence susceptibility to liver cancer. We selected 13 SNPs from the HapMap databases with a minor allele frequency (MAF) > 5% in the Chinese Han population, and designed a case-control study to investigate the associations between these SNPs and the risk of liver cancer.
RESULTS
Study population
The characteristics of all study participants are shown in Table 1. There were 473 liver cancer patients (390 men and 83 women) and 564 healthy controls (339 men and 225 women) included in the study. The average ages of the cases and controls were 55.8 and 53.9 years, respectively. There were significant differences in the age and gender distribution between the cases and controls (P < 0.05) (Table 1). Therefore, we adjusted for these variables in the multivariate, unconditional logistic regression.
Table 1: Characteristics of the cases and controls
Variables |
Cases (n = 473) |
Controls (n = 564) |
P |
|---|---|---|---|
Sex |
< 0.001 |
||
Male |
390 (82.5%) |
339 (60.1%) |
|
Female |
83 (17.5%) |
225 (39.9%) |
|
Age |
0.010 |
||
yrs (mean ± SD) |
55.8 ± 12.2 |
53.9 ± 11.5 |
SD: Standard deviation.
P < 0.05 indicates statistical significance.
The sequences of the primers that were used to genotype each SNP are shown in Supplementary Table 1. The average SNP call rate was 98.3% in cases and controls. The allele distributions and MAFs of all SNPs and the results of Hardy-Weinberg equilibrium (HWE) tests are shown in Table 2. The genotype distributions of the 13 SNPs among the controls were compatible with HWE (all P > 0.05). The G allele of rs6713088, T allele of rs843711, and A allele of rs843706 were associated with a 1.27-fold, 1.29-fold, and 1.30-fold increased risk of liver cancer, respectively (odds ratio [OR] = 1.27, 95% confidence interval [CI]: 1.07–1.52, P = 0.007; OR = 1.29, 95% CI: 1.09–1.54, P = 0.004; OR = 1.30, 95% CI: 1.09–1.55, P = 0.003, respectively). In contrast, the A allele of rs1682111 was associated with a decreased risk of liver cancer (OR = 0.77, 95% CI: 0.64–0.94, P = 0.007). However, no significant association between SNPs in ACYP2 and liver cancer risk was observed after Bonferroni correction.
Table 2: Allele frequencies distribution and association with the risk of liver cancer
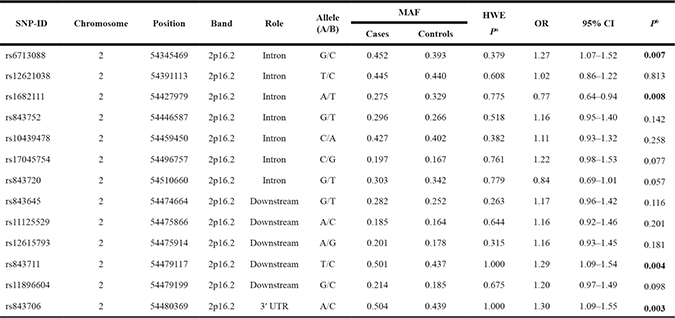
Pa-values were calculated using Fisher’s exact test.
Pb-values were calculated using Pearson’s chi-square test.
P < 0.05 indicates statistical significance.
Significant associations between ACPY2 genotypes and the risk of liver cancer are shown in Table 3. We found that rs6713088, rs843645, rs843711, and rs843706 were associated with an increased risk of liver cancer even after adjustment for age and gender (GG vs. CC: OR = 1.49, 95% CI: 1.02–2.1, P = 0.038; GT vs. TT: OR = 1.40, 95% CI: 1.07–1.82, P = 0.014; TT vs. CC: OR = 1.62, 95% CI: 1.13–2.31, P = 0.008; AA vs. CC: OR = 1.62, 95% CI: 1.13–2.31, P = 0.008, respectively). In contrast, the AT genotype of rs1682111 was associated with a decreased risk of liver cancer compared to the TT genotype (OR = 0.69, 95% CI: 0.53–0.91, P = 0.007, respectively). Interestingly, the AA genotype of rs1682111 was also associated with a decreased risk of liver cancer compared to the TT genotype after adjustment for age and gender (OR = 0.62, 95% CI: 0.39–0.98, P = 0.039). We also found that the GG genotype of rs843720 was associated with a decreased risk of liver cancer compared to the TT genotype without adjustment for age and gender (OR = 0.64, 95% CI: 0.41–1.00, P = 0.048).
Table 3: Genotype frequencies distribution and association with liver risk cancer
SNP-ID |
Genotype |
Cases |
Controls |
Without adjustment |
With adjustment |
||||
|---|---|---|---|---|---|---|---|---|---|
OR |
95% CI |
Pa |
OR |
95% CI |
Pb |
||||
CC |
138 |
202 |
1.00 |
– |
1.00 |
– |
|||
rs6713088 |
GC |
242 |
279 |
1.27 |
0.96–1.67 |
0.091 |
1.27 |
0.95–1.69 |
0.100 |
GG |
93 |
82 |
1.66 |
1.15–2.40 |
0.007 |
1.49 |
1.02–2.18 |
0.038 |
|
CC |
139 |
180 |
1.00 |
– |
1.00 |
– |
|||
rs12621038 |
TC |
245 |
271 |
1.17 |
0.88–1.55 |
0.271 |
1.28 |
0.96–1.71 |
0.098 |
TT |
87 |
112 |
1.01 |
0.70–1.44 |
0.974 |
1.08 |
0.75–1.56 |
0.685 |
|
TT |
251 |
252 |
1.00 |
– |
1.00 |
– |
|||
rs1682111 |
AT |
181 |
253 |
0.72 |
0.55–0.93 |
0.012 |
0.69 |
0.53–0.91 |
0.007 |
AA |
39 |
59 |
0.66 |
0.43–1.03 |
0.068 |
0.62 |
0.39–0.98 |
0.039 |
|
TT |
232 |
306 |
1.00 |
– |
1.00 |
– |
|||
rs843752 |
GT |
201 |
214 |
1.24 |
0.96–1.60 |
0.103 |
1.23 |
0.94–1.61 |
0.127 |
GG |
39 |
43 |
1.20 |
0.75–1.91 |
0.451 |
1.13 |
0.70–1.83 |
0.612 |
|
AA |
154 |
206 |
1.00 |
– |
– |
1.00 |
– |
– |
|
rs10439478 |
CA |
233 |
261 |
1.19 |
0.91–1.57 |
0.204 |
1.20 |
0.91–1.60 |
0.201 |
CC |
85 |
96 |
1.18 |
0.83–1.70 |
0.355 |
1.31 |
0.90–1.90 |
0.162 |
|
GG |
302 |
390 |
1.00 |
– |
– |
1.00 |
– |
– |
|
rs17045754 |
CG |
156 |
160 |
1.26 |
0.96–1.64 |
0.091 |
1.27 |
0.96–1.67 |
0.095 |
CC |
15 |
14 |
1.38 |
0.66–2.91 |
0.392 |
1.37 |
0.63–2.97 |
0.421 |
|
TT |
224 |
242 |
1.00 |
– |
– |
1.00 |
– |
– |
|
rs843720 |
GT |
210 |
258 |
0.88 |
0.68–1.14 |
0.327 |
0.85 |
0.65–1.11 |
0.243 |
GG |
38 |
64 |
0.64 |
0.41–1.00 |
0.048 |
0.64 |
0.41–1.01 |
0.057 |
|
TT |
235 |
321 |
1.00 |
– |
– |
1.00 |
– |
– |
|
rs843645 |
GT |
206 |
202 |
1.39 |
1.08–1.80 |
0.011 |
1.40 |
1.07–1.82 |
0.014 |
GG |
30 |
41 |
1.00 |
0.61–1.65 |
0.998 |
0.96 |
0.57–1.60 |
0.868 |
|
CC |
310 |
392 |
1.00 |
– |
– |
1.00 |
– |
– |
|
rs11125529 |
AC |
149 |
159 |
1.19 |
0.91–1.55 |
0.216 |
1.20 |
0.91–1.58 |
0.204 |
AA |
13 |
13 |
1.27 |
0.58–2.77 |
0.557 |
1.16 |
0.52–2.60 |
0.718 |
|
GG |
297 |
377 |
1.00 |
– |
1.00 |
– |
|||
rs12615793 |
AG |
160 |
173 |
1.17 |
0.90–1.53 |
0.233 |
1.18 |
0.90–1.55 |
0.243 |
AA |
15 |
14 |
1.36 |
0.65–2.86 |
0.418 |
1.21 |
0.56–2.60 |
0.630 |
|
CC |
126 |
178 |
1.00 |
– |
1.00 |
– |
|||
rs843711 |
TC |
218 |
278 |
1.11 |
0.83–1.48 |
0.488 |
1.13 |
0.84–1.52 |
0.426 |
TT |
127 |
107 |
1.68 |
1.19–2.37 |
0.003 |
1.62 |
1.13–2.31 |
0.008 |
|
CC |
288 |
376 |
1.00 |
– |
1.00 |
– |
|||
rs11896604 |
GC |
164 |
167 |
1.28 |
0.98–1.67 |
0.066 |
1.32 |
1.00–1.73 |
0.050 |
GG |
19 |
21 |
1.18 |
0.62–2.24 |
0.610 |
1.08 |
0.56–2.08 |
0.824 |
|
CC |
124 |
177 |
1.00 |
– |
1.00 |
– |
|||
rs843706 |
AC |
219 |
277 |
1.13 |
0.84–1.51 |
0.414 |
1.14 |
0.84–1.53 |
0.404 |
AA |
128 |
108 |
1.69 |
1.20–2.39 |
0.003 |
1.62 |
1.13–2.31 |
0.008 |
|
P-values were calculated using the Wald test.
P < 0.05 indicates statistical significance.
The results of genetic model analyses (dominant, recessive, and additive) after adjustment for age and gender are presented in Table 4. We found that rs6713088 was associated with a 1.32-fold and 1.23-fold increased risk of liver cancer under the dominant model (OR = 1.32, 95% CI: 1.01–1.74, P = 0.043) and additive model (OR = 1.23, 95% CI: 1.02–1.48, P = 0.028), respectively. Additionally, rs843645 was associated with an increased risk of liver cancer under the dominant model (OR = 1.32, 95% CI: 1.02–1.70, P = 0.033). Rs843711 and rs843706 were associated with an increased risk of liver cancer under the recessive model (OR = 1.50, 95% CI: 1.11–2.03, P = 0.009; OR = 1.49, 95% CI: 1.10–2.02, P = 0.009, respectively) and additive model (OR = 1.26, 95% CI: 1.06–1.51, P = 0.010; OR = 1.26, 95% CI: 1.06–1.51, P = 0.010, respectively). In contrast, rs1682111 was associated with a decreased risk of liver cancer under both the dominant and additive model (OR = 0.68, 95% CI: 0.53–0.88, P = 0.003; OR = 0.75, 95% CI: 0.61–0.91, P = 0.004, respectively). Finally, rs843720 was associated with a decreased risk of liver cancer under the additive model (OR = 0.82, 95% CI: 0.68–1.00, P = 0.049).
Table 4: Genetic model analyses of the association between SNPs in ACPY2 and the risk of liver cancer
SNP-ID |
Dominant |
Recessive |
Additive |
||||||
|---|---|---|---|---|---|---|---|---|---|
OR |
95% CI |
P |
OR |
95% CI |
P |
OR |
95% CI |
P |
|
rs6713088 |
1.32 |
1.01–1.74 |
0.043 |
1.29 |
0.92–1.81 |
0.138 |
1.23 |
1.02–1.48 |
0.028 |
rs12621038 |
1.22 |
0.93–1.61 |
0.158 |
0.93 |
0.67–1.28 |
0.646 |
1.06 |
0.80–1.28 |
0.499 |
rs1682111 |
0.68 |
0.53–0.88 |
0.003 |
0.73 |
0.47–1.14 |
0.168 |
0.75 |
0.61–0.91 |
0.004 |
rs843752 |
1.21 |
0.94–1.56 |
0.135 |
1.03 |
0.65–1.65 |
0.886 |
1.13 |
0.93–1.38 |
0.218 |
rs10439478 |
1.23 |
0.94–1.61 |
0.130 |
1.17 |
0.84–1.64 |
0.351 |
1.15 |
0.96–1.38 |
0.125 |
rs17045754 |
1.28 |
0.97–1.67 |
0.077 |
1.27 |
0.59–2.74 |
0.536 |
1.24 |
0.97–1.57 |
0.080 |
rs843720 |
0.81 |
0.63–1.05 |
0.109 |
0.70 |
0.45–1.08 |
0.103 |
0.82 |
0.68–1.00 |
0.049 |
rs843645 |
1.32 |
1.02–1.70 |
0.033 |
0.83 |
0.50–1.37 |
0.471 |
1.16 |
0.94–1.42 |
0.158 |
rs11125529 |
1.20 |
0.91–1.57 |
0.197 |
1.10 |
0.49–2.45 |
0.818 |
1.16 |
0.91–1.48 |
0.226 |
rs12615793 |
1.18 |
0.90–1.54 |
0.224 |
1.15 |
0.53–2.45 |
0.728 |
1.15 |
0.91–1.46 |
0.238 |
rs843711 |
1.27 |
0.96–1.68 |
0.095 |
1.50 |
1.11–2.03 |
0.009 |
1.26 |
1.06–1.51 |
0.010 |
rs11896604 |
1.29 |
0.99–1.68 |
0.061 |
0.98 |
0.51–1.89 |
0.960 |
1.20 |
0.96–1.50 |
0.115 |
rs843706 |
1.28 |
0.96–1.69 |
0.090 |
1.49 |
1.10–2.02 |
0.009 |
1.26 |
1.06–1.51 |
0.010 |
P-values were calculated using the Wald test with adjustment for age and gender.
P < 0.05 indicates statistical significance.
We next analyzed the association between ACYP2 haplotypes and the risk of liver cancer. We identified one linkage disequilibrium (LD) block consisting of eight SNPs (rs1682111, rs843752, rs10439478, rs843645, rs11125529, rs12615793, rs843711, and rs11896604). A second block consisting of two SNPs (rs843706 and rs17045754) also exhibited strong LD as shown in Figure 1. The ATATCGCC and CG haplotypes were associated with a decreased risk of liver cancer (OR = 0.76, 95% CI: 0.62–0.92, P = 0.006; OR = 0.78, 95% CI: 0.65–0.93, P = 0.006, respectively) (Table 5).
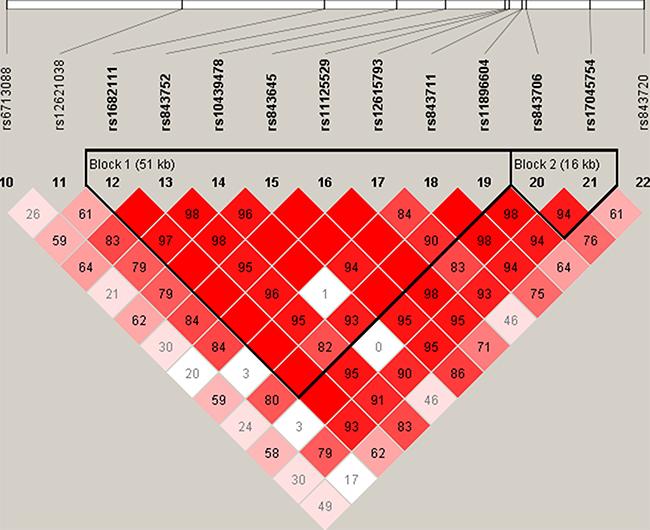
Figure 1: Linkage disequilibrium analysis of the 13 SNPs in ACYP2. Block 1 includes rs1682111, rs843752, rs10439478, rs843645, rs11125529, rs12615793, rs843711, and rs11896604. Block 2 includes rs843706 and rs17045754.
Table 5: Association between ACYP2 haplotypes and the risk of liver cancer
SNPs |
Haplotype |
Without adjustment |
With adjustment |
||||
|---|---|---|---|---|---|---|---|
OR |
95% CI |
P |
OR |
95% CI |
P |
||
rs1682111/rs843752/rs10439478/rs843645/rs11125529/rs12615793/rs843711/rs11896604 |
ATATCGCC |
0.78 |
0.64–0.94 |
0.010 |
0.76 |
0.62–0.92 |
0.006 |
TTCTAATG |
1.18 |
0.94–1.49 |
0.160 |
1.18 |
0.93–1.51 |
0.176 |
|
TGAGCGTC |
1.14 |
0.93–1.39 |
0.204 |
1.12 |
0.91–1.38 |
0.288 |
|
TTCTCGCC |
0.95 |
0.76–1.18 |
0.641 |
1.02 |
0.81–1.28 |
0.851 |
|
TTCTCGTG |
1.21 |
0.55–2.63 |
0.636 |
1.19 |
0.53–2.67 |
0.677 |
|
TTCTCACC |
0.9 |
0.43–1.88 |
0.789 |
0.81 |
0.38–1.72 |
0.587 |
|
rs843706/rs17045754 |
AC |
1.21 |
0.96–1.53 |
0.100 |
1.22 |
0.96–1.55 |
0.107 |
AG |
1.21 |
1.00–1.46 |
0.055 |
1.17 |
0.96–1.43 |
0.115 |
|
CG |
0.76 |
0.64–0.91 |
0.002 |
0.78 |
0.65–0.93 |
0.006 |
|
P-values were calculated using the Wald test.
P < 0.05 indicates statistical significance.
DISCUSSION
We evaluated the relationships between 13 SNPs in ACYP2 and the risk of liver cancer in a Han Chinese population. Our results indicated that rs6713088, rs843645, rs843711, and rs843706 were associated with an increased risk of liver cancer. In contrast, rs1682111, rs843720, the ATATCGCC haplotype (rs1682111, rs843752, rs10439478, rs843645, rs11125529, rs12615793, rs843711, and rs11896604), and the CG haplotype (rs843706 and rs17045754) were associated with a decreased risk of liver cancer.
We did not observe an association between rs11125529 and the risk of liver cancer. Previous studies have investigated the association between rs11125529 and coronary heart disease (CHD) [14], gastric cancer [15], high-altitude pulmonary edema (HAPE) [16], glioma [17], and head and neck squamous cell carcinoma [18]. However, no significant associations have been detected. Rs11125529 was associated with a decreased risk of breast cancer in a Han Chinese population based on a genotype model (AC vs. CC) [19], but it was associated with an increased risk of ischemic stroke [20]. A recent genome-wide meta-analysis found that rs11125529 in ACYP2 was associated with telomere length [11]. Telomeres are critical for maintaining chromosomal stability and integrity [21–23]. They are approximately 10–15kb in human somatic cells and become progressively shorter by approximately 30–200 bp with each round of cell division as a result of incomplete DNA replication at the 3′ ends of chromosomes [24]. A reduction in telomere length to a critical threshold can lead to double-strand breaks, cell senescence, or apoptosis, which can accelerate human aging and death [21, 25]. Telomere length has been implicated in the development of multiple cancers, including hepatocellular carcinoma [12], lung [26], breast [27], bladder [28], and gastric [29], and so on.
We found that rs843711 and rs843706 were associated with an increased risk of liver cancer. rs843711 was reported previously associated with an increased risk of ischemic stroke [20], and similar results were obtained for rs843706, it was observed to be associated with an increased risk of breast cancer in a Han Chinese population [19]. In the study, no association was observed between the four SNPs (rs12621038, rs17045754, rs12615793, and rs11896604) and the risk of liver cancer. However, previous studies have demonstrated that rs12621038 and rs17045754 were associated with a decreased risk of breast cancer [30], but rs17045754 was found associated with an increased risk of ischemic stroke [20]. Rs12615793 and rs11896604 were discovered that them were associated with a decreased risk of HAPE [16], but the two SNPs were reported previously associated with an increased risk of ischemic stroke [20]. In addition, rs11896604 was reported previously associated with a decreased risk of breast cancer [19]. We found that rs6713088 was associated with an increased risk of liver cancer in the present study, and it was associated with an increased risk of ischemic stroke in a Han Chinese Population [20]. Simultaneously, we observed that rs1682111 was associated with a decreased risk of liver cancer in the study. However, it was reported previously associated with an increased risk of breast cancer [30] and lung cancer [31]. This phenomenon may be due to the impact of SNPs on different diseases is different. Interestingly, telomere length has been associated with liver cancer risk. Therefore, ACYP2 polymorphisms may contribute to liver cancer through impacting telomere length.
Hepatocarcinogenesis is through that the genomic changes progressively alter the hepatocellular phenotype, thereby produce cellular intermediates, and ultimately develop into liver cancer [32]. The pathogenesis of liver cancer is considered a multistep and complex process. Previous study has shown that HBV and HCV infection often cause hepatitis, hepatic damage, and subsequent cirrhosis, eventually initiating liver carcinogenesis [33]. Inflammation is also closely associated with liver cancer initiation, progression, and metastasis. Inflammatory cells by releasing chemicals to induce peripheral cell mutation, and promoting the development of liver cancer [34]. Carcinogens (as pesticides) can promote spontaneous initiation, cytotoxicity with sustained cell proliferation, oxidative stress, formation of activated receptors and some others to increase the risk of liver cancer [35]. In addition, previous reports showed that multiple genetic and epigenetic changes are involved in the molecular pathogenesis of liver cancer, for example, somatic mutations in the p53 tumor suppressor gene (TP53) and the activation of the WNT signal transduction pathway [33, 36]. However, the pathogenesis of liver cancer has not been elucidated completely, and need to be further explored in the future.
Our study had several limitations. First, all study participants were of the Han Chinese population and our sample size was relatively small. Second, many other risk factors including smoking and alcohol consumption were not analyzed due to a lack of corresponding clinical data. Third, we did not perform any functional analyses. Finally, because our study is the first to report associations between ACPY2 SNPs and liver cancer, larger and more comprehensive analyses of other patient populations must be performed to confirm our results.
In conclusion, our results demonstrate that rs6713088, rs843645, rs843711, and rs843706 are associated with an increased risk of liver cancer, and that rs1682111, rs843720, and the haplotypes (ATATCGCC and CG) are associated with a decreased risk of liver cancer in the Han Chinese. Our study provides theoretical basis for the prediction of liver cancer risk and the studies on the pathogenesis of liver cancer.
MATERIALS AND METHODS
Study participants
A total of 473 patients who were diagnosed with liver cancer and admitted to the Second People’s Hospital of Hainan Province and the Agricultural Reclamation General Hospital of Hainan Province between May 2014 and June 2015 were enrolled in the study. The control group consisted of 564 randomly selected individuals from the health examination center of the Second People’s Hospital of Hainan Province and the Agricultural Reclamation General Hospital of Hainan Province during the same period with no history of cancer or other diseases. All patients with the diagnosis of liver cancer should be confirmed by pathological examinations. All cases were verified, and the patients were recruited without any restrictions regarding age, sex, or disease stage. All subjects were unrelated Han Chinese whose ancestors had lived in the region for at least three generations. Patients with previous history of other cancers, cancer-related treatments, surgical contraindication, pregnancy, embryo-derived tumour, active liver disease, psychiatric history or poor compliance were excluded. The study protocol was approved by the Ethics Committee of the Second People’s Hospital of Hainan Province and Northwest University, and was performed in accordance with the Declaration of Helsinki. Written informed consent was obtained from each patient prior to participation in the study.
DNA extraction
We collected 5 mL of peripheral venous blood from each participant into vacutainer tubes containing ethylene diamine tetra-acetic acid. The blood samples were stored at −80°C until use. Genomic DNA was extracted from whole blood samples using the GoldMag-Mini Whole Blood Genomic DNA Purification Kit according to the manufacturer’s protocol (GoldMag. Co. Ltd., Xi’an, China). DNA samples were stored at −4°C for future use. DNA concentration and purity were evaluated using a spectrophotometer (NanoDrop 2000; Thermo Fisher Scientific, Waltham, MA, USA).
SNPs selection and genotyping
Thirteen SNPs (rs6713088, rs12621038, rs1682111, rs843752, rs10439478, rs17045754, rs843720, rs843645, rs11125529, rs12615793, rs843711, rs11896604, and rs843706) in ACYP2 have been previously reported that are associated with several diseases and cancers risks, such as CHD [14], HAPE [16], ischemic stroke [20], breast [19, 30] and lung cancer [31], and the thirteen SNPs with a MAF > 5% in the HapMap of the Chinese Han Beijing (CHB) population were selected for genotyping. The PCR primers for each SNP were designed using the Sequenom MassARRAY Assay Design 3.0 Software (Sequenom, San Diego, CA, USA). Genotyping was performed using the Sequenom MassARRAY platform and the manufacturer’s protocol. Data management and analysis were performed using the Sequenom Typer 4.0 software.
Statistical analysis
All statistical analyses were performed using the Statistical Package for Social Sciences (SPSS, version 19.0) and Microsoft Excel. The genotype frequency distribution of the 13 SNPs in the controls was analyzed for deviations from HWE using Pearson’s chi-square tests. Age, gender, allele, and genotype frequencies were compared between the cases and groups using chi-square tests/Fisher’s exact tests. We analyzed the associations between SNPs in ACPY2 and the risk of liver cancer under dominant, recessive, and additive genetic models using the PLINK software. We used the Haploview software package (version 4.2) platform for analyses of pairwise LD and haplotype structure. ORs and 95% CIs were calculated using unconditional logistic regression models and adjusted for age and gender. A P-value < 0.05 was considered statistically significant and all statistical tests were two-sided.
ACKNOWLEDGMENTS
We wish to thank all the patients for providing blood samples. We also thank the staff for collecting the data.
CONFLICTS OF INTEREST
The authors declare that there are no conflicts of interest.
GRANT SUPPORT
None.
REFERENCES
1. Torre LA, Bray F, Siegel RL, Ferlay J, Lortet-Tieulent J, Jemal A. Global cancer statistics, 2012. CA Cancer J Clin. 2015; 65:87–108.
2. Srivatanakul P, Sriplung H, Deerasamee S. Epidemiology of liver cancer: an overview. Asian Pacific journal of cancer prevention. 2004; 5:118–125.
3. Chuang SC, La Vecchia C, Boffetta P. Liver cancer: descriptive epidemiology and risk factors other than HBV and HCV infection. Cancer letters. 2009; 286:9–14.
4. Zhang H, Zhai Y, Hu Z, Wu C, Qian J, Jia W, Ma F, Huang W, Yu L, Yue W, Wang Z, Li P, Zhang Y, et al. Genome-wide association study identifies 1p36.22 as a new susceptibility locus for hepatocellular carcinoma in chronic hepatitis B virus carriers. Nature genetics. 2010; 42:755–758.
5. Kumar V, Kato N, Urabe Y, Takahashi A, Muroyama R, Hosono N, Otsuka M, Tateishi R, Omata M, Nakagawa H, Koike K, Kamatani N, Kubo M, et al. Genome-wide association study identifies a susceptibility locus for HCV-induced hepatocellular carcinoma. Nature genetics. 2011; 43:455–458.
6. Li S, Qian J, Yang Y, Zhao W, Dai J, Bei JX, Foo JN, McLaren PJ, Li Z, Yang J, Shen F, Liu L, Yang J, et al. GWAS identifies novel susceptibility loci on 6p21.32 and 21q21.3 for hepatocellular carcinoma in chronic hepatitis B virus carriers. PLoS genetics. 2012; 8:e1002791.
7. Stefani M, Taddei N, Ramponi G. Insights into acylphosphatase structure and catalytic mechanism. Cellular and molecular life sciences. 1997; 53:141–151.
8. Modesti A, Raugei G, Taddei N, Marzocchini R, Vecchi M, Camici G, Manao G, Ramponi G. Chemical synthesis and expression of a gene coding for human muscle acylphosphatase. Biochimica et biophysica acta. 1993; 1216:369–374.
9. Cecchi C, Liguri G, Fiorillo C, Bogani F, Gambassi M, Giannoni E, Cirri P, Baglioni S, Ramponi G. Acylphosphatase overexpression triggers SH-SY5Y differentiation towards neuronal phenotype. Cellular and molecular life sciences. 2004; 61:1775–1784.
10. Giannoni E, Cirri P, Paoli P, Fiaschi T, Camici G, Manao G, Raugei G, Ramponi G. Acylphosphatase is a strong apoptosis inducer in HeLa cell line. Molecular cell biology research communications. 2000; 3:264–270.
11. Codd V, Nelson CP, Albrecht E, Mangino M, Deelen J, Buxton JL, Hottenga JJ, Fischer K, Esko T, Surakka I, Broer L, Nyholt DR, Mateo Leach I, et al. Identification of seven loci affecting mean telomere length and their association with disease. Nature genetics. 2013; 45:422–427, 427e421–422.
12. Liu J, Yang Y, Zhang H, Zhao S, Liu H, Ge N, Yang H, Xing JL, Chen Z. Longer leukocyte telomere length predicts increased risk of hepatitis B virus-related hepatocellular carcinoma: a case-control analysis. Cancer. 2011; 117:4247–4256.
13. Huang GT, Lee HS, Chen CH, Chiou LL, Lin YW, Lee CZ, Chen DS, Sheu JC. Telomerase activity and telomere length in human hepatocellular carcinoma. European journal of cancer. 1998; 34:1946–1949.
14. Ding H, Yan F, Zhou LL, Ji XH, Gu XN, Tang ZW, Chen RH. Association between previously identified loci affecting telomere length and coronary heart disease (CHD) in Han Chinese population. Clinical interventions in aging. 2014; 9:857–861.
15. Du J, Zhu X, Xie C, Dai N, Gu Y, Zhu M, Wang C, Gao Y, Pan F, Ren C, Ji Y, Dai J, Ma H, et al. Telomere length, genetic variants and gastric cancer risk in a Chinese population. Carcinogenesis. 2015; 36:963–970.
16. He Y, Zhang X, Li X, Du J, He X, Zhang Z, Zhang Y, Kang L, Jin T, Yuan D. Telomere length-related gene ACYP2 polymorphism is associated with the risk of HAPE in Chinese Han population. The journal of gene medicine. 2016; 18:244–249.
17. Walsh KM, Codd V, Rice T, Nelson CP, Smirnov IV, McCoy LS, Hansen HM, Elhauge E, Ojha J, Francis SS, Madsen NR, Bracci PM, Pico AR, et al. Longer genotypically-estimated leukocyte telomere length is associated with increased adult glioma risk. Oncotarget. 2015; 6:42468–42477. https://doi.org/10.18632/oncotarget.6468.
18. Gu Y, Yu C, Miao L, Wang L, Xu C, Xue W, Du J, Yuan H, Dai J, Jin G, Hu Z, Ma H, Shen H. Telomere length, genetic variants and risk of squamous cell carcinoma of the head and neck in Southeast Chinese. Scientific reports. 2016; 6:20675.
19. Liu M, Li B, Guo W, Zhang X, Chen Z, Li J, Yan M, Chen C, Jin T. Association between single nucleotide polymorphisms in the TSPYL6 gene and breast cancer susceptibility in the Han Chinese population. Oncotarget. 2016; 7:54771–54781. https://doi.org/10.18632/oncotarget.10754.
20. Liang Y, Zhang R, Zhang S, Ji G, Shi P, Yang T, Liu F, Feng J, Li C, Guo D, Chen M. Association of ACYP2 and TSPYL6 Genetic Polymorphisms with Risk of Ischemic Stroke in Han Chinese Population. Molecular neurobiology. 2016 Sep 29. [Epub ahead of print].
21. Blackburn EH, Greider CW, Szostak JW. Telomeres and telomerase: the path from maize, Tetrahymena and yeast to human cancer and aging. Nature medicine. 2006; 12:1133–1138.
22. Zhu X, Han W, Xue W, Zou Y, Xie C, Du J, Jin G. The association between telomere length and cancer risk in population studies. Scientific reports. 2016; 6:22243.
23. Blackburn EH. Telomeres and telomerase: the means to the end (Nobel lecture). Angewandte Chemie. 2010; 49:7405–7421.
24. Harley CB. Human ageing and telomeres. Ciba Foundation symposium. 1997; 211:129–139.
25. Allsopp RC, Vaziri H, Patterson C, Goldstein S, Younglai EV, Futcher AB, Greider CW, Harley CB. Telomere length predicts replicative capacity of human fibroblasts. Proceedings of the National Academy of Sciences of the United States of America. 1992; 89:10114–10118.
26. Jang JS, Choi YY, Lee WK, Choi JE, Cha SI, Kim YJ, Kim CH, Kam S, Jung TH, Park JY. Telomere length and the risk of lung cancer. Cancer science. 2008; 99:1385–1389.
27. Shen J, Terry MB, Gurvich I, Liao Y, Senie RT, Santella RM. Short telomere length and breast cancer risk: a study in sister sets. Cancer research. 2007; 67:5538–5544.
28. McGrath M, Wong JY, Michaud D, Hunter DJ, De Vivo I. Telomere length, cigarette smoking, and bladder cancer risk in men and women. Cancer epidemiology, biomarkers & prevention. 2007; 16:815–819.
29. Hou L, Savage SA, Blaser MJ, Perez-Perez G, Hoxha M, Dioni L, Pegoraro V, Dong LM, Zatonski W, Lissowska J, Chow WH, Baccarelli A. Telomere length in peripheral leukocyte DNA and gastric cancer risk. Cancer epidemiology, biomarkers & prevention. 2009; 18:3103–3109.
30. Zhang F, Zhang Y, Deng Z, Xu P, Zhang X, Jin T, Liu Q. Genetic variants in the acylphosphatase 2 gene and the risk of breast cancer in a Han Chinese population. Oncotarget. 2016; 7:86704–86712. https://doi.org/10.18632/oncotarget.13495.
31. Chen N, Yang X, Guo W, You J, Wu Q, Zhang G, Li H, Geng D, Jin T, Fu J, Zhang Y. Association of polymorphisms in the telomere-related gene ACYP2 with lung cancer risk in the Chinese Han population. Oncotarget. 2016; 7:87473–87478. https://doi.org/10.18632/oncotarget.13870.
32. Thorgeirsson SS, Grisham JW. Molecular pathogenesis of human hepatocellular carcinoma. Nature genetics. 2002; 31:339–346.
33. Han ZG. Functional genomic studies: insights into the pathogenesis of liver cancer. Annual review of genomics and human genetics. 2012; 13:171–205.
34. Grivennikov SI, Greten FR, Karin M. Immunity, inflammation, and cancer. Cell. 2010; 140:883–899.
35. Rakitsky VN, Koblyakov VA, Turusov VS. Nongenotoxic (epigenetic) carcinogens: pesticides as an example. A critical review. Teratogenesis, carcinogenesis, and mutagenesis. 2000; 20:229–240.
36. Hussain SP, Schwank J, Staib F, Wang XW, Harris CC. TP53 mutations and hepatocellular carcinoma: insights into the etiology and pathogenesis of liver cancer. Oncogene. 2007; 26:2166–2176.