
INTRODUCTION
Myasthenia gravis (MG) is an autoimmunological inflammatory disorder characterized by fluctuating muscle weakness and abnormal fatigability [1]. The pathogenesis of MG has not been fully understood, but growing evidences have indicated that the inflammation could be a key factor of MG [2–4]. Noninvasive inflammatory markers, such as C-reactive protein (CRP), interleukin-6 (IL-6), interleukin-17 (IL-17), tumor necrosis factor-α (TNF-α), have been tested to reflex inflammatory status in MG patients [4–6]. Nevertheless, the optimal assessment for the inflammatory status of MG patients has not been developed yet.
Recently, the neutrophil-to-lymphocyte ratio (NLR), a particular white blood cells (WBC) parameter which can be easily obtained from the differential WBC count, has been identified as a new potential indicator of subclinical systemic inflammation in various diseases, including sepsis [7], vestibular neuritis [8], psoriasis [9], chronic kidney disease [10] and the like. Moreover, previous studies have shown that an elevated NLR is associated with disease activity and mortality in several diseases [11–13]. As a novel reliable indicator of systemic inflammatory status and disease activity, NLR has also been applied in estimating estimate the activity of autoimmunological diseases [14–16]. Therefore, we aimed to investigate the role of NLR in MG patients and its relationship between inflammatory response and the disease activity.
RESULTS
Baseline characteristics of the study subjects
Among the 379 research candidates, 172 were diagnosed as MG, 207 were HCs. The demographic characteristics of the MG patients and the HCs are elaborated in Table 1. There was not any statistically significant difference in the age or gender among two groups of the study participants. When compared with HC subjects, the MG patients, no matter male or female, had higher NLR levels (P < 0.001).
Table 1: Demographic and laboratory characteristics of MG patients and healthy controls
MG (n = 172) |
HC (n = 207) |
P value |
|
|---|---|---|---|
Age (years) |
45.40 ± 17.41 |
43.69 ± 14.74 |
0.307 |
Gender (male, n.%) |
71 (41.28) |
94 (45.4) |
0.419 |
WBC (× 109/L) |
7.19 ± 3.19 |
6.19 ± 1.61 |
< 0.001 |
NLR |
1.94 (1.28–2.84) |
1.60 (1.21–2.04) |
< 0.001 |
Male |
1.81 (1.42–2.62) |
1.52 (1.20–1.95) |
< 0.001 |
Female |
2.00 (1.25–2.92) |
1.64 (1.23–2.08) |
< 0.001 |
Abbreviations: WBC, white blood cells; NLR, neutrophil-to-lymphocyte ratio.
After the evaluation of clinical laboratory data, MG patients were divided into three groups according to the values of NLR. Among these three subgroups, there were no statistical differences in terms of age, gender, body mass index (BMI), smoking habits, hypertension, diabetes mellitus, cardiopulmonary disease, RBC, hemoglobin, platelet, Tbil, Dbil, Ibil, total protein, creatinine, total cholesterol (TC), triglyceride, HDL-C, LDL-C, age of onset or thymus histology. WBC, BUN, duration of disease, and incidences of severe disease activity and myasthenic crisis of the patients in T3 group were remarkably increased when compared with those in T1 group (P < 0.001, P = 0.013, P = 0.046, P < 0.001, P < 0.001, respectively), conversely, albumin and UA were dramatically declined (both P < 0.001) (Table 2).
Table 2: Characteristics of patients with MG according to NLR quartiles
Variable |
Total (n = 172) |
NLR < 1.58 (n = 57) |
1.58 ≤ NLR ≤ 2.33 (n = 57) |
NLR > 2.33 (n = 58) |
P value |
|---|---|---|---|---|---|
Age (years) |
45.40 ± 17.41 |
43.09 ± 17.61 |
43.53 ± 17.08 |
49.52 ± 17.07 |
0.085 |
Gender (male, n.%) |
71 (41.28) |
22 (38.60) |
26 (45.61) |
23 (39.66) |
0.714 |
BMI (kg/m2) |
22.49 ± 3.20 |
22.30 ± 2.88 |
22.67 ± 2.50 |
22.52 ± 4.06 |
0.827 |
Smoking (n.%) |
29 (16.86) |
12 (21.05) |
11 (19.30) |
6 (10.34) |
0.258 |
Hypertension (n.%) |
36 (20.93) |
10 (17.54) |
10 (17.54) |
16 (27.59) |
0.310 |
Diabetes mellitus (n.%) |
20 (11.63) |
3 (5.26) |
6 (10.53) |
11 (18.97) |
0.069 |
Cardiopulmonary disease (n.%) |
10 (5.81) |
1 (1.75) |
4 (7.02) |
5 (8.62) |
0.349 |
WBC (× 109/L) |
7.19 ± 3.19 |
5.60 ± 2.11 |
6.72 ± 2.64 |
9.21 ± 3.54 |
< 0.001 |
RBC (× 1012/L) |
4.37 ± 0.50 |
4.36 ± 0.55 |
4.38 ± 0.43 |
4.37 ± 0.52 |
0.985 |
Hemoglobin (g/L) |
132.57 ±15.25 |
132.21 ± 13.91 |
133.91 ± 15.03 |
131.60 ± 16.82 |
0.705 |
Platelet (× 109/L) |
206.70 ± 58.33 |
209.89 ± 57.02 |
207.25 ± 59.03 |
203.03 ± 59.71 |
0.818 |
Tbil (μmol/L) |
11.33 ± 5.08 |
11.84 ± 5.76 |
11.23 ± 4.42 |
10.93 ± 5.03 |
0.622 |
Dbil (μmol/L) |
3.94 ± 1.92 |
4.00 ± 2.05 |
3.91 ± 1.54 |
3.91 ± 2.15 |
0.962 |
Ibil (μmol/L) |
7.39 ± 3.46 |
7.84 ± 3.89 |
7.32 ± 3.37 |
7.02 ± 3.09 |
0.436 |
Total protein (g/L) |
69.06 ± 6.06 |
69.21 ± 4.38 |
69.91 ± 5.86 |
68.07 ± 7.47 |
0.259 |
Albumin (g/L) |
39.68 ± 4.11 |
40.51 ± 4.00 |
40.94 ± 3.36 |
37.62 ± 4.16 |
< 0.001 |
BUN (mmol/L) |
4.98 ± 1.62 |
4.80 ± 1.35 |
4.65 ± 1.20 |
5.48 ± 2.07 |
0.013 |
Creatinine (mmol/L) |
58.34 ± 12.95 |
57.82 ± 12.22 |
60.77 ± 12.67 |
56.47 ± 13.74 |
0.191 |
UA (μmol /L) |
284.26 ± 93.53 |
302.61 ± 83.98 |
306.39 ± 80.04 |
244.47 ± 102.86 |
< 0.001 |
TC (mmol/L) |
4.69 ± 1.25 |
4.68 ± 0.87 |
4.58 ± 1.56 |
4.80 ± 1.25 |
0.645 |
Triglyceride (mmol/L) |
1.33 ± 0.70 |
1.17 ± 0.54 |
1.40 ± 0.70 |
1.44 ± 0.80 |
0.076 |
HDL-C (mmol/L) |
1.25 ± 0.36 |
1.23 ± 0.33 |
1.24 ± 0.41 |
1.28 ± 0.34 |
0.770 |
LDL-C (mmol/L) |
2.79 ± 0.99 |
2.88 ± 0.70 |
2.67 ± 1.21 |
2.83 ± 1.00 |
0.497 |
Age of onset (years) |
|||||
< 50 |
100 |
32 |
35 |
33 |
0.827 |
≥ 50 |
72 |
25 |
22 |
25 |
|
Duration of disease (years) |
|||||
≤ 1 |
121 |
45 |
42 |
34 |
0.046 |
> 1 |
51 |
12 |
15 |
24 |
|
Thymus histology |
|||||
Non-thymoma |
108 |
35 |
39 |
34 |
0.535 |
Thymoma |
64 |
22 |
18 |
24 |
|
MGFA Clinical Classification |
|||||
I + I I + III |
146 |
56 |
51 |
39 |
< 0.001 |
IV + V |
26 |
1 |
6 |
19 |
|
Myasthenic crisis |
|||||
With |
157 |
57 |
55 |
45 |
< 0.001 |
Without |
15 |
0 |
2 |
13 |
Abbreviations: NLR, neutrophil-to-lymphocyte ratio; BMI, body mass index; WBC, white blood cells; RBC, red blood cells. Tbil, total bilirubin; Dbil, direct bilirubin; Ibil, indirect bilirubin; BUN, blood urine nitrogen; UA, uric acid; TC, total cholesterol. HDL-C, high density lipoprotein-cholesterol; LDL-C, low density lipoprotein-cholesterol.
The association of NLR with MG activity
As shown in Figure 1A, patients with higher disease activity had a higher NLR levels than those with lower disease activity. Furthermore, the levels of NLR in patients with myasthenic crisis (MC) were significantly higher in contrasted to those without MC (Figure 1B).
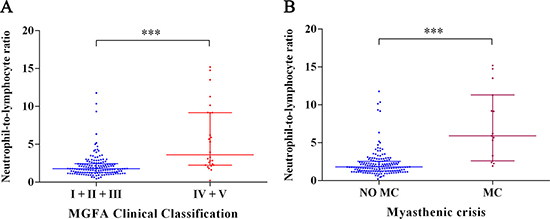
Figure 1: Correlation between NLR and other clinical factors in MG patients. (A)Relationship between NLR and two subgroups according to the MGFA Clinical Classification (***P < 0.001). (B) Relationship between NLR and MC (***P < 0.001). Bar represents median and interquartile range.
For the purpose of clinical application, we categorized the study population according to the two cut-off values of NLR (Figure 2). In patients with a high NLR level (> 2.33), 32.76% suffered from higher disease activity. However, in patients with a moderate NLR level (1.58–2.33), 10.53% suffered from higher disease activity. In cases of patients with a low NLR level (< 1.58), only 1.75% presented with higher disease activity. Moreover, 22.41% patients with a high NLR (> 2.33) were subjected to MC while only 3.51% patients were caused to undergo MC in patients with a moderate NLR level (1.58–2.33), and none was suffered from MC in patients with a low NLR level (P < 0.001).
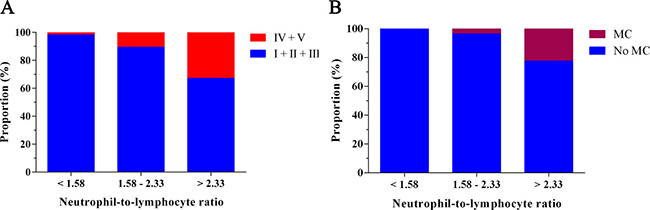
Figure 2: Clinical course of patients according to NLR. (A) The disease activity of MG according to NLR. (B) The incidence of myasthenic crisis according to NLR.
The performance of NLR levels in evaluating the disease activity with ROC analysis was cut of 2.22, 80.8% sensitivity, 68.5 % specificity, and AUC at 0.816 (95% CI: 0.722–0.910, P < 0.001) (Figure 3).
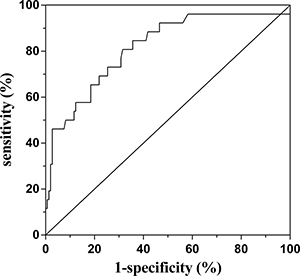
Figure 3: Receiver operating characteristic (ROC) curve analysis of the predictive power of the NLR for higher disease activity of MG. The area under ROC curve: 0.816; 95% CI: 0.722–0.910; P < 0.001.
Elevated NLR level is related to higher disease activity
As shown in Figure 2A, the incidences of higher disease activity of MG from T1 to T3 were 1.75%, 10.53% and 32.76%, respectively. Univariate and multivariate logistic regression analysis were performed to gain a deeper understanding of the relationship between NLR levels and the prevalence of higher disease activity. Based on univariate analysis, WBC (P = 0.002), Tbil (P = 0.047), albumin (P < 0.001), BUN (P = 0.026), creatinine (P = 0.003), UA (P < 0.001), duration of disease (P = 0.005) and NLR (P < 0.001) were all found to be significantly correlated with higher disease activity (Table 3). In model 1, differing from the subjects in T1, the odds ratio (OR) of the subjects in T3 was 27.282 (95% CI 3.505–212.350, P = 0.002). Adjustment for duration of disease (model 2) substantially attenuated the magnitude of the OR for higher disease activity by approximately 23.6-folds when comparing the third with the first quartile of NLR levels. Even when adjusted for WBC, Tbil, albumin, BUN, creatinine, UA, and duration of disease (Model 3), the relationship between NLR and MG activity remained significant in T3 with OR of 13.201 (95% CI: 1.418–122.938, P = 0.023) (Table 4). These results suggest that the subjects with higher NLR levels are more likely to develop higher disease activity of MG than individuals with lower NLR levels.
Table 3: Univariate logistic regression analyses of factors for severe disease activity of MG
Variables |
Univariate logistic regression |
||
|---|---|---|---|
OR |
95% CI |
P value |
|
Age |
1.018 |
0.993–1.043 |
0.160 |
Gender |
0.717 |
0.300–1.716 |
0.455 |
BMI |
0.972 |
0.848–1.113 |
0.676 |
Smoking |
0.602 |
0.168–2.156 |
0.436 |
Hypertension |
1.160 |
0.428–3.143 |
0.770 |
Diabetes mellitus |
1.477 |
0.452–4.831 |
0.519 |
Cardiopulmonary disease |
2.590 |
0.624–10.744 |
0.190 |
WBC |
1.208 |
1.072–1.362 |
0.002 |
RBC |
0.459 |
0.190–1.107 |
0.083 |
Hemoglobin |
0.974 |
0.948–1.001 |
0.062 |
Platelet |
0.998 |
0.991–1.005 |
0.598 |
Tbil |
0.889 |
0.791–0.998 |
0.047 |
Dbil |
0.735 |
0.535–1.008 |
0.056 |
Ibil |
0.860 |
0.732–1.009 |
0.064 |
Total protein |
1.016 |
0.948–1.088 |
0.660 |
Albumine |
0.825 |
0.741–0.918 |
< 0.001 |
BUN |
1.308 |
1.033–1.656 |
0.026 |
Creatinine |
0.938 |
0.900–0.978 |
0.003 |
UA |
0.988 |
0.983–0.994 |
< 0.001 |
TC |
1.096 |
0.797–1.507 |
0.573 |
Triglyceride |
0.983 |
0.537–1.798 |
0.956 |
HDL-C |
0.416 |
0.110–1.571 |
0.196 |
LDL-C |
1.140 |
0.766–1.697 |
0.519 |
Age of onset |
0.847 |
0.360–1.992 |
0.703 |
Duration of disease |
3.437 |
1.459–8.094 |
0.005 |
Thymus histology |
1.287 |
0.551–3.005 |
0.560 |
NLR |
1.525 |
1.273–1.827 |
< 0.001 |
Abbreviations: BMI, body mass index; WBC, white blood cells; RBC, red blood cells; Tbil, total bilirubin; Dbil, direct bilirubin; Ibil, indirect bilirubin; TC, total cholesterol; BUN, blood urine nitrogen; UA, uric acid; HDL-C, high density lipoprotein-cholesterol; LDL-C, low density lipoprotein-cholesterol; NLR, neutrophil-to-lymphocyte ratio.
Table 4: Adjusted Odds Ratio (95% Confidence Interval) for severe disease activity of MG
Variable |
OR |
95% CI |
P value |
|---|---|---|---|
Model 1 |
|||
T1 |
1.000 |
1.000–1.000 |
|
T2 |
6.588 |
0.767–56.600 |
0.086 |
T3 |
27.282 |
3.505–212.350 |
0.002 |
Model 2 |
|||
T1 |
1.000 |
1.000–1.000 |
|
T2 |
6.329 |
0.731–54.790 |
0.094 |
T3 |
23.556 |
2.998–185.083 |
0.003 |
Model 3 |
|||
T1 |
1.000 |
1.000–1.000 |
|
T2 |
7.876 |
0.871–71.247 |
0.066 |
T3 |
13.201 |
1.418–122.938 |
0.023 |
Model 1 is univariate analysis. Model 2 is adjusted for duration of disease. Model 3 is adjusted for duration of disease, white blood cells, total bilirubin, albumin, blood urine nitrogen, creatinine, uric acid.
DISCUSSION
In this study, we aimed to evaluate the association between NLR and disease activity of MG according to MGFA clinical classification. Our study showed that NLR levels were higher in patients with MG compared to those in healthy controls. Moreover, an elevated NLR was assessed to be a parameter in indicating the disease activity of MG.
To our knowledge, MG is a severe autoimmune disease characterized by loss of AChR on the postsynaptic membrane of neuromuscular junction and resulted in disordered neuromuscular transmission and muscle weakness [1]. Recently, accumulating evidences have shown that chronic inflammation response could be heavily involved in the pathogenesis of MG [6, 17, 18]. Gradolatto et al. [19] reported that chronic inflammation in the thymus of MG patients led to impaired T cell function. An evaluation index of the level of inflammatory status may help to predict which subgroup of MG patients would have a more severe disease activity.
The NLR, which represents the balance between neutrophil and lymphocyte level, has recently been proposed to be an inflammatory condition indicator of patients with various chronic inflammatory diseases [11, 20]. NLR can be easily calculated by the ratio of neutrophils to lymphocytes from routine peripheral blood test. Calculation of NLR is a pretty accessible method compared with other inflammatory cytokines, including IL-6, IL-1β, and TNF-α [21]. NLR represents a combination of these two markers, and it is superior to other leukocyte parameters (e.g., neutrophil, lymphocyte, and total leukocyte counts) because of its stability compared with other parameters which may be affected by various physiological, pathological or physical factors [22, 23]. Furthermore, Demirci et al. have shown that there is a higher NLR level in patients with multiple sclerosis (MS) than that in the healthy controls [16]. Also, Mercan et al. reported that the NLR was significantly ascended in rheumatoid arthritis patients contrast to the controls [24]. We observed significantly increased NLR in MG patients than that in healthy controls. It appears that the NLR trend to be elevated in autoimmunological diseases. A high level of NLR has been found to be correlated with the activity and poor prognosis of several diseases, including inflammatory bowel disease [14], intrahepatic cholangiocarcinoma [11] and diabetes mellitus [25]. As there is no ideal single serum inflammatory marker for predicting disease activity of MG, we stratified MG patients into three subgroups according to NLR value to explore whether NLR could be a qualified marker of the activity of MG. We determined that the presence of lifted NLR level was associated with higher disease activity via logistic regression analysis. This result suggests that the activity of MG is relevant to the degree of inflammation.
Although the detailed mechanisms behind the associations of NLR with MG remain not fully resolved, several potential mechanisms of pathogeneses have been suggested. The study has some limitations including cross-sectional design and a relatively small sample size. Our study was not designed to elucidate the mechanistic pathways which lead to higher NLR in patients with MG.
In conclusion, according to our knowledge, this is the first study which investigates the relationship between NLR, which is a newly-developing inflammatory marker, and MG and its activity. Further studies are needed to externally cross-validate our findings in a larger cohort of MG patients. Meanwhile, more laboratory experiments need to be carried out to explore the role of NLR in the pathogenesis of MG.
MATERIALS AND METHODS
Study population
Included in the study were 172 patients who received a certain diagnosis of MG from the neurology hospitalized ward of the First Affiliated Hospital of Wenzhou Medical University and 207 age- and sex-matched healthy controls (HC) between February 2009 and March 2016 (Figure 4). Patients’ age, gender, smoking, age of onset, disease duration, thymus histology, and other medical history were all recorded for each subject. Patients with severe liver or kidney diseases, severe infectious diseases or cancer were excluded from the study. The research protocol of the study was approved by the Ethics Committee of the First Affiliated Hospital of Wenzhou Medical University.
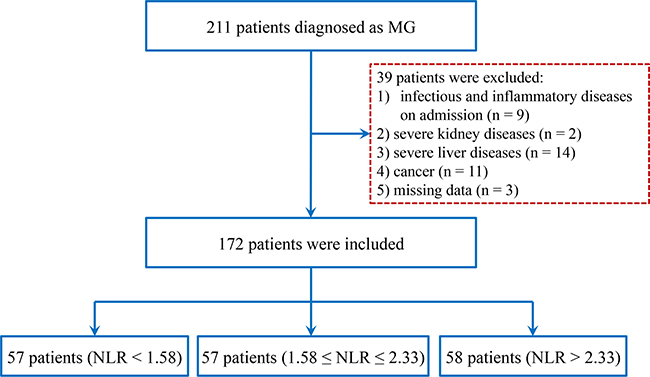
Figure 4: Study flow diagram.
Diagnostic criteria
The diagnosis of MG was based on standard clinical criteria of characteristic weakness, fatigue, electrophysiology, neostigmine test and/or the presence of autoantibody against skeletal muscle acetylcholine receptors (AChRs) [26]. The activity of the disease (Table 5) was evaluated according to the Myasthenia Gravis Foundation of America (MGFA) Clinical Classification at admission [27]. Based on the classification, patients were divided into two subgroups: mild disease activity (I, II and III) and severe disease activity (IV and V).
Table 5: MGFA clinical classification
Class I |
Any ocular muscle weakness |
May have weakness of eye closure |
|
All other muscle strength is normal |
|
Class II |
Mild weakness affecting other than ocular muscles |
May also have ocular muscle weakness of any severity |
|
IIa |
Predominantly affecting limb, axial muscles, or both |
May also have lesser involvement of oropharyngeal muscles |
|
IIb |
Predominantly affecting oropharyngeal, respiratory muscles, or both |
May also have lesser or equal involvement of limb, axial muscles, or both |
|
Class III |
Moderate weakness affecting other than ocular muscles |
May also have ocular muscle weakness of any severity |
|
IIIa |
Predominantly affecting limb, axial muscles, or both |
May also have lesser involvement of oropharyngeal muscles |
|
IIIb |
Predominantly affecting oropharyngeal, respiratory muscles, or both |
May also have lesser or equal involvement of limb, axial muscles, or both |
|
Class IV |
Severe weakness affecting other than ocular muscles |
May also have ocular muscle weakness of any severity |
|
IVa |
Predominantly affecting limb and/or axial muscles |
May also have lesser involvement of oropharyngeal muscles |
|
IVb |
Predominantly affecting oropharyngeal, respiratory muscles, or both |
May also have lesser or equal involvement of limb, axial muscles, or both |
|
Class V |
Defined by intubation, with or without mechanical ventilation, except when employed during routine postoperative management. The use of a feeding tube without intubation places the patient in class IVb. |
Clinical and laboratory measurements
Various variables were simultaneously obtained from the patients’ medical records, including patient demographics, laboratory and clinical tests. Blood samples were drawn by venipuncture in the morning after an overnight fast for at least 8 hours at admission. Laboratory information include WBC, red blood cells (RBC), hemoglobin, platelet, total bilirubin (Tbil), direct bilirubin (Dbil), indirect bilirubin (Ibil), albumin, blood urine nitrogen (BUN), uric acid (UA), total cholesterol (TC), triglyceride, high density lipoprotein-cholesterol (HDL-C) and low density lipoprotein-cholesterol (LDL-C). The NLR was calculated using neutrophil and lymphocyte counts. Thymus histology was presented by means of magnetic resonance imaging (MRI) or computed tomography (CT).
Statistical analysis
In order to derive a deeper understanding of the relationship between NLR and MG activity, all subjects were classified into three groups according to the NLR level. NLR data were stratified as follows: T1: < 1.58, T2: 1.58–2.33, T3: > 2.33. All statistical analyses were performed via the statistical software Statistical Program for Social Sciences version 20.0 (SPSS Inc., Chicago, IL, USA). For continuous variables, results were expressed as mean ± standard deviation (SD), and the differences among groups were compared through one-way analysis of variance (ANOVA) or Kruskal–Wallis test. Additionally, categorical variables were presented as counts or percentages, and intergroup comparisons were analyzed through Chi-squared test. The NLR stratified according to disease activity was compared using Mann–Whitney U test or Kruskal–Wallis test. For the purpose of assessing the predictive performance of the NLR with respect to disease activity, the receiver operating characteristics (ROC) curves were plotted. For the sake of explaining the contribution of the variance in MG activity, multivariable models were constructed for multivariate analysis, including duration of disease, WBC, Tbil, albumin, BUN, creatinine and UA. Statistical significance was set at P < 0.05.
CONFLICTS OF INTEREST
The authors report no declarations of interest.
GRANT SUPPORT
The present study was supported by the Natural Science Foundation of Zhejiang Province (LY13H090010) and Wenzhou Municipal Sci-Tech Bureau Program (Y20140278).
REFERENCES
1. Luo J, Lindstrom J. AChR-specific immunosuppressive therapy of myasthenia gravis. Biochem Pharmacol. 2015; 97:609–619.
2. Maselli RA, Richman DP, Wollmann RL. Inflammation at the neuromuscular junction in myasthenia gravis. Neurology. 1991; 41:1497–1504.
3. Weiss JM, Robinet M, Aricha R, Cufi P, Villeret B, Lantner F, Shachar I, Fuchs S, Souroujon MC, Berrih-Aknin S, Le Panse R. Novel CXCL13 transgenic mouse: inflammation drives pathogenic effect of CXCL13 in experimental myasthenia gravis. Oncotarget. 2016; 7:7550–62. https://doi.org/10.18632/oncotarget.6885.
4. Peters A, Pitcher LA, Sullivan JM, Mitsdoerffer M, Acton SE, Franz B, Wucherpfennig K, Turley S, Carroll MC, Sobel RA, Bettelli E, Kuchroo VK. Th17 cells induce ectopic lymphoid follicles in central nervous system tissue inflammation. Immunity. 2011; 35:986–996.
5. Aricha R, Mizrachi K, Fuchs S, Souroujon MC. Blocking of IL-6 suppresses experimental autoimmune myasthenia gravis. J Autoimmun. 2011; 36:135–141.
6. Uzawa A, Kanai T, Kawaguchi N, Oda F, Himuro K, Kuwabara S. Changes in inflammatory cytokine networks in myasthenia gravis. Sci Rep. 2016; 6:25886.
7. Liu X, Shen Y, Wang H, Ge Q, Fei A, Pan S. Prognostic Significance of Neutrophil-to-Lymphocyte Ratio in Patients with Sepsis: A Prospective Observational Study. Mediators Inflamm. 2016; 2016:8191254.
8. Chung JH, Lim J, Jeong JH, Kim KR, Park CW, Lee SH. The significance of neutrophil to lymphocyte ratio and platelet to lymphocyte ratio in vestibular neuritis. Laryngoscope. 2015; 125:E257–261.
9. Kim DS, Shin D, Lee MS, Kim HJ, Kim DY, Kim SM, Lee MG. Assessments of neutrophil to lymphocyte ratio and platelet to lymphocyte ratio in Korean patients with psoriasis vulgaris and psoriatic arthritis. J Dermatol. 2016; 43:305–310.
10. Solak Y, Yilmaz MI, Sonmez A, Saglam M, Cakir E, Unal HU, Gok M, Caglar K, Oguz Y, Yenicesu M, Karaman M, Ay SA, Gaipov A, et al. Neutrophil to lymphocyte ratio independently predicts cardiovascular events in patients with chronic kidney disease. Clin Exp Nephrol. 2013; 17:532–540.
11. Lin G, Liu Y, Li S, Mao Y, Wang J, Shuang Z, Chen J, Li S. Elevated neutrophil-to-lymphocyte ratio is an independent poor prognostic factor in patients with intrahepatic cholangiocarcinoma. Oncotarget. 2016; 7:50963–71. https://doi.org/10.18632/oncotarget.7680.
12. Feng Z, Wen H, Bi R, Ju X, Chen X, Yang W, Wu X. Preoperative Neutrophil-to-Lymphocyte Ratio as a Predictive and Prognostic Factor for High-Grade Serous Ovarian Cancer. PLoS One. 2016; 11:e0156101.
13. Kawahara T, Furuya K, Nakamura M, Sakamaki K, Osaka K, Ito H, Ito Y, Izumi K, Ohtake S, Miyoshi Y, Makiyama K, Nakaigawa N, Yamanaka T, et al. Neutrophil-to-lymphocyte ratio is a prognostic marker in bladder cancer patients after radical cystectomy. BMC Cancer. 2016; 16:185.
14. Acarturk G, Acay A, Demir K, Ulu MS, Ahsen A, Yuksel S. Neutrophil-to-lymphocyte ratio in inflammatory bowel disease - as a new predictor of disease severity. Bratisl Lek Listy. 2015; 116:213–217.
15. Alan S, Tuna S, Turkoglu EB. The relation of neutrophil-to-lymphocyte ratio, platelet-to-lymphocyte ratio, and mean platelet volume with the presence and severity of Behcet's syndrome. Kaohsiung J Med Sci. 2015; 31:626–631.
16. Demirci S, Demirci S, Kutluhan S, Koyuncuoglu HR, Yurekli VA. The clinical significance of the neutrophil-to-lymphocyte ratio in multiple sclerosis. Int J Neurosci. 2016; 126:700–706.
17. Truffault F, de Montpreville V, Eymard B, Sharshar T, Le Panse R, Berrih-Aknin S. Thymic Germinal Centers and Corticosteroids in Myasthenia Gravis: an Immunopathological Study in 1035 Cases and a Critical Review. Clin Rev Allergy Immunol. 2016.
18. Cavalcante P, Cufi P, Mantegazza R, Berrih-Aknin S, Bernasconi P, Le Panse R. Etiology of myasthenia gravis: innate immunity signature in pathological thymus. Autoimmun Rev. 2013; 12:863–874.
19. Gradolatto A, Nazzal D, Truffault F, Bismuth J, Fadel E, Foti M, Berrih-Aknin S. Both Treg cells and Tconv cells are defective in the Myasthenia gravis thymus: roles of IL-17 and TNF-alpha. J Autoimmun. 2014; 52:53–63.
20. Chen J, Chen MH, Li S, Guo YL, Zhu CG, Xu RX, Zhang Y, Sun J, Qing P, Liu G, Li JJ. Usefulness of the neutrophil-to-lymphocyte ratio in predicting the severity of coronary artery disease: a Gensini score assessment. J Atheroscler Thromb. 2014; 21:1271–1282.
21. Friedman GD, Tekawa I, Grimm RH, Manolio T, Shannon SG, Sidney S. The leucocyte count: correlates and relationship to coronary risk factors: the CARDIA study. Int J Epidemiol. 1990; 19:889–893.
22. Gibson PH, Croal BL, Cuthbertson BH, Small GR, Ifezulike AI, Gibson G, Jeffrey RR, Buchan KG, El-Shafei H, Hillis GS. Preoperative neutrophil-lymphocyte ratio and outcome from coronary artery bypass grafting. Am Heart J. 2007; 154:995–1002.
23. Nunez J, Nunez E, Bodi V, Sanchis J, Minana G, Mainar L, Santas E, Merlos P, Rumiz E, Darmofal H, Heatta AM, Llacer A. Usefulness of the neutrophil to lymphocyte ratio in predicting long-term mortality in ST segment elevation myocardial infarction. Am J Cardiol. 2008; 101:747–752.
24. Mercan R, Bitik B, Tufan A, Bozbulut UB, Atas N, Ozturk MA, Haznedaroglu S, Goker B. The Association Between Neutrophil/Lymphocyte Ratio and Disease Activity in Rheumatoid Arthritis and Ankylosing Spondylitis. J Clin Lab Anal. 2016; 30:597–601.
25. Ulu SM, Dogan M, Ahsen A, Altug A, Demir K, Acarturk G, Inan S. Neutrophil-to-lymphocyte ratio as a quick and reliable predictive marker to diagnose the severity of diabetic retinopathy. Diabetes Technol Ther. 2013; 15:942–947.
26. Drachman DB. Myasthenia gravis. N Engl J Med. 1994; 330:1797–1810.
27. Jaretzki A 3rd, Barohn RJ, Ernstoff RM, Kaminski HJ, Keesey JC, Penn AS, Sanders DB, and Task Force of the Medical Scientific Advisory Board of the Myasthenia Gravis Foundation of America. Myasthenia gravis: recommendations for clinical research standards. Ann Thorac Surg. 2000; 70:327–34.