
INTRODUCTION
Acute myeloid leukemia (AML) is a heterogeneous group of diseases characterized by the infiltration of bone marrow, blood, and other tissues by proliferative, clonal and abnormally differentiated immature cells of the hematopoietic system [1–3].
According to cytogenetic and molecular features, AML patients are classified into favorable, intermediate, or adverse risk groups and their therapy after remission are risk-adapted [2]. Although many favorable and adverse group patients are well characterized by specific chromosomal alterations, the intermediate-risk cytogenetics group (IR-AML) is heterogeneous and includes patients with a widely diverse outcome. In contrast to established treatment protocols for patients in the favorable and adverse risk groups, the clinical decision guideline for the IR-AML group remains unclear [4]. This uncertainty regarding therapy impairs survival of many IR-AML patients. Therefore, there is a need to find new prognostic factors to stratify this group of patients allowing clinicians to choose better treatments and improve their outcome. For that reason, several genetic alterations have been evaluated over the last years in an attempt to improve patient stratification of the IR-AML group. At present, only the molecular markers NPM1, CEBPA and FLT3 have been incorporated into clinical practice [2, 5, 6]. For instance, a combination of mutated NPM1 and non-mutated FLT3/Internal tandem duplication (FLT3/ITD) associates with favorable outcome in IR-AML patients [7–10]. Similarly, biallelic CEBPA mutations predict a relatively favorable outcome in patients without FLT3/ITD [11]. Recently, mutations of RUNX1, ASXL1 and TP53 have been associated with adverse outcome and are also included in the standard diagnosis [4]. Additional molecular factors, such as IDH1, IDH2, TET2, DNMT3A, MLL-PTD or NRAS, have demonstrated capacity to stratify a subset of IR-AML patients, allocating to them into the good or poor prognosis groups [12, 13]; nevertheless, they have not been introduced in clinical practice yet; therefore the need still remains to identify new prognostic indicators with higher stratification capacity.
The Crk-Associated Substrate (CAS) is a family of focal adhesion related proteins that play crucial roles in the regulation of cell growth, adhesion, migration and apoptosis [14]. They are involved in signal transduction downstream of integrin engagement and receptor tyrosine kinases (RTKs), which signal through the FAK, SRC and CAS family proteins. In this context, upregulation of scaffolding proteins such as NEDD9 or BCAR1, and also of the FAK and SRC protein kinases, has shown pro-metastatic capacity in different solid tumors and associates with poor outcome [14, 15]. The role of focal adhesion proteins in hematologic malignancies has been less studied. In this regard, FAK and SRC are prognostic factors that associate with poor outcome in AML [16, 17]. In the present study, we investigated whether NEDD9 and BCAR1 could have prognostic significance and correlate with survival in IR-AML patients. We have found, in two independent patient cohorts, the expression of NEDD9, but not BCAR1, to be an independent prognostic factor in IR-AML patients, that associates with better outcome.
RESULTS
Patient characteristics
The main characteristics of the patients from the two cohorts are shown in Table 1. In summary, the Cohort 1 had 73 patients, while the Cohort 2 had 206 patients. The median ages were 52 and 53 years with a 47% and a 43% of patients younger than 50 years, respectively. Most of the characteristics, including age, gender, NPM1 and FLT3/NPM1 combined mutations did not show significant differences between the two cohorts. However, in Cohort 1, the median of white blood cells (WBC) count, the percentage of patients with the WBC count over 20 × 109/L, FLT3/ITD+ and CEBPA- were significantly higher than in Cohort 2. The percentage of patients in some subgroups of the French-American-British (FAB) classification was also significantly different between cohorts.
Table 1: Patient’s characteristics and comparison between the cohorts of our study
Parameter |
Cohort 1 |
Cohort 2 |
P |
|---|---|---|---|
(n = 73) |
(n = 206) |
||
Age, median (range) |
52 (17–65) |
53 (17–65) |
0.187† |
< 50 years (%) |
34 (47) |
88 (43) |
0.585 |
> 50 years (%) |
39 (53) |
118 (57) |
|
Sex, |
|||
Male (%) |
39 (53) |
109 (53) |
1.000 |
Female (%) |
34 (47) |
97 (47) |
|
WBC, median (range) |
60 (2–325) |
16 (0–324) |
< 0.001‡ |
< 20 × 109/L (%) |
25 (34) |
107 (53) |
0.009 |
> 20 × 109/L (%) |
48 (66) |
97(47) |
|
FAB Classification (%) |
0.045* |
||
M0 |
8 (11) |
16 (8) |
|
M1 |
23 (32) |
47 (23) |
|
M2 |
6 (8) |
41 (20) |
|
M4 |
12 (16) |
37 (18) |
|
M4E |
1 (1) |
1 (1) |
|
M5 |
21 (29) |
46 (22) |
|
M6 |
1 (1) |
6 (3) |
|
M7 |
1 (1) |
0 (0) |
|
Unknown |
0 (0) |
12 (6) |
|
Molecular alterations (%) |
|||
FLT3/ITD− |
39 (53) |
149 (72) |
0.023 |
FLT3/ITD+ |
29 (40) |
56 (27) |
|
Unknown |
5 (7) |
1(1) |
|
NPM1− |
31 (43) |
108 (52) |
0.570 |
NPM1+ |
33 (45) |
97 (47) |
|
Unknown |
9 (12) |
1 (1) |
|
FLT3− + NPM1+(Favorable) |
16(22) |
60(29) |
0.633 |
Others (Unfavorable) |
47(64) |
145(70) |
|
Unknown |
10(14) |
1(1) |
|
CEBPA− |
57(78) |
78(38) |
< 0.001* |
CEBPA+ |
1(1) |
11(5) |
|
Unknown |
15(21) |
117(57) |
Results are presented as the number of patients for each characteristic. The percentage of the patients is indicated in brackets for each condition. For categorical variables, the Fischer exact test or χ2 test (*) were used to analyze the statistical significance; while for continuous variables showing normal or abnormal distribution, the Student’s t-test (†) or the Mann-Whitney U (‡) test were used, respectively. P < 0.05 indicates statistical significance (Bold values). WBC; White blood cells. FAB; French-American-British.
Clinical outcomes such as overall survival (OS) and disease-free survival (DFS) between the two cohorts did not present statistically significant differences (OS, p = 0.610; DFS, p = 0.904) (Data not shown).
The alive patients had a median follow-up of 56 and 58 months in the Cohort 1 and 2, respectively, and the OS at 5 years for the patients of the two groups were 47.0 ± 6.1 % and 48.8 ± 3.7 %, respectively (Supplementary Table 1).
After a median follow-up for patients alive or in complete remission (CR) of 54 months in Cohort 1 and 46 months in Cohort 2, 29% (17/59) and 35% (64/185) of patients in Cohorts 1 and 2 respectively, relapsed (Supplementary Table 1). At 5 years, DFS for patients of two groups were 51.4 ± 6.6 and 44.8 ± 4.1 % and cumulative incidence of relapse (CIR) were 29.6 ± 6.1 and 37.8 ± 3.9 %, respectively. None of the variables analyzed (age, FLT3/ITD duplication and FLT3/NPM1 combined mutations) in Cohort 1 had an impact on DFS or CIR. In contrast, in Cohort 2, patients older than 50 years, with FLT3/ITD mutation or with the unfavorable FLT3/NPM1 combination (FLT3+/NPM1−, FLT3−/NPM1− and FLT3+/NPM1+) showed the worst survival after a CR and a higher incidence of relapse than younger patients, patients without FLT3/ITD or with a favorable FTL3/NPM1 combination (FLT3−/NPM1+) (Supplementary Table 1).
Furthermore, 52% (38/73) and 49% (101/206) of patients in Cohort 1 and 2, respectively, died (Supplementary Table 1).
NEDD9 is an independent prognostic factor for OS and DFS in IR-AML patients
Clinical variables as age, sex, WBC, FLT3/ITD duplication, NPM1 mutation and FLT3/NPM1 combined mutations, as well as BCAR1 and NEDD9 expression were assessed in the univariate analysis. The variables with a p-value higher than 0.25 were not included in the multivariate analysis.
In order to establish the cutoff for BCAR1 and NEDD9 expression, we performed ROC (Receiver Operating Characteristic) curves. However, we could not find any point with enough specificity and sensitivity. Thus, we decided to perform exploratory univariate analyses using the mean, the median or the quartiles as thresholds. In BCAR1 analyses, no statistically significant difference was found with any cutoff. On the contrary, when we used the mean as threshold we found NEDD9 as a good prognostic factor of OS in Cohort 1 (p = 0.003) and DFS in the two cohorts (Cohort 1 p = 0.019 and Cohort 2 p = 0.046). Using the median as threshold, NEDD9 expression was significant in two clinical outcome endpoints (OS p = 0.009 and DFS p = 0.003) in the Cohort 1, in contrast, in the Cohort 2 it was not in any of them. Finally, when we established the third quartile as the cutoff we found the best results in both cohorts, so we decided to perform all the analysis using the third quartile to define overexpression of NEDD9.
In the univariate analysis of Cohort 1 (Tables 2 and 3), Cox regression and Fine and Gray’s tests showed that age over 50 years and NEDD9 overexpression (over the third quartile) were associated with lower and higher OS, respectively (p = 0.031, Hazard Ratio (HR) = 2.071; p = 0.026, HR = 0.343, resp.). Regarding DFS, only NEDD9 expression showed a trend towards significance (p = 0.067) while any variable was significant in the CIR univariate analyses. In Cohort 2 analyses, NEDD9 expression (overexpression), and FLT3/NPM1 combination (unfavorable combinations: FLT3+/NPM1−, FLT3−/NPM1− and FLT3+/NPM1+) had significant differences in OS (p = 0.029, HR = 0.566; p = 0.002, HR = 2.243, resp.), DFS (p = 0.006, HR=0.468; p = 0.002, HR = 2.229, resp.) and CIR (p = 0.040, HR=0.519; p = 0.016, HR = 2.030, resp.) studies. Moreover, age (> 50 years) in OS and DFS (p = 0.008, HR = 1.761; p = 0.038, HR = 1.555, resp.), NPM1 (NPM1+) in OS (p = 0.045, HR = 0.658) and FLT3/ITD duplication (FLT3/ITD+) in DFS and CIR (p = 0.025, HR = 1.636; p = 0.016, HR = 1.720, resp.) were also statistically significant. BCAR1 expression had no differences in any univariate analyses of any cohort.
Table 2: Univariate and multivariate analyses of NEDD9, BCAR1 and clinical variables in OS and DFS
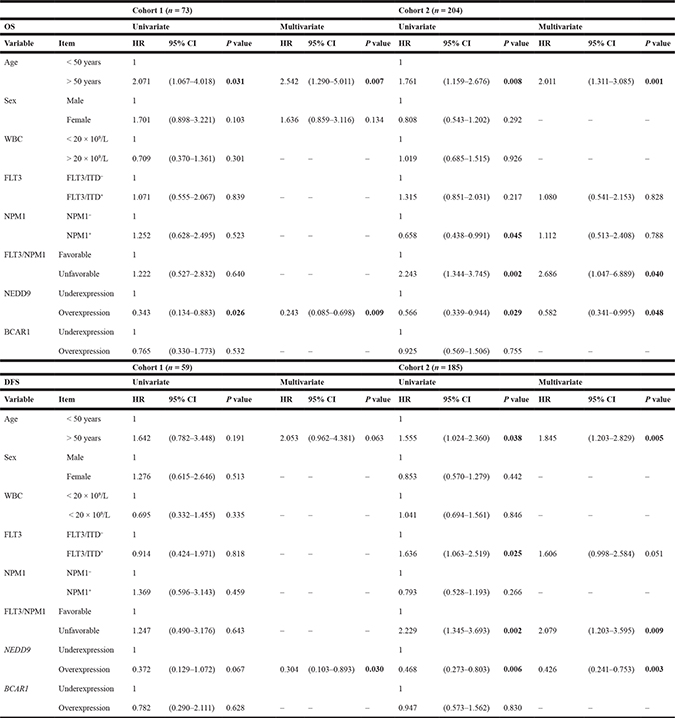
COX test was used to analyze the statistical significance in OS and DFS. P value < 0.05 was considered statistically significant (Bold values). “-“ indicates that variables were not included in the multivariate analyses (P value > 0.250 in the univariate analysis). HR; Hazard ratio. CI; Confidence interval. OS; Overall survival. DFS, Disease-free survival. WBC; White blood cells.
Table 3: Univariate and multivariate analyses of NEDD9, BCAR1 and clinical variables in CIR
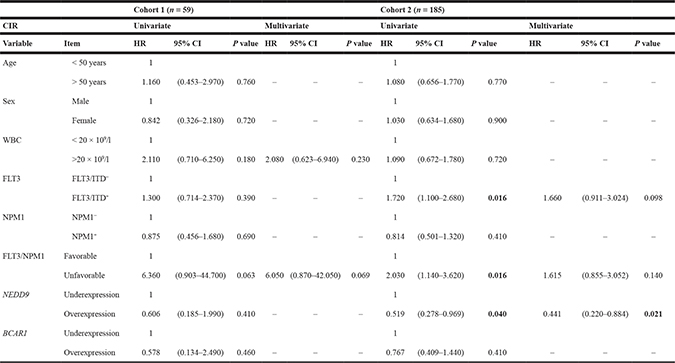
Gray and Fine and Gray tests for CIR were used to analyze the statistical significance. P value < 0.05 was considered statistically significant (Bold values). “–“ indicates that variables were not included in the multivariate analyses (P value > 0.250 in the univariate analysis). HR; Hazard ratio. CI; Confidence interval. CIR; Cumulative incidence of relapse. WBC; White blood cells.
In multivariate analyses for NEDD9 (Tables 2 and 3), all of these variables kept their statistical significance except for NPM1 mutation in OS, FLT3/ITD duplication in DFS and CIR, and FLT3/NPM1 combined mutations in CIR of Cohort 2. Moreover, in Cohort 1 study, although the NEDD9 expression had a p-value of 0.067 in the univariate analysis in DFS (HR = 0.372), it showed significant differences in the multivariate analysis (p = 0.030, HR = 0.304).
In all cases with statistical significance, age over 50 years, FLT3/NPM1 unfavorable combinations and FLT3/ITD duplication had a HR above 1, whereas the HR of NEDD9 overexpression and NPM1 mutation was lower than 1.
Survival curves
Kaplan–Meier analysis showed that patients with overexpression of NEDD9 (over the third quartile) had better prognosis than patients with lower expression of NEDD9 (Figures 1 and 2). Significantly, the Cohort 1 patients with overexpression of NEDD9 had an increase in OS (69.3 ± 11.6 vs 34.2 ± 7.9%, p = 0.020) (Figure 1), which was validated by the Cohort 2 analysis (62.4 ± 7.1 vs 42.1 ± 4.6%, p = 0.027). In addition, in the Cohort 1 patients with NEDD9 overexpression showed a clear trend towards significance in predicting better DFS (70.1 ± 12.6 vs 39.0 ± 8.8%, p = 0.056) (Figure 1). Indeed, this difference reached significance in the Cohort 2 due to its higher number of patients (59.6 ± 8.3 vs 35.6 ± 5.0%, p = 0.005). In a similar way, although the differences between patients that overexpressed and underexpressed NEDD9 in the Cohort 1 were not statistically significant in CIR analyses (22.1 ± 11.8 vs 32.0 ± 7.2%, p = 0.417), the same study in Cohort 2 presented significant differences (CIR: 29.2 ± 8.0 vs 45.0 ± 5.2%, p = 0.036) (Figure 2). No differences were found in the Kaplan–Meier analyses of BCAR1 expression (Supplementary Figure 1).
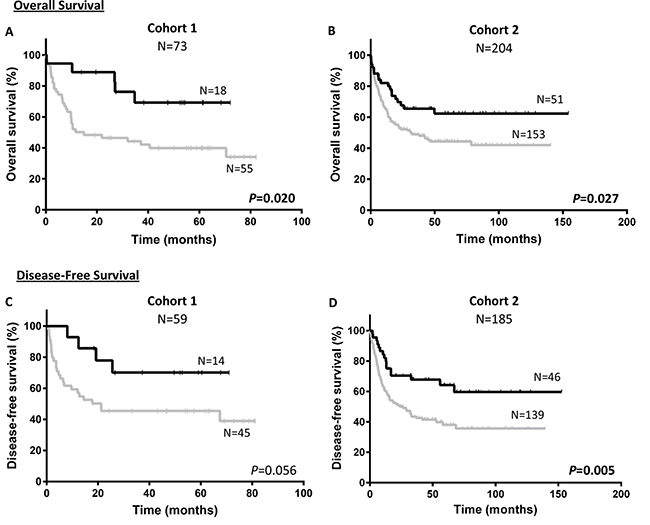
Figure 1: Survival according to NEDD9 expression in cohorts. Kaplan–Meier curves represent OS of cohort 1 (A) and cohort 2 (B), and DFS of cohort 1 (C) and cohort 2 (D) depending on the NEDD9 expression. Black line and gray line indicate NEDD9 overexpressed and underexpressed, respectively. Log-rank test was used to analyze the statistical significance. P < 0.05 was considered statistically significant (Bold values). OS; Overall survival. DFS; Disease-free survival.
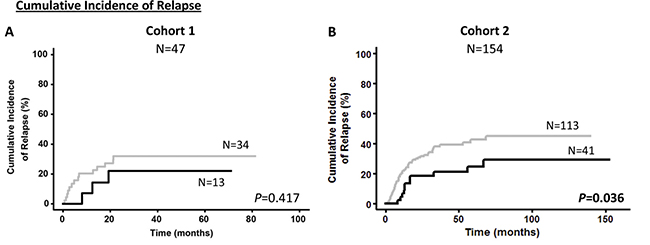
Figure 2: Cumulative incidence of relapse according to NEDD9 expression in cohorts. Kaplan–Meier curves represent CIR of cohort 1 (A) and cohort 2 (B) depending on the NEDD9 expression. Black line and gray line indicate NEDD9 overexpressed and underexpressed, respectively. Gray test for CIR was used to analyze the statistical significance. P < 0.05 was considered statistically significant (Bold values). CIR; Cumulative incidence of relapse.
Association of NEDD9 expression with clinical and molecular characteristics of AML patients
NEDD9 association with several variables such as age, sex, WBC, FAB classification, FLT3/ITD duplication, NPM1 mutation, FLT3/NPM1 combined mutations, disease status (relapsed or no relapsed) and patient status at the end of follow up (alive or death) was evaluated in each cohort. Most of the variables analyzed had no association with the NEDD9 expression (Table 4). Only FAB classification and the patient status at the end of the study (alive or death) showed significant association with NEDD9 expression.
Table 4: Association between NEDD9 expression and clinical data in the cohorts of our study
Parameter |
Cohort 1 |
NEDD9 |
Cohort 2 |
NEDD9 |
||||
|---|---|---|---|---|---|---|---|---|
Total (n = 73) |
Under-expressed |
Over-expressed |
p-value |
Total (n = 204) |
Under-expressed |
Over-expressed |
p-value |
|
Age, |
73 |
55 |
18 |
0.726† |
204 |
153 |
51 |
0.405† |
< 50 years (%) |
34 (47) |
27 |
7 |
0.588 |
87 (43) |
63 |
24 |
0.514 |
> 50 years (%) |
39 (53) |
28 |
11 |
117 (57) |
90 |
27 |
||
Sex, |
||||||||
Male (%) |
39 (53) |
29 |
10 |
1.000 |
108 (53) |
87 |
21 |
0.074 |
Female (%) |
34 (47) |
26 |
8 |
96 (47) |
66 |
30 |
||
WBC, |
73 |
55 |
18 |
0.774‡ |
202 |
151 |
51 |
0.818‡ |
<20 × 109/L (%) |
25 (34) |
18 |
7 |
0.776 |
107 (53) |
82 |
25 |
0.521 |
>20 × 109/L (%) |
48 (66) |
37 |
11 |
95 (47) |
69 |
26 |
||
FAB Classification, (%) |
0.026* |
0.029* |
||||||
M0 |
8 (11) |
7 |
1 |
16 (8) |
14 |
2 |
||
M1 |
23 (32) |
21 |
2 |
46 (22) |
39 |
7 |
||
M2 |
6 (8) |
6 |
0 |
41 (20) |
33 |
8 |
||
M4 |
12 (16) |
8 |
4 |
36 (18) |
28 |
8 |
||
M4E |
1 (1) |
1 |
0 |
1 (1) |
1 |
0 |
||
M5 |
21 (29) |
10 |
11 |
46 (22) |
27 |
19 |
||
M6 |
1 (1) |
1 |
0 |
6 (3) |
5 |
1 |
||
M7 |
1 (1) |
1 |
0 |
0 (0) |
0 |
0 |
||
Protein mutations, (%) |
||||||||
FLT3/ITD− |
39 (53) |
30 |
9 |
1.000 |
149 (73) |
116 |
33 |
0.198 |
FLT3/ITD+ |
29 (40) |
22 |
7 |
54 (27) |
37 |
17 |
||
NPM1− |
31 (43) |
22 |
9 |
0.779 |
108 (53) |
85 |
23 |
0.257 |
NPM1+ |
33 (45) |
25 |
8 |
95 (47) |
68 |
27 |
||
FLT3− + NPM1+ (Fav.) |
16 (22) |
12 |
4 |
1.000 |
60 (30) |
43 |
17 |
0.476 |
Others (Unfav.) |
47 (64) |
35 |
12 |
143 (70) |
110 |
33 |
||
Alive (%) |
35 (48) |
22 |
13 |
0.028 |
105 (51) |
72 |
33 |
0.035 |
Death (%) |
38 (52) |
33 |
5 |
99 (49) |
81 |
18 |
||
No relapse (%) |
42 (71) |
31 |
11 |
0.737 |
129 (67) |
93 |
36 |
0.152 |
Relapse (%) |
17 (29) |
14 |
3 |
63 (33) |
52 |
11 |
Results are presented as the number of patients for each characteristic. The percentage of the patients is indicated in brackets for each condition. For categorical variables, the Fischer exact test or χ2 test (*) were used to analyze the statistical significance; while for continuous variables showing normal or abnormal distribution, the Student’s t-test (†) or the Mann-Whitney U (‡) test were used, respectively. P < 0.05 indicates statistical significance (Bold values). WBC; White blood cells. FAB; French-American-British.
DISCUSSION
A remarkable proportion of patients included in the intermediate-risk cytogenetics group show diverse outcome. In the last decades, an effort has been made to identify novel molecular markers that could improve patient stratification in order to adapt their therapy to their prognosis. Up to now, only the analyses of NPM1, CEBPA and FLT3/ITD mutations have effectively been incorporated into routine prognostic stratification [6]. More recently, the mutations of RUNX1, TP53 and ASXL1 have been also associated with unfavorable outcome [4].
In the present study, we have identified for the first time, in two independent cohorts, that NEDD9 overexpression is a favorable prognostic factor in intermediate-risk AML patients. This was, however, an unexpected finding since NEDD9 confers aggressiveness in most cancer types studied so far [14, 15]. A review of the NEDD9 published literature provided a rationale for our findings by identifying a distinct function for NEDD9 in normal and neoplastic myeloid cells as compared to normal lymphocytes or epithelial cells and their derived malignancies.
NEDD9 is a member of the CAS family of adhesion docking proteins. In adherent cells, NEDD9 regulates several signaling cascades involved in multiple activities including migration, adhesion, cell death or proliferation [18–20]. Because of the involvement of NEDD9 in key cellular functions, it is not surprising that a link has been established between its aberrant expression or activation and the aggressiveness or metastatic capacity of cancer cells [15]. Thus, overexpression of NEDD9 correlated with cell migration, invasion, metastasis development and drug resistance in several types of solid tumors such as glioblastoma, melanoma or breast cancer [19, 21].
However, NEDD9 shows opposite effects regarding migratory capacity on myeloid cells as compared to epithelial or lymphoid cells. Thus, NEDD9 blocks normal myeloid cell migration since NEDD9 deficient neutrophils [22], granulocytes or macrophages display increased migratory activity [23]. In sharp contrast, NEDD9 promotes migration in cultured normal human embryonic kidney cells [24] or fibroblasts [20], an effect occurring also in lymphocytes since NEDD9 deficient B cells show decreased migration as compared their wild type counterparts [22, 25]. The direction of the differences in normal cell migration between cells of the myeloid and lymphoid lineages observed in vitro is maintained in in vivo models. Thus, as compared to NEDD9+/+ mice, NEDD9 −/− mice show an increased number of macrophages, and a simultaneous reduction of B lymphocytes in peripheral blood [26] and secondary lymphoid organs, yielding an almost complete loss of Marginal Zone B (MZB) cells in the spleen [25].
The distinct NEDD9 functions observed in normal cells persist after neoplastic transformation, since NEDD9 overexpression blocks migration and dissemination of neoplastic cells of the myeloid lineage, while stimulating them in solid tumors or lymphoid neoplasias. Thus, NEDD9 inactivation associates with higher in vivo aggressiveness in chronic myeloid leukemia (CML), since NEDD9 deficient p210Bcr/Abl transgenic mice show an increased number of granulocytes in peripheral blood, a hyperplasia of myeloid and megakaryocytic cells in the bone marrow, and a diffuse myeloid infiltration in the spleen, lung and liver, leading to earlier progression and shorter mouse survival, which support NEDD9 capacity to block CML progression [23]. In contrast, NEDD9 mediates dissemination in BCR-ABL-dependent acute lymphoblastic leukemia (ALL) showing splenomegaly by accumulation of and pre-B cell lymphoblasts [21, 27]. Similarly, NEDD9 deficient p210Bcr/Abl mice show a significant decrease in lymphoid cell infiltration in bone marrow and spleen concomitantly with an increase in granulocytes [23]. In the same venue, in adult T-cell leukemia (ATL), the NEDD9 overexpression is induced by the Tax oncoprotein of the HTLV1 virus and enhances lymphocyte motility [28]. Finally, NEDD9 overexpression increases motility and/or induces epithelial-to-mesenchymal transition (EMT) in melanoma, glioblastoma and breast or colorectal carcinoma cells in vitro [29–32]. In addition, NEDD9 overexpression increases metastases and aggressiveness in in vivo models of these solid tumors [15, 19, 21, 33].
Based on the reports described above, the favorable prognosis we have observed for NEDD9 overexpression in IR-AML patients is consistent with the notion that overexpression of NEDD9 in AML cells may block their migratory and dissemination capacities, in contrast to the stimulation of in vitro migration or in vivo dissemination reported for cells on lymphoid or solid malignancies.
There are some limitations in our study. One of them is the lack of the CEBPA mutation analysis in the clinical data that lead to their exclusion in the univariate and multivariate analyses. However, CEBPA mutations are rather infrequent and because of that, they are unlikely to have an impact on the observed associations, despite an unequal distribution among high and low NEDD9 expression groups. Another limitation is that the prognostic value of NEDD9 cannot be extrapolated to patients older than 65 because they have not been included in this study. In addition, since minimal residual disease (MRD) status has been pointed out in recent studies as a strong prognostic factor for relapse and DFS in AML, it would be interesting to analyze the correlation between NEDD9 expression and MRD status in the future. Unfortunately, the lack of MRD data for most of the studied patient cohort precluded this analysis. Nevertheless, our study is robust since NEDD9 has been validated as a prognostic factor in two independent cohorts and has also been confirmed in the multivariate analyses.
In summary, our study identifies NEDD9 overexpression as a good prognostic factor in IR-AML patients, because of its association with lower CIR, as well as with improved OS and DFS. If NEDD9 overexpression is validated in future studies as an independent marker for a favorable outcome, it could be used for the development of risk-adapted post-remission chemotherapy protocols, to treat candidates with high probability of response among patients, included within the highly heterogeneous IR-AML subgroup. Finally, and because of the specificity of NEDD9 regulation and function in myeloid cells, it would be interesting to determine if the prognostic capacity we observed in AML patients for NEDD9 overexpression could be extended to other myeloid lineage malignancies.
MATERIALS AND METHODS
Patients
Patients included in this study were adults up to the age of 65 years with de novo IR-AML, according to the Medical Research Council (MRC) classification [34, 35]. All the samples were collected at diagnosis after obtaining written informed consent in accordance with the Declaration of Helsinki and the Ethics Committee approval of each participating institution. A cohort of 73 patients (Cohort 1) from Hospital de la Santa Creu i Sant Pau (Barcelona, Spain) was our initial group, whereas another cohort of 206 patients from two other hospitals (Cohort 2), Hospital La Fe (Valencia, Spain) and Hospital Universitario de Salamanca (Salamanca, Spain), was included as a validation group in this study. All the patients were selected based on availability of bone marrow specimens, between the start and the end periods for each hospital trial. Clinical outcomes between the selected and non-selected patients of each cohort were similar and did not present significant differences (Data not shown). Patients older than 65 years or with an acute promyelocytic leukemia at diagnosis (M3 in FAB classification) were excluded from the study. The main characteristics of the groups are shown in Table 1.
Cohort 1 and Cohort 2 patients were treated according the CETLAM-03 (Grupo Cooperativo para el Estudio y Tratamiento de las Leucemias agudas y Mielodisplasias) and the PETHEMA trials LMA99, LMA2007 and LMA2010 (Programa de Estudio y Tratamiento de las Hemopatías Malignas, http://www.fundacionpethema.es/) protocols, respectively.
Concerning the CETLAM-03 protocol, treatment was administered between 2003 and 2012 at 21 collaborating institutions. In brief, induction chemotherapy included one or two courses of idarubicin 12 mg/m2 intravenously (IV) days 1, 3, 5, cytarabine 500 mg/m2/12 h over 2 h IV infusion days 1, 3, 5, and etoposide 100 mg/m2 IV days 1, 2, 3. In addition, patients also received G-CSF priming 150 mg/m2 subcutaneously (SC) from day 0 to the last day of induction and consolidation chemotherapy. This was followed by one consolidation with mitoxantrone 12 mg/m2 IV from day 4 to 6, and cytarabine 500 mg/m2/12 h IV from day 1 to 6. Subsequently, the patients went on chemotherapy courses with high-dose cytarabine as in the Cancer and Leukemia Group B trial [36]. Particularly, patients in intermediate risk group, with normal karyotype, a single course of induction chemotherapy to achieve the complete remission (CR), the absence of adverse molecular features (FLT3-ITD or MLL-PTD) and low minimal residual disease (MRD) levels after consolidation (MRD < 0,1%) receive an autologous peripheral blood stem cells (PBSC) transplant, regardless of having an HLA-identical sibling. The PETHEMA protocols are detailed in http://www.fundacionpethema.es/. Eligible patients were treated with intensive chemotherapy in which induction consisted of a combination of anthracycline plus cytarabine with or without etoposide. On achievement of complete remission (CR) patients proceeded to consolidation therapy and eligible cases were selected for autologous or allogeneic stem cell transplantation.
Time-dependent clinical outcome endpoints
Overall survival (OS), disease-free survival (DFS) and cumulative incidence of relapse (CIR) were assessed in the statistical analysis. OS was calculated from the time of patient diagnosis to death or last date of follow-up (dead vs alive patients) and DFS from the complete remission date to relapse/death or last date of follow-up (dead or relapsed vs alive patients). Finally, CIR was calculated from the complete remission date to relapse or last date of follow-up or death (competing risk analysis: relapsed vs alive non-relapsed vs dead non-relapsed patients).
RNA extraction and gene expression analyses
Samples were obtained from bone marrow aspirates of IR-AML patients at diagnosis. Mononuclear cells were isolated by Ficoll-Hypaque gradient and total RNA was extracted using TRIzol reagent (Thermo Fisher Scientific, Waltham, MA, USA) following the manufacturer’s protocol. cDNA was generated after reverse transcription of 1.5 μg total RNA using the High Capacity cDNA Reverse Transcription Kit (Applied Biosystems (AB), Foster City, CA, USA). NEDD9 and BCAR1 expression (Hs00610590_m1 and Hs00183953_m1, resp. AB) was determined by real-time PCR using the platform ABI 7900HT Fast Real-Time PCR System (AB). Each sample was assessed by triplicate using the TaqMan Gene Expression Assay (AB). The comparative cycle threshold (DCt) method was used to determine relative expression levels [37], expressed as a ratio between target gene and control gene. ABL was used as the endogenous control gene (probe: ENP1043, primers: P3035: TGGAGATAACACTCTAAGCATAACTAAAGGT, P3036: GATGTAGTTGCTTGGGACCCA; AB) using VIC fluorophore. Quantitative methods analyses were detailed in previous reports also using ABL as control gene [38].
Statistical analysis
Statistical analyses were performed in the IBM SPSS Statistics (Release 22.0.0.0, New York, NY, USA). The differences between clinical data of the two cohorts and the association between the NEDD9 expression and clinical data were analyzed using the Fischer exact test or χ2 test. Differences between continuous variables were analyzed with the Student’s t-test or the Mann-Whitney U test in those showing normal or abnormal distribution, respectively. Exploratory univariate analyses were performed to choose the threshold value to dichotomize the NEDD9 and BCAR1 mRNA levels in over and underexpression. After analyzing the mean, the median and different percentiles the best results were obtained with the third quartile (75th percentile) that is the cutoff selected to perform this study. Independent variables analyzed included age, gender, white blood cell count (WBC) at diagnosis, FAB category, and molecular alterations (FLT3/ITD, NPM1, and CEBPA). Time-dependent endpoints such as OS, DFS and CIR were assessed, and the endpoint for the threshold was death and relapse. Time-dependent outcomes were calculated using Kaplan–Meier curves (OS or DFS), and the log-rank test was used for comparisons [39]. The regression model used in univariate and multivariate analyses was COX test (OS and DFS). The free statistical package R Studio (Version 0.98-1102, 2009–2014, RStudio Inc., Boston, MA, USA) through the R version 3.1.2 (2014-10-31, The R Foundation for Statistical Computing) [40] was used for the competing risk analysis. CIR was analyzed by Gray [41] and Fine and Gray’s tests [42], using R Studio and the cuminc and crr functions through the cmprsk package. After exploratory univariate comparisons, multivariate analyses were performed including variables with a p-value below 0.25 and the INTRO method was used in SPSS to analyze Cox regression. Hazard ratios (HR) with relative 95% confidence interval (CI) are shown in both univariate and multivariate analyses. Any differences were considered to be statistically significant when the p-value was < 0.05.
Abbreviations
ABL: Abelson murine leukemia viral oncogene homolog 1; ALL: Acute Lymphoblastic Leukemia; AML: Acute Myeloid Leukemia; ATL: Adult T-cell Leukemia; BCAR1: Breast Cancer Anti-Estrogen Resistance 1; BCR: Breakpoint Cluster Region; CAS: Crk-Associated Substrate; CEBPA: CCAAT/enhancer-binding protein alpha; CETLAM: Grupo Cooperativo para el Estudio y Tratamiento de las Leucemias agudas y Mielodisplasias; CI: Confidence Interval; CIR: Cumulative Incidence of Relapse; CML: Chronic Myeloid Leukemia; CR: Complete Remission; CRK: Adaptor molecule Crk or p38; DFS: Disease-free survival; EMT: Epithelial-to-Mesenchymal Transition; FAB: French-American-British; FAK: Focal Adhesion Kinase; FLT3: Fms-related tyrosine kinase 3; FLT3/ITD: Fms-related tyrosine kinase 3/ Internal Tandem Duplication; HR: Hazard Ratio; HTLV1: Human T-cell Lymphotropic Virus type 1; IR-AML: Intermediate risk - Acute Myeloid Leukemia; IV: Intravenously; MLL: Mixed Lineage Leukemia; MRC: Medical Research Council; MRD: Minimal Residual Disease; MZB: Marginal Zone B; NEDD9: Neural precursor cell Expressed Developmentally Down-regulated protein 9; NPM1: Nucleophosmin 1; OS: Overall Survival; PBSC: Peripheral Blood Stem Cells; PETHEMA: Programa de Estudio y Tratamiento de las Hemopatías Malignas; Resp: Respectively; ROC: Receiver Operating Characteristic; RTK: Receptor Tyrosine Kinases; SC Subcutaneously; SRC: Proto-oncogene tyrosine-protein kinase Src; WBC: White Blood Cells.
Author contributions
V.P. designed and performed research and wrote the manuscript; S.B., E.B., M.C.C., analyzed the clinical data; M.H, M.LL., and M.I.P. collected and perform the analysis of the samples; M.V.C. performed statistical analysis; JF.N., M.G.D., M.A.S. and J.S. analyzed and interpreted data; and I.C. and R.M. contributed equally to design the research, supervised the experiments and wrote the paper.
CONFLICTS OF INTEREST
The authors declare that they have no conflicts of interests.
FUNDING
This work was supported by Instituto de Salud Carlos III (Co-funding from FEDER) [CD13/00074 to V.P., PI15/00378 to R.M., FIS PI11/00872, RD12/0036/0071 and FIS PI14/00450 to J.S., PIE15/00028 to R.M. and J.S., RD12/0036/0069 to M.G.D., ISCIII-PS13/1640 and RD12/0036/0014 to M.A.S.]; CIBER-BBN [CBV6/01/1031 and Nanomets3 to R.M.]; Generalitat de Catalunya [PERIS SLT002/16/00433 to J.S.]; AGAUR [2014-SGR-1041, 2014PROD0005 to R.M. and 2014-SGR-1281 to J.S.]; Fundació La Marató TV3 [416/C/2013-2030 to R.M., 100830/31/32 to J.S., M.G.D. and M.A.S.]; Josep Carreras Leukemia Research Institute [P/AG 2014 to R.M.]; Spanish Health Research Program [PI12/02321 to M.G.D.]; Spanish Association Against Cancer (AECC) [to MCC]; and a grant from the Cellex Foundation, Barcelona [to J.S.].
END NOTES
This article was written following the REMARK guidelines [43, 44].
REFERENCES
1. Döhner H, Weisdorf DJ, Bloomfield CD. Acute Myeloid Leukemia. N Engl J Med. 2015; 373:1136–52. doi: 10.1056/NEJMra1406184.
2. Wang ML, Bailey NG. Acute Myeloid Leukemia Genetics: Risk Stratification and Implications for Therapy. Arch Pathol Lab Med. 2015; 139:1215–23. doi: 10.5858/arpa.2015-0203-RA.
3. Reinisch A, Chan SM, Thomas D, Majeti R. Biology and Clinical Relevance of Acute Myeloid Leukemia Stem Cells. Semin Hematol. 2015; 52:150–64. doi: 10.1053/j.seminhematol.2015.03.008.
4. Döhner H, Estey E, Grimwade D, Amadori S, Appelbaum FR, Büchner T, Dombret H, Ebert BL, Fenaux P, Larson RA, Levine RL, Lo-Coco F, Naoe T, et al. Diagnosis and management of AML in adults: 2017 ELN recommendations from an international expert panel. Blood. 2017; 129: 424–47. doi: 10.1182/blood-2016-08-733196.
5. Wang BH, Li YH, Yu L. Genomics-based Approach and Prognostic Stratification Significance of Gene Mutations in Intermediate-risk Acute Myeloid Leukemia. Chin Med J. 2015; 128: 2395–403. doi: 10.4103/0366-6999.163400.
6. Döhner K, Paschka P. Intermediate-risk acute myeloid leukemia therapy: current and future. Hematology Am Soc Hematol Educ Program. 2014; 2014: 34–43. doi: 10.1182/asheducation-2014.1.34.
7. Hefazi M, Siddiqui M, Patnaik M, Wolanskyj A, Alkhateeb H, Zblewski D, Elliott M, Hogan W, Litzow M, Al-Kali A. Prognostic impact of combined NPM1+/FLT3- genotype in patients with acute myeloid leukemia with intermediate risk cytogenetics stratified by age and treatment modalities. Leuk Res. 2015; 39: 1207–13. doi: 10.1016/j.leukres.2015.09.001.
8. How J, Sykes J, Minden MD, Gupta V, Yee KW, Schimmer AD, Schuh AC, Kamel-Reid S, Brandwein JM. The prognostic impact of FLT3-ITD and NPM1 mutations in patients with relapsed acute myeloid leukemia and intermediate-risk cytogenetics. Blood Cancer J. 2013; 3:e116. doi: 10.1038/bcj.2013.14.
9. Schlenk RF, Döhner K, Krauter J, Fröhling S, Corbacioglu A, Bullinger L, Habdank M, Späth D, Morgan M, Benner A, Schlegelberger B, Heil G, Ganser A, Döhner H, and German-Austrian Acute Myeloid Leukemia Study Group. Mutations and treatment outcome in cytogenetically normal acute myeloid leukemia. N Engl J Med. 2008; 358:1909–18. doi: 10.1056/NEJMoa074306.
10. Pratcorona M, Brunet S, Nomdedéu J, Ribera JM, Tormo M, Duarte R, Escoda L, Guàrdia R, Queipo de Llano MP, Salamero O, Bargay J, Pedro C, Martí JM, et al, and Grupo Cooperativo Para el Estudio y Tratamiento de las Leucemias Agudas Mieloblásticas. Favorable outcome of patients with acute myeloid leukemia harboring a low-allelic burden FLT3-ITD mutation and concomitant NPM1 mutation: relevance to post-remission therapy. Blood. 2013; 121:2734–8. doi: 10.1182/blood-2012-06-431122.
11. Green CL, Koo KK, Hills RK, Burnett AK, Linch DC, Gale RE. Prognostic significance of CEBPA mutations in a large cohort of younger adult patients with acute myeloid leukemia: impact of double CEBPA mutations and the interaction with FLT3 and NPM1 mutations. J Clin Oncol. 2010; 28:2739–47. doi: 10.1200/JCO.2009.26.2501.
12. Patel JP, Gönen M, Figueroa ME, Fernandez H, Sun Z, Racevskis J, Van Vlierberghe P, Dolgalev I, Thomas S, Aminova O, Huberman K, Cheng J, Viale A, et al. Prognostic relevance of integrated genetic profiling in acute myeloid leukemia. N Engl J Med. 2012; 366:1079–89.
13. Papaemmanuil E, Gerstung M, Bullinger L, Gaidzik VI, Paschka P, Roberts ND, Potter NE, Heuser M, Thol F, Bolli N, Gundem G, Van Loo P, Martincorena I, et al. Genomic Classification and Prognosis in Acute Myeloid Leukemia. N Engl J Med. 2016; 374:2209–21. doi: 10.1056/NEJMoa1516192.
14. Tikhmyanova N, Little JL, Golemis EA. Cas Proteins in Normal and Pathological Cell Growth Control. Cell Mol Life Sci. 2010; 67:1025–48. doi: 10.1007/s00018-009-0213-1.
15. O’Neill GM, Seo S, Serebriiskii IG, Lessin SR, Golemis EA. A new central scaffold for metastasis: parsing HEF1/Cas-L/NEDD9. Cancer Res. 2007; 67:8975–9. doi: 10.1158/0008-5472.CAN-07-1328.
16. Recher C, Ysebaert L, Beyne-Rauzy O, Mansat-De Mas V, Ruidavets JB, Cariven P, Demur C, Payrastre B, Laurent G, Racaud-Sultan C. Expression of focal adhesion kinase in acute myeloid leukemia is associated with enhanced blast migration, increased cellularity, and poor prognosis. Cancer Res. 2004; 64:3191–7.
17. Tavernier-Tardy E, Cornillon J, Campos L, Flandrin P, Duval A, Nadal N, Guyotat D. Prognostic value of CXCR4 and FAK expression in acute myelogenous leukemia. Leuk Res. 2009; 33:764–8. doi: 10.1016/j.leukres.2008.10.014.
18. Singh M, Cowell L, Seo S, O’Neill G, Golemis E. Molecular basis for HEF1/NEDD9/Cas-L action as a multifunctional co-ordinator of invasion, apoptosis and cell cycle. Cell Biochem Biophys. 2007; 48:54–72.
19. Nikonova AS, Gaponova AV, Kudinov AE, Golemis EA. CAS proteins in health and disease: an update. IUBMB Life. 2014; 66:387–95. doi: 10.1002/iub.1282.
20. Zhong J, Baquiran JB, Bonakdar N, Lees J, Ching YW, Pugacheva E, Fabry B, O’Neill GM. NEDD9 stabilizes focal adhesions, increases binding to the extra-cellular matrix and differentially effects 2D versus 3D cell migration. PLoS One. 2012; 7:e35058. doi: 10.1371/journal.pone.0035058.
21. Shagisultanova E, Gaponova AV, Gabbasov R, Nicolas E, Golemis EA. Preclinical and clinical studies of the NEDD9 scaffold protein in cancer and other diseases. Gene. 2015; 567:1–11. doi: 10.1016/j.gene.2015.04.086.
22. Nakamoto T, Seo S, Sakai R, Kato T, Kutsuna H, Kurokawa M, Noda M, Miyasaka N, Kitagawa S. Expression and tyrosine phosphorylation of Crk-associated substrate lymphocyte type (Cas-L) protein in human neutrophils. J Cell Biochem. 2008; 105:121–8. doi: 10.1002/jcb.21799.
23. Seo S, Nakamoto T, Takeshita M, Lu J, Sato T, Suzuki T, Kamikubo Y, Ichikawa M, Noda M, Ogawa S, Honda H, Oda H, Kurokawa M. Crk-associated substrate lymphocyte type regulates myeloid cell motility and suppresses the progression of leukemia induced by p210Bcr/Abl. Cancer Sci. 2011; 102:2109–17. doi: 10.1111/j.1349-7006.2011.02066.x.
24. Li Y, Bavarva JH, Wang Z, Guo J, Qian C, Thibodeau SN, Golemis EA, Liu W. HEF1, a novel target of Wnt signaling, promotes colonic cell migration and cancer progression. Oncogene. 2011; 30:2633–43. doi: 10.1038/onc.2010.632.
25. Seo S, Asai T, Saito T, Suzuki T, Morishita Y, Nakamoto T, Ichikawa M, Yamamoto G, Kawazu M, Yamagata T, Sakai R, Mitani K, Ogawa S, et al. Crk-associated substrate lymphocyte type is required for lymphocyte trafficking and marginal zone B cell maintenance. J Immunol. 2005; 175:3492–501.
26. Izumchenko E, Singh MK, Plotnikova OV, Tikhmyanova N, Little JL, Serebriiskii IG, Seo S, Kurokawa M, Egleston BL, Klein-Szanto A, Pugacheva EN, Hardy RR, Wolfson M, et al. NEDD9 promotes oncogenic signaling in mammary tumor development. Cancer Res. 2009; 69:7198–206. doi: 10.1158/0008-5472.CAN-09-0795.
27. de Jong R, van Wijk A, Haataja L, Heisterkamp N, Groffen J. BCR/ABL-induced leukemogenesis causes phosphorylation of Hef1 and its association with Crkl. J Biol Chem. 1997; 272: 32649–55.
28. Iwata S, Souta-Kuribara A, Yamakawa A, Sasaki T, Shimizu T, Hosono O, Kawasaki H, Tanaka H, Dang NH, Watanabe T, Arima N, Morimoto C. HTLV-I Tax induces and associates with Crk-associated substrate lymphocyte type (Cas-L). Oncogene. 2005; 24:1262–71. doi: 10.1038/sj.onc.1208261.
29. Fashena SJ, Einarson MB, O’Neill GM, Patriotis C, Golemis EA. Dissection of HEF1-dependent functions in motility and transcriptional regulation. J Cell Sci. 2002; 115:99–111.
30. Kong C, Wang C, Wang L, Ma M, Niu C, Sun X, Du J, Dong Z, Zhu S, Lu J, Huang B. NEDD9 is a positive regulator of epithelial-mesenchymal transition and promotes invasion in aggressive breast cancer. PLoS One. 2011; 6:e22666. doi: 10.1371/journal.pone.0022666.
31. Ahn J, Sanz-Moreno V, Marshall CJ. The metastasis gene NEDD9 product acts through integrin β3 and Src to promote mesenchymal motility and inhibit amoeboid motility. J Cell Sci. 2012; 125:1814–26. doi: 10.1242/jcs.101444.
32. Kim SH, Xia D, Kim SW, Holla V, Menter DG, Dubois RN. Human enhancer of filamentation 1 Is a mediator of hypoxia-inducible factor-1alpha-mediated migration in colorectal carcinoma cells. Cancer Res. 2010; 70:4054–63. doi: 10.1158/0008-5472.CAN-09-2110.
33. Guerrero MS, Parsons JT, Bouton AH. Cas and NEDD9 Contribute to Tumor Progression through Dynamic Regulation of the Cytoskeleton. Genes Cancer. 2012; 3:371–81. doi: 10.1177/1947601912458585.
34. Grimwade D, Hills RK, Moorman AV, Walker H, Chatters S, Goldstone AH, Wheatley K, Harrison CJ, Burnett AK, and National Cancer Research Institute Adult Leukaemia Working Group. Refinement of cytogenetic classification in acute myeloid leukemia: determination of prognostic significance of rare recurring chromosomal abnormalities among 5876 younger adult patients treated in the United Kingdom Medical Research Council trials. Blood. 2010; 116:354–65. doi: 10.1182/blood-2009-11-254441.
35. Grimwade D, Walker H, Oliver F, Wheatley K, Harrison C, Harrison G, Rees J, Hann I, Stevens R, Burnett A, Goldstone A, and The Medical Research Council Adult and Children’s Leukaemia Working Parties. The importance of diagnostic cytogenetics on outcome in AML: analysis of 1,612 patients entered into the MRC AML 10 trial. The Medical Research Council Adult and Children’s Leukaemia Working Parties. Blood. 1998; 92:2322–33.
36. Mayer RJ, Davis RB, Schiffer CA, Berg DT, Powell BL, Schulman P, Omura GA, Moore JO, McIntyre OR, Frei E 3rd, and Cancer and Leukemia Group B. Intensive Postremission Chemotherapy in Adults with Acute Myeloid Leukemia. N Engl J Med. 1994; 331:896–903. doi: 10.1056/NEJM199410063311402.
37. Livak KJ, Schmittgen TD. Analysis of Relative Gene Expression Data Using Real-Time Quantitative PCR and the 2−ΔΔCT Method. Methods. 2001; 25:402–8. doi: 10.1006/meth.2001.1262.
38. Perea G, Lasa A, Aventín A, Domingo A, Villamor N, Queipo de Llano MP, Llorente A, Juncà J, Palacios C, Fernández C, Gallart M, Font L, Tormo M, et al, and Grupo Cooperativo para el Estudio y Tratamiento de las Leucemias Agudas y Miel. Prognostic value of minimal residual disease (MRD) in acute myeloid leukemia (AML) with favorable cytogenetics [t(8;21) and inv(16)]. Leukemia. 2006; 20:87–94. doi: 10.1038/sj.leu.2404015.
39. Cheson BD, Bennett JM, Kopecky KJ, Büchner T, Willman CL, Estey EH, Schiffer CA, Doehner H, Tallman MS, Lister TA, Lo-Coco F, Willemze R, Biondi A, et al, and International Working Group for Diagnosis, Standardization of Response Criteria, Treatment Outcomes, and Reporting Standards for Therapeutic Trials in Acute Myeloid Leukemia. Revised recommendations of the International Working Group for Diagnosis, Standardization of Response Criteria, Treatment Outcomes, and Reporting Standards for Therapeutic Trials in Acute Myeloid Leukemia. J Clin Oncol. 2003; 21:4642–9. doi: 10.1200/JCO.2003.04.036.
40. R Core Team. R: A Language and Environment for Statistical Computing. R Foundation for Statistical Computing; 2014. Available from http://www.R-project.org.
41. Gray RJ. A Class of K-Sample Tests for Comparing the Cumulative Incidence of a Competing Risk. Ann Stat. 1988; 16:1141–54.
42. Fine JP, Gray RJ. A Proportional Hazards Model for the Subdistribution of a Competing Risk. J Am Stat Assoc. 1999; 94:496–509. doi: 10.1080/01621459.1999.10474144.
43. McShane LM, Altman DG, Sauerbrei W, Taube SE, Gion M, Clark GM, and Statistics Subcommittee of the NCI-EORTC Working Group on Cancer Diagnostics. REporting recommendations for tumor MARKer prognostic studies (REMARK). Nat Clin Pract Oncol. 2005; 2:416–22. doi: 10.1038/ncponc0252.
44. Mallett S, Timmer A, Sauerbrei W, Altman DG. Reporting of prognostic studies of tumour markers: a review of published articles in relation to REMARK guidelines. Br J Cancer. 2010; 102:173–80. doi: 10.1038/sj.bjc.6605462.