
INTRODUCTION
One of the most surprising advances in understanding the mechanisms of gene regulation in health and disease has been the discovery of microRNA (miRNA) [1].
MiRNAs are short (usually 21–23 nucleotides in length), evolutionarily conserved, noncoding RNA molecules that exert post-transcriptional regulation via binding to complementary sequences in the 3′-untranslated region (3′ UTR) or 5′-untranslated region (5′UTR) of target messenger RNAs (mRNAs) [2, 3]. Upon miRNA binding, the mRNA transcript is degraded or its translation inhibited [4]. Thus, miRNAs play a crucial role in gene expression, affecting many normal and abnormal cellular processes such as cell differentiation, proliferation, metabolism, apoptosis, and tumorigenesis [5, 6].
Breast cancer (BC) is the most common type of cancer affecting women worldwide. Although its etiology is multifactorial, its development and outcome are especially influenced by genetic factors. In this regard, several studies pointed out that alterations in miRNAs may contribute to the pathogenesis of BC [6, 7]. Since approximately 50% of miRNA genes are located in cancer-related chromosomal regions [8], in recent years their usefulness as biomarkers to evaluate cancer risk has been the subject of intense research.
Single nucleotide polymorphisms (SNPs) represent the most common form of genetic variation. When present in miRNA genes, SNPs may influence miRNAs’ properties by altering their expression, maturation, and/or function [9], and may thus increase the risk of cancer, or influence its progression [10, 11].
Among several common miRNA SNPs purportedly related with BC risk, the association of rs2910164 in miR-146a, rs11614913 in miR-196a2, and rs3746444 in miR-499 and BC risk remains inconclusive. For instance, Bansal et al. found that the heterozygous variant of rs2910164 in miR-146a is associated with reduced risk of BC [12], while a separate report indicated associations for rs11614913 in miR-196a2 and rs3746444 in miR-499 [13]. Nevertheless, some studies reported that these polymorphisms were not related to BC risk [14, 15]. Therefore, in order to evaluate the association of these three miRNA SNPs and BC susceptibility, we performed this meta-analysis by systematically summarizing published data.
RESULTS
Characteristics of the studies
Based on the search strategy, a total of 217 articles were chosen from PubMed and EMBASE databases. After screening the title and abstract, 192 articles uncorrelated with BC risk and miR-146a/-196a2/-499 SNPs were excluded. 25 articles were then evaluated in detail, and 8 articles were further excluded, among which 3 were meeting reports [16–18], 2 had inadequate information to calculate ORs [19, 20], and the other 3 were not case-control studies [21–23]. Finally, 17 eligible articles were included in our meta-analysis [12–15, 24–36] (Figure 1). The characteristics and the NOS quality assessment of the included studies are outlined in Table 1 and Figure 2. We categorized races as Asian (Chinese, Iranian, and Indian), Caucasian (Australian, Arab, Brazilian, French, Italian, German, and American), and Mixed (Chilean, and Non-Caucasian Brazilian) based on the original information from each study. In these articles, the distribution of genotypes in the controls were consistent with HWE in most of the studies, but some parts of the data in Qi’s, Omrani’s, Catucci’s, Ma’s, Bansal’s, Alshatwi’s, and Linhares’ studies didn’t meet HWE. In Catucci’s study, the subjects were from two countries, whereas in Linhares’ study the samples in the case and control groups belonged to Caucasian and non-Caucasian populations, so we treated them as independent studies. There were nine studies containing 4,441 cases and 3,899 controls for miR-146a rs2910164 [12–15, 24–26, 28, 36]; twelve studies involving 5,792 cases and 7,159 controls for miR-196a2 rs11614913 [13, 14, 27–35]; and seven studies including 4,019 cases and 4,683 controls for miR-499 rs3746444 [13, 14, 24, 28, 30, 35]. Genotype distributions in controls were in accord with HWE in all included studies. A variety of genotyping methods were applied including TaqMan, PCR-RFLP, MassARRAY, and HRM.
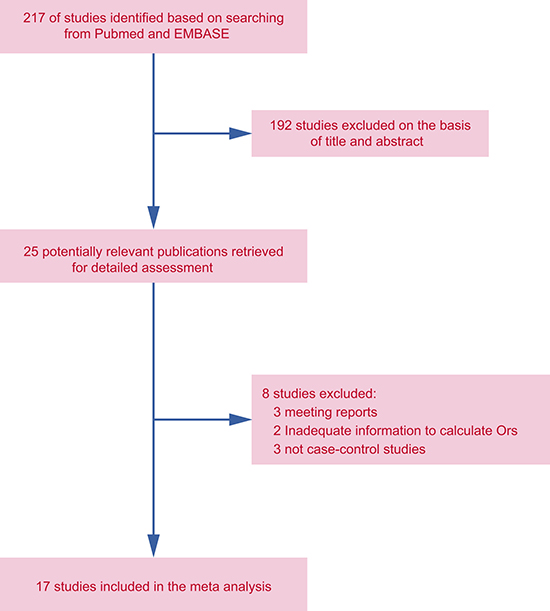
Figure 1: Study selection process.
Table 1: The baseline characteristics for included studies
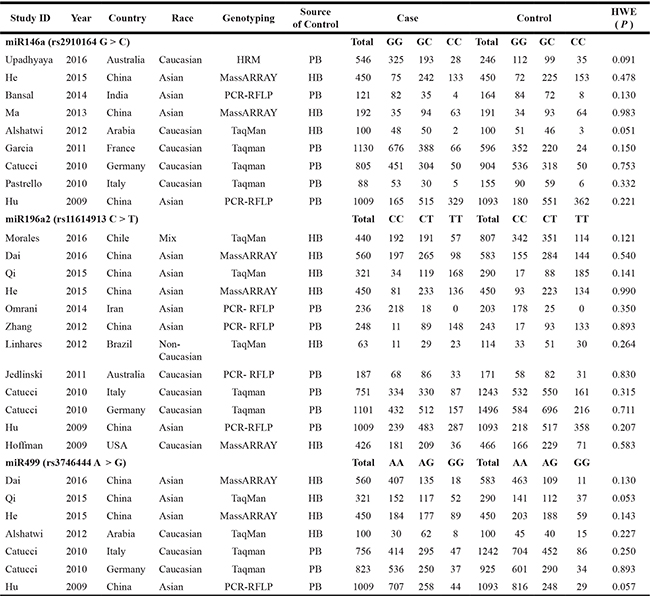
Notes: PB: Population-based; HB: Hospital-based.
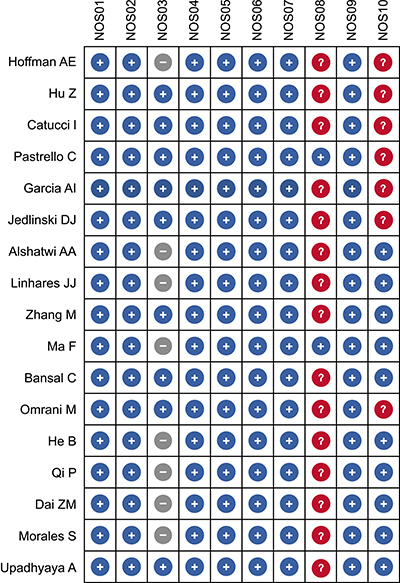
Figure 2: Quality assessment of included studies according to the Newcastle-Ottawa Scale (NOS) criteria).
Association between miRNA-146a rs2910164 polymorphism and BC susceptibility
We firstly assessed the association between miRNA-146a rs2910164 polymorphism and BC susceptibility. Significant heterogeneity was identified by Q-test and I2 statistic under all genetic models except the heterozygote. Therefore, except for the latter, the random-effects model was used for all models. No significant associations were identified for any genetic model (C vs. G: OR = 0.90, 95% CI: 0.78–1.05; CC vs. GG: OR = 0.86, 95% CI: 0.62–1.20; GC vs. GG: OR = 0.95, 95% CI: 0.86–1.05; CC + GC vs. GG: OR = 0.89, 95% CI: 0.75–1.07; CC vs. GG + GC: OR = 0.89, 95% CI: 0.69–1.16) (Figure 3A, Table 2).
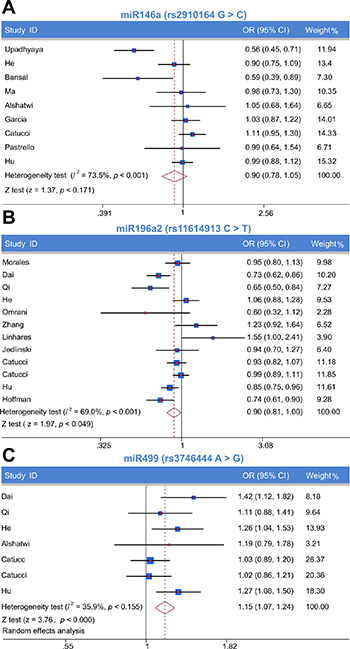
Figure 3: Meta-analysis of the relationship between miR-146a rs2910164, miR-196a2 rs11614913, and miR-499 rs3746444 polymorphisms and breast cancer risk. Forest plot of allelic contrast model (A) miR-146a rs2910164, (B) miR-196a2 rs11614913, (C) miR-499 rs3746444).
Table 2: Meta-analysis of the relationships between miR146a (rs2910164 G > C) polymorphism and breast cancer risk
Group |
Included studies |
Genotype models |
OR (95% CI) |
Z |
P |
Heterogeneity test |
|
|---|---|---|---|---|---|---|---|
Ph |
I2 |
||||||
Total |
9 studies |
C vs. G |
0.90 (0.78, 1.05) |
1.37 |
0.171 |
0 |
73.50% |
CC vs. GG |
0.86 (0.62, 1.20) |
0.89 |
0.374 |
0.001 |
68.90% |
||
GC vs. GG |
0.95 (0.86, 1.05) |
0.98 |
0.326 |
0.061 |
46.40% |
||
CCcGC vs. GG |
0.89 (0.75, 1.07) |
1.26 |
0.209 |
0.005 |
63.40% |
||
CC vs. GG + GC |
0.89 (0.69, 1.16) |
0.88 |
0.379 |
0.005 |
63.90% |
||
Asian |
4 studies |
C vs. G |
0.91 (0.78, 1.06) |
1.24 |
0.213 |
0.112 |
49.90% |
CC vs. GG |
0.93 (0.76, 1.13) |
0.73 |
0.463 |
0.701 |
0.00% |
||
GC vs. GG |
0.88 (0.66, 1.19) |
0.83 |
0.407 |
0.08 |
55.60% |
||
CC + GC vs. GG |
0.86 (0.65, 1.14) |
1.05 |
0.296 |
0.083 |
55.00% |
||
CC vs. GG + GC |
0.93 (0.80, 1.07) |
1.05 |
0.293 |
0.693 |
0.00% |
||
Caucasian |
5 studies |
C vs. G |
0.92 (0.70, 1.20) |
0.62 |
0.533 |
0 |
83.40% |
CC vs. GG |
0.85 (0.41, 1.80) |
0.42 |
0.677 |
0 |
83.50% |
||
GC vs. GG |
0.93 (0.76, 1.14) |
0.66 |
0.506 |
0.088 |
50.60% |
||
CC + GC vs. GG |
0.91 (0.70, 1.19) |
0.68 |
0.494 |
0.005 |
73.30% |
||
CC vs. GG + GC |
0.88 (0.45, 1.74) |
0.36 |
0.72 |
0 |
80.70% |
||
Population-based |
6 studies |
C vs. G |
0.87 (0.71, 1.07) |
1.3 |
0.193 |
0 |
83.10% |
CC vs. GG |
0.85 (0.52, 1.38) |
0.66 |
0.507 |
0 |
80.30% |
||
GC vs. GG |
0.94 (0.84, 1.04) |
1.19 |
0.236 |
0.015 |
64.70% |
||
CC + GC vs. GG |
0.85 (0.67, 1.08) |
1.37 |
0.172 |
0.001 |
76.60% |
||
CC vs. GG + GC |
0.89 (0.59, 1.36) |
0.53 |
0.599 |
0.001 |
76.30% |
||
Hospital-based |
3 studies |
C vs. G |
0.94 (0.81, 1.09) |
0.87 |
0.383 |
0.771 |
0.00% |
CC vs. GG |
0.87 (0.63, 1.20) |
0.87 |
0.383 |
0.91 |
0.00% |
||
GC vs. GG |
1.05 (0.80, 1.37) |
0.33 |
0.739 |
0.916 |
0.00% |
||
CC + GC vs. GG |
0.99 (0.77, 1.29) |
0.05 |
0.957 |
0.877 |
0.00% |
||
CC vs. GG + GC |
0.85 (0.68, 1.08) |
1.32 |
0.187 |
0.769 |
0.00% |
||
Sample-size < 500 |
4 studies |
C vs. G |
0.88 (0.69, 1.14) |
0.96 |
0.34 |
0.167 |
40.70% |
CC vs. GG |
0.91 (0.57, 1.45) |
0.41 |
0.684 |
0 |
83.50% |
||
GC vs. GG |
0.81 (0.62, 1.06) |
1.53 |
0.127 |
0.133 |
46.50% |
||
CC + GC vs. GG |
0.83 (0.58, 1.19) |
1.01 |
0.313 |
0.123 |
48.10% |
||
CC vs. GG + GC |
0.96 (0.66, 1.39) |
0.22 |
0.827 |
0.797 |
0.00% |
||
Sample size ≥ 500 |
5 studies |
C vs. G |
0.91 (0.76, 1.10) |
0.99 |
0.321 |
0 |
83.80% |
CC vs. GG |
0.85 (0.54, 1.32) |
0.74 |
0.46 |
0.701 |
0.00% |
||
GC vs. GG |
0.98 (0.87, 1.09) |
0.43 |
0.667 |
0.097 |
49.00% |
||
CC + GC vs. GG |
0.92 (0.74, 1.14) |
0.77 |
0.441 |
0.005 |
73.00% |
||
Notes: OR = Odds ratios; 95% CI = 95% confidence intervals.
Next, subgroup analysis was carried out according to race. No significant association was found in any genetic model for Asians and Caucasians. Subgroup analysis based on the source of controls revealed no significant association between any genetic model and either population-based or hospital-based groups; also, no associations were detected for sample sizes < 500 and ≥ 500 (Table 2).
Association between miRNA-196a2 rs11614913 polymorphism and BC susceptibility
The association between miR-196a2 rs11614913 polymorphism and the risk of BC was tested using the random-effects model, due to the presence of significant heterogeneity, for the allelic contrast model and the homozygote, dominant, and recessive models, while the fixed-effects model was used for the heterozygote model. A significantly decreased risk of BC was observed under the allelic contrast model and the recessive model (T vs. C, OR = 0.90, 95% CI: 0.81–1.00; TT vs. CC + TC, OR = 0.86, 95% CI: 0.74–1.00; Table 3; Figure 3B).
Table 3: Meta-analysis of the relationships between miR196a2 (rs11614913 C > T) polymorphism and breast cancer risk
Group |
Included studies |
Genotype models |
OR (95% CI) |
Z |
P |
Heterogeneity test |
|
|---|---|---|---|---|---|---|---|
Ph |
I2 |
||||||
Total |
12 studies |
T vs. C |
0.90 (0.81, 1.00) |
1.97 |
0.049 |
0 |
69.00% |
TT vs. CC |
0.83 (0.67, 1.02) |
1.76 |
0.079 |
0.001 |
68.00% |
||
TC vs. CC |
0.92 (0.85, 1.00) |
1.88 |
0.06 |
0.28 |
16.70% |
||
TT + TC vs. CC |
0.88 (0.78, 1.01) |
1.88 |
0.06 |
0.015 |
53.10% |
||
TT vs. CC + TC |
0.86 (0.74, 1.00) |
2.01 |
0.044 |
0.008 |
58.00% |
||
Asian |
6 studies |
T vs. C |
0.85 (0.71, 1.02) |
1.75 |
0.08 |
0.001 |
75.50% |
TT vs. CC |
0.78 (0.54, 1.12) |
1.36 |
0.175 |
0.003 |
74.70% |
||
TC vs. CC |
0.85 (0.74, 0.99) |
2.17 |
0.03 |
0.135 |
40.60% |
||
TT + TC vs. CC |
0.81 (0.63, 1.05) |
1.59 |
0.112 |
0.021 |
62.40% |
||
TT vs. CC + TC |
0.83 (0.67, 1.04) |
1.65 |
0.099 |
0.014 |
67.90% |
||
Caucasian |
4 studies |
T vs. C |
0.91 (0.80, 1.03) |
1.55 |
0.121 |
0.097 |
52.50% |
TT vs. CC |
0.79 (0.59, 1.08) |
1.49 |
0.136 |
0.041 |
63.70% |
||
TC vs. CC |
0.95 (0.85, 1.06) |
0.92 |
0.358 |
0.771 |
0.00% |
||
TT + TC vs. CC |
0.94 (0.85, 1.05) |
1.08 |
0.282 |
0.24 |
28.70% |
||
TT vs. CC + TC |
0.83 (0.64, 1.08) |
1.38 |
0.167 |
0.063 |
58.80% |
||
Mix |
2 studies |
T vs. C |
1.16 (0.72, 1.86) |
0.62 |
0.538 |
0.042 |
75.90% |
TT vs. CC |
1.31 (0.53, 3.28) |
0.58 |
0.559 |
0.049 |
74.20% |
||
TC vs. CC |
1.02 (0.80, 1.29) |
0.15 |
0.877 |
0.196 |
40.10% |
||
TT + TC vs. CC |
1.23 (0.63, 2.39) |
0.6 |
0.548 |
0.084 |
66.60% |
||
TT vs. CC + TC |
1.12 (0.65, 1.94) |
0.41 |
0.678 |
0.129 |
56.60% |
||
Population-based |
6 studies |
T vs. C |
0.94 (0.85, 1.04) |
1.21 |
0.228 |
0.126 |
41.90% |
TT vs. CC |
0.89 (0.74, 1.07) |
1.28 |
0.2 |
0.211 |
31.60% |
||
TC vs. CC |
0.94 (0.84, 1.04) |
1.22 |
0.224 |
0.476 |
0.00% |
||
TT + TC vs. CC |
0.91 (0.81, 1.03) |
1.44 |
0.151 |
0.263 |
22.70% |
||
TT vs. CC + TC |
0.92 (0.81, 1.05) |
1.23 |
0.22 |
0.339 |
11.70% |
||
Hospital-based |
6 studies |
T vs. C |
0.87 (0.72, 1.05) |
1.41 |
0.159 |
0 |
78.90% |
TT vs. CC |
0.76 (0.51, 1.13) |
1.35 |
0.178 |
0 |
78.30% |
||
TC vs. CC |
0.90 (0.79, 1.03) |
1.5 |
0.132 |
0.132 |
41.00% |
||
TT + TC vs. CC |
0.87 (0.68, 1.11) |
1.11 |
0.266 |
0.007 |
68.60% |
||
TT vs. CC + TC |
0.79 (0.60, 1.02) |
1.79 |
0.073 |
0.007 |
68.60% |
||
Sample-size < 500 |
4 studies |
T vs. C |
1.07 (0.79, 1.45) |
0.43 |
0.667 |
0.058 |
59.90% |
TT vs. CC |
1.43 (0.81, 2.52) |
1.23 |
0.218 |
0.178 |
42.10% |
||
TC vs. CC |
0.96 (0.70, 1.31) |
0.25 |
0.801 |
0.149 |
43.80% |
||
TT + TC vs. CC |
1.07 (0.66, 1.76) |
0.28 |
0.778 |
0.066 |
58.30% |
||
TT vs. CC + TC |
1.21 (0.92, 1.59) |
1.36 |
0.173 |
0.502 |
0.00% |
||
Sample size ≥ 500 |
8 studies |
T vs. C |
0.87 (0.78, 0.96) |
2.74 |
0.006 |
0.002 |
70.00% |
TT vs. CC |
0.75 (0.61, 0.93) |
2.66 |
0.008 |
0.003 |
68.00% |
||
TC vs. CC |
0.92 (0.85, 1.00) |
1.88 |
0.06 |
0.349 |
10.50% |
||
TT + TC vs. CC |
0.86 (0.76, 0.98) |
2.22 |
0.026 |
0.029 |
55.20% |
||
TT vs. CC + TC |
0.80 (0.69, 0.93) |
2.94 |
0.003 |
0.03 |
54.90% |
||
Notes: OR = Odds ratios; 95% CI = 95% confidence intervals.
In subgroup analysis by race, a significantly decreased risk of BC was observed for Asians under the heterozygote model (TC vs. CC: OR = 0.85, 95% CI: 0.74–0.99). In Caucasians, in contrast, no association was detected between miR-196a2 rs11614913 and BC risk for any genotype model. Similarly, no relationship was found for any genotype model in the mixed-race subgroup. Results of subgroup analysis based on the source of controls showed no significant association between any genetic model and either population-based or hospital-based controls. We also found no significant association for sample size < 500 under any genetic model, although a sample size ≥ 500 was associated with decreased BC risk in all models except the heterozygote (T vs. C: OR = 0.87, 95% CI: 0.78–0.96; TT vs. CC: OR = 0.75, 95% CI: 0.61–0.93; TT + TC vs. CC: OR = 0.86, 95% CI: 0.76–0.98; TT vs. CC + TC: OR = 0.80, 95% CI: 0.69–0.93; Table 3).
Association between miRNA-499 rs3746444 polymorphism and BC susceptibility
The association between miR-499 rs3746444 polymorphism and the risk of BC was examined by applying the fixed-effects model to assess all genetic models. A significantly increased risk of BC was observed for all genetic models (G vs. A: OR = 1.15, 95% CI: 1.07–1.24; GG vs. AA: OR = 1.32, 95% CI: 1.10–1.58; GA vs. AA: OR = 1.13, 95% CI: 1.03–1.24; GG + GA vs. AA: OR = 1.16, 95% CI: 1.06–1.27; GG vs. AA + GA: OR = 1.27, 95% CI: 1.06–1.51; Figure 3C).
Subgroup analysis was performed for the Asian population, where a positive association was identified under all genetic models (G vs. A: OR = 1.26, 95% CI: 1.14–1.40; GG vs. AA: OR = 1.60, 95% CI: 1.26–2.04; GA vs. AA: OR = 1.17, 95% CI: 1.02–1.33; GG + GA vs. AA: OR = 1.25, 95% CI: 1.10–1.41; GG vs. AA + GA: OR = 1.60, 95% CI: 1.27–2.02). In contrast, no association was found for Caucasians under any genetic model. Subgroup analysis by source of controls indicated an association with hospital-based controls under all genetic models (G vs. A: OR = 1.25, 95% CI: 1.11–1.41; GG vs. AA: OR = 1.48, 95% CI: 1.13–1.93; GA vs. AA: OR = 1.21, 95% CI: 1.02–1.43; GG + GA vs. AA: OR = 1.28, 95% CI: 1.09–1.49; GG vs. AA + GA: OR = 1.39, 95% CI: 1.08–1.79). Also, a significant association was identified between all genetic models and sample size ≥ 500 (G vs. A: OR = 1.15, 95% CI: 1.07–1.24; GG vs. AA: OR = 1.34, 95% CI: 1.12–1.62; GA vs. AA: OR = 1.11, 95% CI: 1.01–1.22; GG + GA vs. AA: OR = 1.15, 95% CI: 1.05–1.25; GG vs. AA + GA: OR = 1.32, 95% CI: 1.10–1.58), and between the dominant and heterozygote models and sample size < 500 (GA vs. AA: OR = 2.33, 95% CI: 1.26–4.28; GG + GA vs. AA: OR = 1.91, 95% CI: 1.07–3.41; Table 4).
Table 4: Meta-analysis of the relationships between miR499 (rs3746444 A > G) polymorphism and breast cancer risk
Group |
Included studies |
Genotype models |
OR (95% CI) |
Z |
P |
Heterogeneity test |
|
|---|---|---|---|---|---|---|---|
Ph |
I2 |
||||||
Total |
7 studies |
G vs. A |
1.15 (1.07, 1.24) |
3.76 |
0 |
0.155 |
35.90% |
GG vs. AA |
1.32 (1.10, 1.58) |
2.99 |
0.003 |
0.239 |
24.80% |
||
GA vs. AA |
1.13 (1.03, 1.24) |
2.48 |
0.013 |
0.078 |
47.20% |
||
GG + GA vs. AA |
1.16 (1.06, 1.27) |
3.23 |
0.001 |
0.151 |
36.40% |
||
GG vs. AA + GA |
1.27 (1.06, 1.51) |
2.65 |
0.008 |
0.071 |
48.30% |
||
Asian |
4 studies |
G vs. A |
1.26 (1.14, 1.40) |
4.52 |
0 |
0.567 |
0.00% |
GG vs. AA |
1.60 (1.26, 2.04) |
3.84 |
0 |
0.795 |
0.00% |
||
GA vs. AA |
1.17 (1.02, 1.33) |
2.31 |
0.021 |
0.321 |
14.20% |
||
GG + GA vs. AA |
1.25 (1.10, 1.41) |
3.46 |
0.001 |
0.492 |
0.00% |
||
GG vs. AA + GA |
1.60 (1.27, 2.02) |
4.01 |
0 |
0.77 |
0.00% |
||
Caucasian |
3 studies |
G vs. A |
1.04 (0.93, 1.15) |
0.69 |
0.493 |
0.794 |
0.00% |
GG vs. AA |
1.01 (0.76, 1.34) |
0.06 |
0.955 |
0.605 |
0.00% |
||
GA vs. AA |
1.19 (0.88, 1.60) |
1.1 |
0.271 |
0.026 |
72.50% |
||
GG + GA vs. AA |
1.14 (0.89, 1.39) |
0.96 |
0.335 |
0.113 |
54.20% |
||
GG vs. AA + GA |
0.94 (0.71, 1.24) |
0.45 |
0.65 |
0.194 |
39.10% |
||
Population-based |
3 studies |
G vs. A |
1.10 (1.00, 1.20) |
1.96 |
0.05 |
0.114 |
53.90% |
GG vs. AA |
1.19 (0.93, 1.53) |
1.4 |
0.162 |
0.124 |
52.00% |
||
GA vs. AA |
1.09 (0.97, 1.22) |
1.48 |
0.139 |
0.327 |
10.60% |
||
GG + GA vs. AA |
1.11 (0.99, 1.23) |
1.81 |
0.07 |
0.229 |
32.10% |
||
GG vs. AA + GA |
1.16 (0.90, 1.48) |
1.16 |
0.247 |
0.116 |
53.50% |
||
Hospital-based |
4 studies |
G vs. A |
1.25 (1.11, 1.41) |
3.63 |
0 |
0.554 |
0.00% |
GG vs. AA |
1.48 (1.13, 1.93) |
2.87 |
0.004 |
0.474 |
0.00% |
||
GA vs. AA |
1.21 (1.02, 1.43) |
2.22 |
0.027 |
0.042 |
63.30% |
||
GG + GA vs. AA |
1.28 (1.09, 1.49) |
3.03 |
0.002 |
0.223 |
31.50% |
||
GG vs. AA + GA |
1.39 (1.08, 1.79) |
2.6 |
0.009 |
0.104 |
51.30% |
||
Sample-size < 500 |
1 study |
G vs. A |
1.19 (0.79, 1.78) |
0.83 |
0.408 |
NA |
NA |
GG vs. AA |
0.80 (0.30, 2.12) |
0.45 |
0.654 |
NA |
NA |
||
GA vs. AA |
2.33 (1.26, 4.28) |
2.71 |
0.007 |
NA |
NA |
||
GG + GA vs. AA |
1.91 (1.07, 3.41) |
2.18 |
0.029 |
NA |
NA |
||
GG vs. AA + GA |
0.49 (0.20, 1.22) |
1.53 |
0.126 |
NA |
NA |
||
Sample size ≥ 500 |
6 studies |
G vs. A |
1.15 (1.07, 1.24) |
3.67 |
0 |
0.097 |
46.40% |
GG vs. AA |
1.34 (1.12, 1.62) |
3.13 |
0.002 |
0.226 |
27.90% |
||
GA vs. AA |
1.11 (1.01, 1.22) |
2.07 |
0.039 |
0.326 |
13.90% |
||
GG + GA vs. AA |
1.15 (1.05, 1.25) |
2.93 |
0.003 |
0.258 |
23.50% |
||
GG vs. AA + GA |
1.32 (1.10, 1.58) |
3.03 |
0.002 |
0.202 |
31.10% |
||
Notes: OR = Odds ratios; 95% CI = 95% confidence intervals; NA = Not available.
Publication bias
We utilized Begg’s funnel plot and Egger’s test to evaluate publication bias. No evidence of publication bias was found for the association between miR-146a rs2910164, miR-196a2 rs11614913, and miR-499 rs3746444 polymorphisms and BC susceptibility using Begg’s funnel for the allelic contrast model (Figure 4). Egger’s test also suggested no publication bias for the homozygote (rs2910164: P = 0.607; rs11614913: P = 0.624; rs3746444: P = 0.975), heterozygote (rs2910164: P = 0.298; rs11614913: P = 0.948; rs3746444: P = 0.207), dominant (rs2910164: P = 0.286; rs11614913: P = 0.942; rs3746444: P = 0.166) and recessive (rs2910164: P = 0.724; rs11614913: P = 0.728; rs3746444: P = 0.653) models.
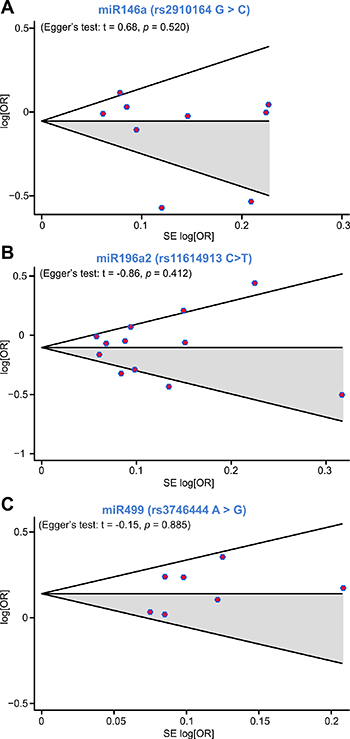
Figure 4: Begg’s funnel plot for publication bias analysis under the allelic contrast model (A) miR-146a rs2910164, (B) miR-196a2 rs11614913, (C) miR-499 rs3746444).
Sensitivity analysis
To examine the influence exerted by individual studies on the pooled ORs, sensitivity analysis in the allelic contrast model was performed by successively deleting each participant study. We confirmed that the omission of any single study did not significantly affect the overall results (Figure 5).
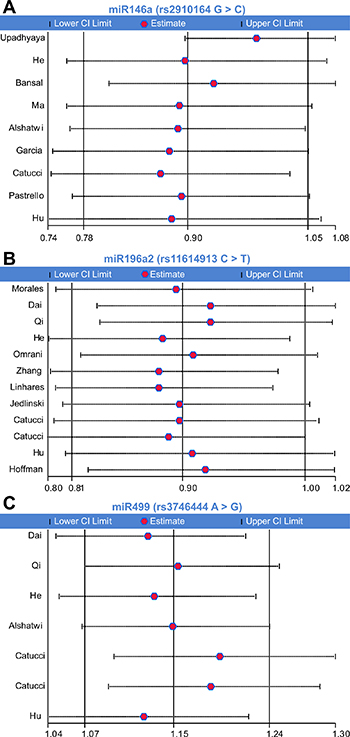
Figure 5: Influence of individual studies on the overall OR under the allelic contrast model (A) miR-146a rs2910164, (B) miR-196a2 rs11614913, (C) miR-499 rs3746444).
DISCUSSION
MiRNAs mediate degradation or translational repression by binding to the 3′UTR and 5′UTR of the target mRNA [2]. SNPs, the most common source of genetic sequence variation, can affect the function of miRNAs by altering primary transcript formation, pre-miRNA maturation, or miRNA-mRNA interactions [11, 37]. Even minor variations in miRNAs could have an enormous effect on the expression of different target genes and thus lead to susceptibility to several diseases including BC [38]. Murria Estal et al. identified miRNA profiles related to breast cancer features like node involvement, histological grade, ER, PR, and HER2 expression [39]. SNPs in miR-146a (rs2910164), miR-196a2 (rs11614913), and miR-499 (rs3746444) have been suggested to be predictive biomarkers for patients with BC [12, 14, 15, 26–28, 30, 31, 35, 40], although the studies in question provided inconsistent results. This lack of consensus prompted us to perform a comprehensive meta-analysis on the association of these three miRNAs polymorphisms and BC risk.
The miR-146a human gene is located on chromosome 5 at locus 5q34 and has been linked with BRCA1/BRCA2 activity. The SNP rs2910164 is located in the middle of the miRNA stem hairpin and leads to a change from a G:U pair to a C:U mismatch in the stem structure of the precursor molecule, altering the expression of mature miR-146a [41]. This SNP has been associated with the risk of various cancers, among them hepatocellular and bladder carcinomas [41, 42], evidencing also cancer-specific and ethnicity-dependent effects [43, 44]. Our analysis of miR-146a rs2910164, which included 4,441 cases and 3,899 controls from nine studies, revealed however no association with BC in both overall comparison and subgroup analysis by race, source of control, and sample size. In accordance with this conclusion, studies by Catucci et al. [14] and Alshatwi et al. [24] also failed to demonstrate a link between rs2910164 and BC risk.
The rs11614913 polymorphism in miR-196a2, located in the mature sequence of miR-196a-3P, may affect pre-miRNA maturation and confer diminished capacity to regulate target genes [11, 27]. Epidemiology studies have also revealed an association between rs11614913 and risk for multiple cancers; however, results were conflicting [42, 45]. Similarly, Linhares et al. [32] found that individuals carrying the CC genotype of rs11614913 in miR-196a2 had decreased BC risk, whereas Gao et al. [46] found instead a positive association between this genotype and BC risk. On the other hand, Dai et al. concluded that rs11614913 may reduce the risk of BC under the recessive model [47]. However, our meta-analysis involving twelve studies with 5,792 cases and 7,159 controls demonstrated an association of rs11614913 with decreased risk of BC both in the allelic contrast model and the recessive model. In subgroup analysis, a significant association was observed between rs11614913 and reduced risk of BC for the heterozygote model in Asians, and for all, except the heterozygote, genetic models when sample size ≥ 500. The discrepancies may derive from different sample sizes, races, and genetic backgrounds of the studies’ groups.
Rs3746444, located at the 3p region of mature miR-499, involves a A:U to G:U mismatch in the stem structure of the precursor molecule, leading to altered processing and expression of the mature transcript [48]. The presence of this mismatch would affect Sox6 and Rod1 genes, which are important in the etiology of several cancers [49]. A number of studies investigating the association between rs3746444 and cancer risk have found that this SNP has distinct effects on different populations and cancer types. Dai et al. found that rs3746444 may be related to increased risk of BC under the allelic contrast, homozygote, and recessive models [47]. Our meta-analysis, assessing seven studies with 4,019 cases and 4,683 controls, showed that carriers of the rs3746444 GG genotype and GG + GA genotypes are at a significantly increased risk of developing BC when compared with those carrying the AA genotype. Also, Asians and hospital-based control subgroups demonstrated a significant association with increased risk of BC under all genetic models, but no significant association was found for Caucasians and for population-based source of control under any model. Thus, our results suggest oncogenic mechanisms are distinctly influenced by specific genetic backgrounds across populations.
Although the studies included in our meta-analysis differed from one another in numerous aspects, sensitivity analysis of miR-146a rs2710164, miR-196a2 rs11614913, and miR-499 rs3746444 indicated that the associations detected were not driven by any single one. Moreover, no publication bias was identified with either Begg’s funnel plot or Egger’s regression test. Finally, no limitations were imposed on our literature search, thus selection bias was well controlled.
Nevertheless, some limitations in this meta-analysis are noteworthy. Firstly, the number of included studies for the miR-499 rs3746444 polymorphism was limited. Secondly, there exists a certain degree of heterogeneity in some genetic models of rs2710164, rs11614913 and rs3746444. After subgroup analysis stratified by race, it could be established that heterogeneity was significantly reduced for Asians in some genetic models of rs11614913 and in all the genetic models of rs3746444. Thus, it could be assumed that the observed heterogeneity resulted, at least in part, from racial differences, which may have impacted the results of our study.
In conclusion, our results indicated that the rs2910164 (G > C) polymorphism in miR-146a may not be associated with susceptibility to BC; the rs11614913 (C > T) polymorphism in miR-196a2 is significantly associated with decreased BC risk; and the rs3746444 (A > G) polymorphism in miR-499 is associated with increased BC risk, especially in Asians. Thus, rs11614913(C > T) and rs3746444 (A > G) appear to be both promising biomarkers to forecast BC risk and potential therapeutic targets. However, owing to the limitations mentioned above, these results should be treated with caution. To further verify and confirm these findings, well-designed, large scale case–control studies will be required.
MATERIALS AND METHODS
Search strategy and selection criteria
This meta-analysis was performed in accordance with the Preferred Reporting Items for Systematic Reviews and Meta-Analyses (PRISMA) statement [50]. To identify all published studies addressing the relationship between miRNA polymorphisms and BC risk, PubMed and Embase databases (last updated on July 20, 2016) were searched without publication type or date restrictions using the following keywords: breast cancer/carcinoma, miR-146a/rs2910164, miR-196a2/rs11614913, miR-499/rs3746444, and polymorphism/SNP/variation. The literature search was limited to English articles. We selected all potentially eligible studies for review.
Study selection and data extraction
All the included studies were selected following the Strengthening the Reporting of Observational Studies in Epidemiology (STROBE) guidelines [51]. Eligible studies met the following criteria: (1) assessed the relationship between miR-146a/-196a2/-499 polymorphisms and BC risk; (2) had a case-control design; (3) addressed histologically confirmed BC; (4) had sufficient genotype data for further calculating odds ratios (ORs) and their 95% confidence intervals (95% CIs); (5) met Hardy-Weinberg equilibrium (HWE) in the control group (P > 0.05). Exclusion criteria included: (1) duplications of previous publications; (2) comments, meeting reports, reviews or editorials; (3) family-based studies of pedigrees; (4) studies with no detailed genotype data. When there were multiple publications from the same population, only the largest study was included. Study selection was done by two investigators independently, by screening the title, abstract and full-text. Any dispute was settled by discussion.
Data from eligible studies were extracted in duplicate by two investigators independently (Mu and Guo). Extracted data included author, year, country, race, genotyping method, source of control, genetic models of cases and controls, and P value for HWE (Table 1). These two authors checked the extracted data and approved it by consensus. If dissent existed, an additional investigator (Liu) would intervene to settle the disagreement. The quality of selected studies was assessed by two or more investigators independently, according to the Newcastle-Ottawa Scale (NOS) criteria [52]. As per the latter, studies must ascertain or include: cases with independent validation (NOS01); representativeness of the cases (NOS02); selection of controls from community controls (NOS03); controls with no history of disease (endpoint) (NOS04); appropriate study controls for the most important study factor (NOS05); study controls for any additional factor (NOS06); secure record (NOS07); structured interview where interviewer is blind to case/control status (NOS08); same method of ascertaining exposure for cases and controls (NOS09); same non-response rate for both groups (NOS10). The maximum NOS score is 10 points, and studies scoring 6 or higher were included in the meta-analysis.
Statistical analysis
We calculated the P value of HWE in the control group using an online tool (http://ihg.gsf.de/cgi-bin/hw/hwa1.pl). The departure from HWE of SNP frequencies in the control group was assessed by X2 test, and a P value < 0.05 was regarded as significant. Odds ratios (ORs) and 95% confidence intervals (CIs) were obtained to evaluate the strength of the association between miR-146a/-196a2/-499 SNPs and susceptibility to BC. Pooled ORs were determined for the allelic contrast model (miR-146a: C vs G, miR-196a2: T vs C, miR-499: G vs A), homozygote model (miR-146a: CC vs GG, miR-196a2: TT vs CC, miR-499: GG vs AA), heterozygote model (miR-146a: GC vs GG, miR-196a2: TC vs CC, miR-499: AG versus AA), dominant model (miR-146a: CC + GC vs GG, miR-196a2: TT + TC vs CC, GG + AG vs AA), and recessive model (miR-146a: CC vs CG + GG, miR-196a2: TT vs TC + CC, miR-499:GG vs AG + AA). The statistical significance of the pooled OR was evaluated by Z test and a P value of < 0.05 was regarded as significant. Inter-study heterogeneity was tested using a X2-based Q-test (with significance level P < 0.1) and I2 statistic (with values greater than 50% indicating significant heterogeneity) [53]. According to the result of the heterogeneity test, the random model was chosen to assess OR and 95% CI when P < 0.05; conversely, the fixed model was selected when P > 0.05. Subgroup analysis was performed by race, source of control, and sample size. Sensitivity analysis was performed to evaluate the effect of each study on the combined ORs by omitting individual studies one at a time. Publication bias was checked by Begg’s funnel plots [54] and Egger’s regression test [55]. An asymmetric plot and a P < 0.05 for the Egger’s test denoted a noteworthy publication bias. The trim-and-fill computation was used to estimate the effect of publication bias on the interpretation of the results [56]. Statistical analysis was conducted utilizing Stata12.0 Software.
Authors‘ contributions
K.M., W.G. and L.J.W. designed the study. J.P.Y., H.Z. and J.T.L. collated the data, designed and developed the database, carried out data analyses and produced the initial draft of the manuscript. Z.Z.W., N.W. and J.Z. contributed to drafting the manuscript. All authors have read and approved the final submitted manuscript.
ACKNOWLEDGMENTS
We acknowledge the reviewers for their helpful comments on this paper.
CONFLICTS OF INTEREST
All authors declare no conflicts of interest.
FUNDING
This study was supported by National Key Scientific and Technological Project of China (NO. 2015BAI12B15) and Scientific and Technological Project of Tianjin, China (NO.13ZCZCSY20300).
REFERENCES
1. Wightman B, Ha I, Ruvkun G. Posttranscriptional regulation of the heterochronic gene lin-14 by lin-4 mediates temporal pattern formation in C. elegans. Cell. 1993; 75:855–62.
2. Kong YW, Ferland-McCollough D, Jackson TJ, Bushell M. microRNAs in cancer management. Lancet Oncol. 2012; 13:e249–58.
3. Filipowicz W, Bhattacharyya SN, Sonenberg N. Mechanisms of post-transcriptional regulation by microRNAs: are the answers in sight? Nat Rev Genet. 2008; 9:102–14.
4. Bartel DP. MicroRNAs: target recognition and regulatory functions. Cell. 2009; 136:215–33.
5. Pritchard CC, Cheng HH, Tewari M. MicroRNA profiling: approaches and considerations. Nat Rev Genet. 2012; 13:358–69.
6. Calin GA, Croce CM. MicroRNA signatures in human cancers. Nat Rev Cancer. 2006; 6:857–66.
7. Jiang Y, Chen J, Wu J, Hu Z, Qin Z, Liu X, Guan X, Wang Y, Han J, Jiang T, Jin G, Zhang M, Ma H, et al. Evaluation of genetic variants in microRNA biosynthesis genes and risk of breast cancer in Chinese women. Int J Cancer. 2013; 133:2216–24.
8. Garzon R, Marcucci G, Croce CM. Targeting microRNAs in cancer: rationale, strategies and challenges. Nat Rev Drug Discov. 2010; 9:775–89.
9. Chae YS, Kim JG, Sohn SK, Kang BW, Lee SJ, Seo J. Genetic polymorphism in the miR-196a as a prognostic biomarker for early breast cancer. Journal of Clinical Oncology. 2014; 32.
10. Chen C, Yang S, Chaugai S, Wang Y, Wang DW. Meta-analysis of Hsa-mir-499 polymorphism (rs3746444) for cancer risk: Evidence from 31 case-control studies. BMC Medical Genetics. 2014; 15.
11. Ryan BM, Robles AI, Harris CC. Genetic variation in microRNA networks: the implications for cancer research. Nat Rev Cancer. 2010; 10:389–402.
12. Bansal C, Sharma KL, Misra S, Srivastava AN, Mittal B, Singh US. Common genetic variants in pre-microRNAs and risk of breast cancer in the North Indian population. Ecancermedicalscience. 2014; 8.
13. He B, Pan Y, Xu Y, Deng Q, Sun H, Gao T, Wang S. Associations of polymorphisms in microRNAs with female breast cancer risk in Chinese population. Tumour Biol. 2015; 36:4575–82.
14. Catucci I, Yang R, Verderio P, Pizzamiglio S, Heesen L, Hemminki K, Sutter C, Wappenschmidt B, Dick M, Arnold N, Bugert P, Niederacher D, Meindl A, et al. Evaluation of SNPs in miR-146a, miR196a2 and miR-499 as low- penetrance alleles in German and Italian familial breast cancer cases. Hum Mutat. 2010; 31:E1052–7.
15. Zorena K, Malinowska E, Raczynska D, Mysliwiec M, Raczynska K. Serum concentrations of transforming growth factor-Beta 1 in predicting the occurrence of diabetic retinopathy in juvenile patients with type 1 diabetes mellitus. J Diabetes Res. 2013; 2013.
16. Pollard JA, Burns PA, Hughes TA, Mukherjee G, Jones JL, Ho-Yen C, Omoniyi Esan GO, Titloye NA, Shaaban AM, Speirs V. Differential expression of microRNAs in breast cancers from four different ethnicities. Journal of Pathology. 2013; 231.
17. McVeigh TP, Owens PW, Mulligan R, Guerin C, Miller N, Sebag F, Quill D, Bell M, Lowery AJ, Weidhaas JB, Kerin MJ. Investigating the role of polymorphism rs2910164 in MiR146a in cancer predisposition. Thyroid. 2015; 25.
18. Mulligan RJ, McVeigh TP, Sweeney KJ, Weidhaas JB, Miller N, Kerin MJ. Investigating the role of microrna-associated single nucleotide polymorphisms in breast cancer. Irish Journal of Medical Science. 2015; 184.
19. Esteban Cardenosa E, de Juan Jimenez I, Palanca Suela S, Chirivella Gonzalez I, Segura Huerta A, Santaballa Beltran A, Casals El Busto M, Barragan Gonzalez E, Fuster Lluch O, Bermudez Edo J, Bolufer Gilabert P. Low penetrance alleles as risk modifiers in familial and sporadic breast cancer. Fam Cancer. 2012; 11:629–36.
20. Mehskat M, Tanha HM, Naeini MM, Ghaedi K, Sanati MH, Meshkat M, Bagheri F. Functional SNP in stem of mir-146a affect Her2 status and breast cancer survival. Cancer Biomark. 2016; 17:213–22.
21. Garcia AI, Buisson M, Bertrand P, Rimokh R, Rouleau E, Lopez BS, Lidereau R, Mikaelian I, Mazoyer S. Down-regulation of BRCA1 expression by miR-146a and miR-146b-5p in triple negative sporadic breast cancers. EMBO Mol Med. 2011; 3:279–90.
22. Zhao H, Xu J, Zhao D, Geng M, Ge H, Fu L, Zhu Z. Somatic Mutation of the SNP rs11614913 and Its Association with Increased MIR 196A2 Expression in Breast Cancer. DNA Cell Biol. 2016; 35:81–7.
23. Nicoloso MS, Sun H, Spizzo R, Kim H, Wickramasinghe P, Shimizu M, Wojcik SE, Ferdin J, Kunej T, Xiao L, Manoukian S, Secreto G, Ravagnani F, et al. Single-nucleotide polymorphisms inside microRNA target sites influence tumor susceptibility. Cancer Res. 2010; 70:2789–98.
24. Alshatwi AA, Shafi G, Hasan TN, Syed NA, Al-Hazzani AA, Alsaif MA, Alsaif AA. Differential expression profile and genetic variants of microRNAs sequences in breast cancer patients. PLoS One. 2012; 7:e30049.
25. Pastrello C, Polesel J, Della Puppa L, Viel A, Maestro R. Association between hsa-mir-146a genotype and tumor age-of-onset in BRCA1/BRCA2-negative familial breast and ovarian cancer patients. Carcinogenesis. 2010; 31:2124–6.
26. Upadhyaya A, Smith RA, Chacon-Cortes D, Revechon G, Bellis C, Lea RA, Haupt LM, Chambers SK, Youl PH, Griffiths LR. Association of the microRNA-Single Nucleotide Polymorphism rs2910164 in miR146a with sporadic breast cancer susceptibility: A case control study. Gene. 2016; 576:256–60.
27. Hoffman AE, Zheng T, Yi C, Leaderer D, Weidhaas J, Slack F, Zhang Y, Paranjape T, Zhu Y. microRNA miR-196a-2 and breast cancer: a genetic and epigenetic association study and functional analysis. Cancer Res. 2009; 69:5970–7.
28. Hu Z, Liang J, Wang Z, Tian T, Zhou X, Chen J, Miao R, Wang Y, Wang X, Shen H. Common genetic variants in pre-microRNAs were associated with increased risk of breast cancer in Chinese women. Hum Mutat. 2009; 30:79–84.
29. Omrani M, Hashemi M, Eskandari-Nasab E, Hasani SS, Mashhadi MA, Arbabi F, Taheri M. hsa-mir-499 rs3746444 gene polymorphism is associated with susceptibility to breast cancer in an Iranian population. Biomark Med. 2014; 8:259–67.
30. Qi P, Wang L, Zhou B, Yao WJ, Xu S, Zhou Y, Xie ZB. Associations of miRNA polymorphisms and expression levels with breast cancer risk in the Chinese population. Genet Mol Res. 2015; 14:6289–96.
31. Jedlinski DJ, Gabrovska PN, Weinstein SR, Smith RA, Griffiths LR. Single nucleotide polymorphism in hsa-mir-196a-2 and breast cancer risk: a case control study. Twin Res Hum Genet. 2011; 14:417–21.
32. Linhares JJ, Azevedo M Jr, Siufi AA, de Carvalho CV, Wolgien Mdel C, Noronha EC, Bonetti TC, da Silva ID. Evaluation of single nucleotide polymorphisms in microRNAs (hsa-miR-196a2 rs11614913 C/T) from Brazilian women with breast cancer. BMC Med Genet. 2012; 13.
33. Morales S, Gulppi F, Gonzalez-Hormazabal P, Fernandez-Ramires R, Bravo T, Reyes JM, Gomez F, Waugh E, Jara L. Association of single nucleotide polymorphisms in Pre-miR-27a, Pre-miR-196a2, Pre-miR-423, miR-608 and Pre-miR-618 with breast cancer susceptibility in a South American population. BMC Genet. 2016; 17:109.
34. Zhang M, Jin M, Yu Y, Zhang S, Wu Y, Liu H, Liu H, Chen B, Li Q, Ma X, Chen K. Associations of miRNA polymorphisms and female physiological characteristics with breast cancer risk in Chinese population. Eur J Cancer Care (Engl). 2012; 21:274–80.
35. Dai ZM, Kang HF, Zhang WG, Li HB, Zhang SQ, Ma XB, Lin S, Wang M, Feng YJ, Liu K, Liu XH, Xu P, Dai ZJ. The Associations of Single Nucleotide Polymorphisms in miR196a2, miR-499, and miR-608 With Breast Cancer Susceptibility: A STROBE-Compliant Observational Study. Medicine (Baltimore). 2016; 95:e2826.
36. Garcia AI, Cox DG, Barjhoux L, Verny-Pierre C, Barnes D, Antoniou AC, Stoppa-Lyonnet D, Sinilnikova OM, Mazoyer S. The rs2910164:G>C SNP in the MIR146A gene is not associated with breast cancer risk in BRCA1 and BRCA2 mutation carriers. Hum Mutat. 2011; 32:1004–7.
37. Kang Z, Li Y, He X, Jiu T, Wei J, Tian F, Gu C. Quantitative assessment of the association between miR-196a2 rs11614913 polymorphism and cancer risk: evidence based on 45,816 subjects. Tumour Biol. 2014; 35:6271–82.
38. Bartel DP. MicroRNAs: genomics, biogenesis, mechanism, and function. Cell. 2004; 116:281–97.
39. Murria Estal R, Palanca Suela S, de Juan Jimenez I, Egoavil Rojas C, Garcia-Casado Z, Juan Fita MJ, Sanchez Heras AB, Segura Huerta A, Chirivella Gonzalez I, Sanchez-Izquierdo D, Llop Garcia M, Barragan Gonzalez E, Bolufer Gilabert P. MicroRNA signatures in hereditary breast cancer. Breast Cancer Res Treat. 2013; 142:19–30.
40. Zhang P, Ma F, Xu B. Polymorphisms of microRNA genes and their association with breast cancer risk. [Article in Chinese]. Zhonghua Zhong Liu Za Zhi. 2015; 37:501–7.
41. Akkiz H, Bayram S, Bekar A, Akgollu E, Uskudar O, Sandikci M. No association of pre-microRNA-146a rs2910164 polymorphism and risk of hepatocellular carcinoma development in Turkish population: a case-control study. Gene. 2011; 486:104–9.
42. Ma XP, Zhang T, Peng B, Yu L, Jiang de K. Association between microRNA polymorphisms and cancer risk based on the findings of 66 case-control studies. PLoS One. 2013; 8:e79584.
43. Chen QH, Wang QB, Zhang B. Ethnicity modifies the association between functional microRNA polymorphisms and breast cancer risk: a HuGE meta-analysis. Tumour Biol. 2014; 35:529–43.
44. Wang AX, Xu B, Tong N, Chen SQ, Yang Y, Zhang XW, Jiang H, Liu N, Liu J, Hu XN, Sha GZ, Chen M. Meta-analysis confirms that a common G/C variant in the pre-miR-146a gene contributes to cancer susceptibility and that ethnicity, gender and smoking status are risk factors. Genet Mol Res. 2012; 11:3051–62.
45. Li XD, Li ZG, Song XX, Liu CF. A variant in microRNA-196a2 is associated with susceptibility to hepatocellular carcinoma in Chinese patients with cirrhosis. Pathology. 2010; 42:669–73.
46. Gao LB, Bai P, Pan XM, Jia J, Li LJ, Liang WB, Tang M, Zhang LS, Wei YG, Zhang L. The association between two polymorphisms in pre-miRNAs and breast cancer risk: a meta-analysis. Breast Cancer Res Treat. 2011; 125:571–4.
47. Dai ZJ, Shao YP, Wang XJ, Xu D, Kang HF, Ren HT, Min WL, Lin S, Wang M, Song ZJ. Five common functional polymorphisms in microRNAs (rs2910164, rs2292832, rs11614913, rs3746444, rs895819) and the susceptibility to breast cancer: evidence from 8361 cancer cases and 8504 controls. Curr Pharm Des. 2015; 21:1455–63.
48. Xiang Y, Fan S, Cao J, Huang S, Zhang LP. Association of the microRNA-499 variants with susceptibility to hepatocellular carcinoma in a Chinese population. Mol Biol Rep. 2012; 39:7019–23.
49. Qi P, Dou TH, Geng L, Zhou FG, Gu X, Wang H, Gao CF. Association of a variant in MIR 196A2 with susceptibility to hepatocellular carcinoma in male Chinese patients with chronic hepatitis B virus infection. Hum Immunol. 2010; 71:621–6.
50. Liberati A, Altman DG, Tetzlaff J, Mulrow C, Gotzsche PC, Ioannidis JP, Clarke M, Devereaux PJ, Kleijnen J, Moher D. The PRISMA statement for reporting systematic reviews and meta-analyses of studies that evaluate healthcare interventions: explanation and elaboration. BMJ. 2009; 339.
51. Vandenbroucke JP, von Elm E, Altman DG, Gotzsche PC, Mulrow CD, Pocock SJ, Poole C, Schlesselman JJ, Egger M, Initiative S. Strengthening the Reporting of Observational Studies in Epidemiology (STROBE): explanation and elaboration. Int J Surg. 2014; 12:1500–24.
52. Lo CK, Mertz D, Loeb M. Newcastle-Ottawa Scale: comparing reviewers’ to authors’ assessments. BMC Med Res Methodol. 2014; 14.
53. Higgins JP, Thompson SG. Quantifying heterogeneity in a meta-analysis. Stat Med. 2002; 21:1539–58.
54. Begg CB, Mazumdar M. Operating characteristics of a rank correlation test for publication bias. Biometrics. 1994; 50:1088–101.
55. Egger M, Davey Smith G, Schneider M, Minder C. Bias in meta-analysis detected by a simple, graphical test. BMJ. 1997; 315:629–34.
56. Duval S, Tweedie R. Trim and fill: A simple funnel-plot-based method of testing and adjusting for publication bias in meta-analysis. Biometrics. 2000; 56:455–63.