
INTRODUCTION
Most women diagnosed with stage III-IV ovarian cancer will die from the disease [1]. Although there has been improvement in ovarian cancer survival time, developments in chemotherapy have not contributed to a substantial decrease in deaths from ovarian cancer [2]. Genetic markers that identify women with poor prognosis or who are more likely to respond to specific treatment regimens could help improve outcomes by individualization of therapy. To this end, we recently performed a genome-wide association analysis of ovarian cancer patients treated with chemotherapy. We analyzed European ancestry patients based on their treatment regime and using a threshold of p ≤ 1×10⁻⁵ we found five variants that associated with either progression free survival (PFS) or overall survival (OS): rs4910232 (11p15.3) and rs3795247 (19p12), associated with PFS in patients who had cytoreductive surgery for first-line treatment regardless of chemotherapy type (referred to as the “any chemotherapy” group, n = 4,095); rs6674079 (1q22) associated with OS in the any chemotherapy group (n = 4,426); and rs7950311 (11p15.4) and rs2549714 (16q23) associated with OS in patients known to have received first-line treatment of cytoreductive surgery and ≥4 cycles of paclitaxel and carboplatin intravenously at 3-weekly intervals (referred to as the “standard chemotherapy” group, n = 1,799) [3].
All five variants associated with ovarian cancer patient outcome, and other candidate variants correlated by linkage disequilibrium (r2 > 0.4), are located in non-coding regions of the genome. The potential regulatory targets of these variants are not obvious, especially as functional elements can target genes over 1 Mb away through long-range chromatin interactions [4, 5]. To overcome this barrier and identify target genes, we used available bioinformatic data to prioritize two ovarian cancer outcome loci (1q22 and 19p12) for analysis and performed chromatin conformation capture and other functional genetic approaches to identify variants that regulate gene expression. We also performed further testing of genetic associations using additional Ovarian Cancer Association Consortium (OCAC) patients in a new meta-analysis of patient outcome.
RESULTS
ZNF100 is a potential regulatory target of candidate outcome variants at the 19p12 locus
The five variants associated with ovarian cancer patient outcome and additional candidate outcome variants (correlated by linkage disequilibrium, r2 > 0.4) were assessed for effects on gene expression using publicly available data. In The Cancer Genome Atlas (TCGA) study of ovarian tumor samples (n = 386), no candidate outcome variants significantly associated with expression of genes located within 1 Mb of the lead variant (Bonferroni threshold p < 0.00016), although significant associations were observed between gene expression and variants that were not correlated with the lead outcome variants (Supplementary File 1). Analysis of normal ovarian samples (n = 85) from the Genotype-Tissue Expression (GTEx) Project [6], indicated that minor alleles of 13 candidate variants at the 19p12 locus associated with increased ZNF100 expression after false discovery rate correction (q < 0.05, p < 1×10⁻⁵; Supplementary Table 1). No candidate variants at the other outcome loci significantly associated with gene expression (q < 0.05).
To determine if candidate variants at 19p12 interact with the ZNF100 promoter region through long-range chromatin interactions, we performed chromatin conformation capture (3C) analyses in COV362 and OVCAR8 ovarian cancer cell lines. These cell lines were prioritized for study based on ZNF100 expression in serous ovarian cancer cell lines (Supplementary Figure 1). Through 3C analysis across this outcome-associated locus, we identified two peaks of interaction, both containing candidate outcome variants (Figure 1).
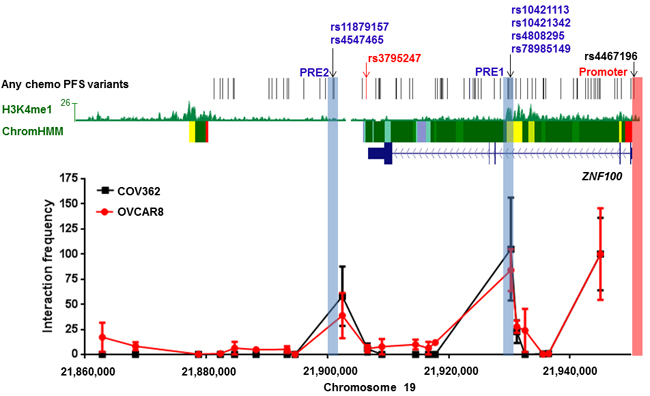
Figure 1: Two regions containing candidate all chemo PFS candidate variants interact with the ZNF100 promoter in ovarian cancer cell lines at the 19p12 outcome locus. The figure shows 3C analyses of interactions between HindIII fragments and the ZNF100 promoter region (highlighted in pink) in COV362 and OVCAR8 cells. For each cell line, interaction frequencies were normalised to those of the fragment proximal to the promoter. Interaction frequencies from three independent biological replicates are shown (error bars represent standard error of the mean). The original variant associated with any chemotherapy PFS, rs3795247, is shown with correlated candidate outcome variants (r2 > 0.4) in black. Roadmap Consortium chromatin state segmentation for normal ovarian tissue using a Hidden Markov Model (Chrom HMM) is shown (red = active transcription start sites, dark green = weak transcription, green = strong transcription, green/yellow = genic enhancers, yellow = enhancers, aquamarine = ZNF gene repeats and turquoise = heterochromatin). H3K4Me1 modification in normal ovarian tissue is also indicated. Putative Regulatory Elements (PREs), and their coincident candidate variants, cloned into reporter gene constructs are highlighted in blue.
Putative regulatory elements (PREs) modulate ZNF100 promoter activity
The two chromatin interacting regions have the potential to regulate ZNF100 promoter activity. Functionality at the region most frequently interacting with the ZNF100 promoter was further indicated by the presence, in normal ovary, of H3K4me1 histone modification (associated with enhancers) and an enhancer predicted by chromatin state segmentation (Figure 1). We defined the part of the interacting region marked by H3K4me1 and the predicted enhancer as ZNF100 putative regulatory element (PRE1) (Figure 1). We cloned ZNF100 PRE1, containing four candidate variants into a reporter gene construct containing the ZNF100 promoter. A variant ZNF100 promoter construct containing the minor allele of the rs4467196 candidate variant was also generated but this variant did not significantly affect promoter activity (p > 0.05, Supplementary Figure 2) and, thus, we used the promoter construct carrying the common allele for the luciferase analysis of PREs. The reference ZNF100 PRE1 construct (containing the major alleles of the candidate variants) enhanced activity 1.25-1.43 fold over the construct containing the ZNF100 promoter alone in OVCAR8 and COV362 cells (Figure 2A-2D). Two candidate variants in ZNF100 PRE1 affected ZNF100 promoter activity in OVCAR8 cells: the minor allele of rs10421113 increased promoter activity by 1.15 fold (p = 0.007; Figure 2A); and the minor allele of rs10421342 reduced activity by 1.10 fold (p = 0.04; Figure 2A). However, candidate variants did not affect promoter activity in COV362 cells (Figure 2B), nor did haplotypes containing these alleles have significant effects in either cell line (Figure 2C-2D).
At the second promoter-interacting region (Figure 1), one of the candidate variants (rs4547465) associated with ZNF100 expression in ovarian tissue (Supplementary Table 1) and, thus, we cloned a region (ZNF100 PRE2; Figure 1) containing rs4547465 and a neighboring candidate variant (rs11879157) into the reporter gene construct containing the ZNF100 promoter. The reference ZNF100 PRE2 increased promoter activity 1.23 fold in OVCAR8 cells (Figure 2E), but had no significant effect in COV362 cells (Figure 2F). None of the candidate variants affected ZNF100 PRE2 activity in either cell line (Figure 2E-2F).
The two potentially functional candidate variants in ZNF100 PRE1, rs10421113 and rs10421342, were amenable to allele-specific 3C analysis in OVCAR8 cells due to their heterozygosity and proximity to a HindIII restriction site used in the 3C analysis. PCR-based Sanger sequencing indicated that the major (G) alleles of rs10421113 and rs10421342 are located in a region that preferentially interacts with the ZNF100 promoter region in OVCAR8 cells (Figure 3). Notably, the minor (A) allele of rs10421113 weakens several binding motifs of CTCF (Supplementary Table 2), a transcription factor that is required for cell type-specific chromatin interactions [7]. Allele-specific 3C analysis of ZNF100 PRE1 could not be performed in COV362 cells as this cell line was not heterozygous for rs10421113 and rs10421342. Allele-specific 3C analysis also could not be performed for ZNF100 PRE2 as an amenable heterozygous candidate variant was not found in either OVCAR8 or COV362 cells.
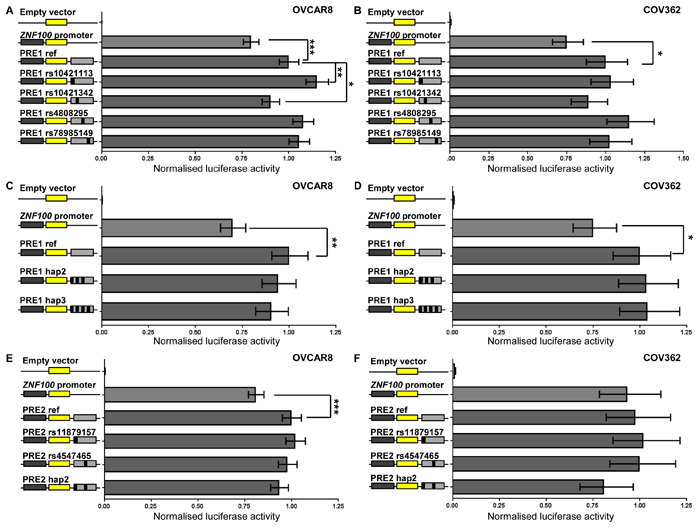
Figure 2: ZNF100 PRE1 and PRE2 enhance promoter activity in OVCAR8 cells. ZNF100 PRE1 and PRE2 regions containing the major alleles of candidate outcome variants were cloned downstream of a ZNF100-promoter-driven luciferase construct (ZNF100 promoter in figure) for the creation of reference (PRE1 ref and PRE2 ref) constructs. Minor allelic variants of the outcome variants were engineered into constructs and are designated by the rs ID of the corresponding variant and a black box in the construct schematic. Constructs containing haplotypic variants occurring in Europeans were also generated: PRE1 hap2 (minor allelic variants of all candidate variants except for rs4808295; 10% frequency in Europeans) and PRE1 hap3 (all minor allelic variants; 4% frequency in Europeans); and PRE2 hap2 (all minor allelic variants). Cells were transiently transfected with each of these constructs and assayed for luciferase activity after 24 h. Back-transformed data are shown and error bars denote 95% confidence intervals of experiments performed in triplicate for OVCAR8 cells and in quadruplicate for COV362 cells. P-values were determined by two-way ANOVA followed by Dunnett’s multiple comparisons test (*p < 0.05, **p < 0.01 and ***p < 0.001).
Candidate variants in an ovarian super-enhancer at 1q22 modify MEF2D promoter activity
Super-enhancers are dense clusters of enhancers and have been found to be enriched for disease associated variants in previous studies [8, 9]. We interrogated a catalogue of super-enhancers across 86 human cell and tissue types [9] and found candidate variants at the 1q22 outcome locus were coincident with super-enhancers present in multiple tissues (Supplementary Table 3), including normal ovary (Figure 4). A region containing four candidate outcome variants and substantial levels of H3K4Me1 in normal ovary was defined as MEF2D PRE1 (Figure 4). Three of these candidate outcome variants were also coincident with the ovarian super-enhancer which was predicted by the catalogue to regulate MEF2D through pairing of the super-enhancer with the nearest expressed gene in normal ovary [9]. Queries of GTEx eQTL data, indicated that the minor allele of one of MEF2D PRE1 candidate variants, rs11264489, was nominally associated (p = 0.032) with lower MEF2D expression in ovarian tissue (Supplementary Table 4). The three MEF2D PRE1 candidate variants in the ovarian super-enhancer were also located within RP11-284F21.8, a long non-coding RNA (lncRNA). Notably, lncRNAs are often associated with enhancer regions [10].
A multi-tissue super-enhancer region containing candidate outcome variants was observed near the 3’ end of IQGAP3 at 1q22 (Figure 4). In particular, two candidate outcome variants adjacent to the 3’ end of IQGAP3, rs947661 and rs7550381, coincided with super-enhancers from 17 tissues, 16 of which were predicted to target MEF2D (Supplementary Table 3). This region was defined as PRE2. To further explore the potential target of these two variants, GTEx eQTL data for normal ovarian tissue were queried and nominally significant (p≤0.015; Supplementary Table 4) associations were observed between lower MEF2D expression and the minor alleles of both variants, but not with expression of the neighboring IQGAP3 gene.
Table 1: Meta-analysis of 1q22 and 19p12 loci for genetic association with survival outcomes in ovarian cancer patients
Variant |
Position (hg19) |
OS any chemotherapy (n=6,160) |
OS standard chemotherapy (n=2,620) |
PFS any chemotherapy (n=5,596) |
PFS standard chemotherapy (n=2,352) |
||||||
Effect allele/ Ref allele |
EAF§ |
HR (95% CI) |
P |
HR (95% CI) |
P |
HR (95% CI) |
P |
HR (95% CI) |
P |
||
1q22 region |
|||||||||||
rs6674079* |
156486061 |
A/G |
0.60 |
0.93 (0.88-0.98) |
0.010 |
0.95 (0.88-1.04) |
0.257 |
0.98 (0.93-1.03) |
0.398 |
1.00 (0.93-1.08) |
0.918 |
rs11264494¶ |
156493398 |
C/T |
0.51 |
0.91 (0.86-0.96) |
2.6×10⁻⁴ |
0.91 (0.84-0.99) |
0.023 |
0.92 (0.88-0.97) |
0.001 |
0.92 (0.86-0.99) |
0.024 |
rs2274500¶ |
156850112 |
G/T |
0.86 |
1.09 (0.98-1.21) |
0.110 |
1.24 (1.06-1.45) |
0.007 |
1.05 (0.95-1.16) |
0.312 |
1.16 (1.00-1.35) |
0.047 |
rs60989774¶ |
156513579 |
CT/C |
0.38 |
1.08 (1.02-1.14) |
0.006 |
1.08 (1.00-1.18) |
0.061 |
1.11 (1.05-1.17) |
8.0×10⁻⁴ |
1.11 (1.02-1.20) |
0.011 |
rs59359496¶ |
156501450 |
T/G |
0.08 |
1.04 (0.95-1.14) |
0.422 |
1.07 (0.93-1.23) |
0.340 |
1.13 (1.03-1.23) |
0.007 |
1.21 (1.07-1.38) |
0.003 |
rs947661# |
156494916 |
A/G |
0.36 |
1.10 (1.04-1.16) |
8.2×10⁻⁴ |
1.09 (1.00-1.19) |
0.050 |
1.04 (0.99-1.10) |
0.118 |
1.04 (0.96-1.12) |
0.367 |
rs10159180# |
156480324 |
C/T |
0.46 |
0.92 (0.87-0.97) |
0.001 |
0.93 (0.86-1.01) |
0.089 |
0.94 (0.89-0.98) |
0.007 |
0.95 (0.88-1.02) |
0.176 |
rs942964# |
156481707 |
A/G |
0.54 |
1.09 (1.03-1.15) |
0.001 |
1.07 (0.99-1.16) |
0.097 |
1.07 (1.02-1.12) |
0.010 |
1.05 (0.98-1.13) |
0.178 |
rs11264488# |
156480288 |
C/G |
0.56 |
1.08 (1.03-1.14) |
0.004 |
1.05 (0.97-1.14) |
0.194 |
1.07 (1.02-1.13) |
0.005 |
1.05 (0.98-1.13) |
0.171 |
rs11264489# |
156480831 |
A/G |
0.60 |
0.92 (0.87-0.97) |
0.004 |
0.95 (0.87-1.03) |
0.194 |
0.98 (0.93-1.03) |
0.365 |
1.00 (0.93-1.08) |
0.990 |
rs7550381# |
156495001 |
A/G |
0.60 |
0.92 (0.87-0.97) |
0.004 |
0.94 (0.87-1.03) |
0.181 |
0.96 (0.92-1.01) |
0.156 |
0.98 (0.91-1.06) |
0.604 |
19p12 region |
|||||||||||
rs3795247* |
21906428 |
T/C |
0.90 |
0.90 (0.82-0.98) |
0.021 |
0.80 (0.69-0.93) |
0.003 |
0.89 (0.82-0.97) |
0.007 |
0.83 (0.73-0.95) |
0.009 |
rs79447188¶ |
22405414 |
T/C |
0.03 |
1.20-(1.05-1.37) |
0.006 |
1.26 (1.03-1.55) |
0.024 |
1.13 (1.00-1.28) |
0.044 |
1.10 (0.90-1.34) |
0.342 |
rs4330044¶ |
21905838 |
T/C |
0.10 |
1.12 (1.02-1.22) |
0.021 |
1.25 (1.08-1.44) |
0.003 |
1.13 (1.03-1.23) |
0.007 |
1.20 (1.05-1.38) |
0.009 |
rs35308521¶ |
21932095 |
G/GA |
0.11 |
1.12 (1.02-1.23) |
0.015 |
1.24 (1.08-1.43) |
0.003 |
1.14 (1.05-1.25) |
0.002 |
1.21 (1.06-1.38) |
0.005 |
rs12463030¶ |
21947607 |
T/C |
0.95 |
0.88 (0.76-1.01) |
0.071 |
0.76 (0.60-0.95) |
0.016 |
0.85 (0.74-0.97) |
0.015 |
0.72 (0.58-0.89) |
0.002 |
rs10421113# |
21929885 |
T/C |
0.83 |
1.02 (0.95-1.10) |
0.575 |
1.11 (0.99-1.24) |
0.065 |
1.04 (0.98-1.11) |
0.227 |
1.11 (1.00-1.23) |
0.047 |
rs10421342# |
21930003 |
T/C |
0.83 |
1.02 (0.95-1.10) |
0.575 |
1.11 (0.99-1.24) |
0.065 |
1.04 (0.98-1.11) |
0.227 |
1.11 (1.00-1.23) |
0.047 |
§Effect allele frequency based on samples from the OncoArray study.
*Lead outcome variant in our original study [3].
¶Lead outcome variant with a survival phenotype in the new meta-analysis.
#Functional candidate variant.
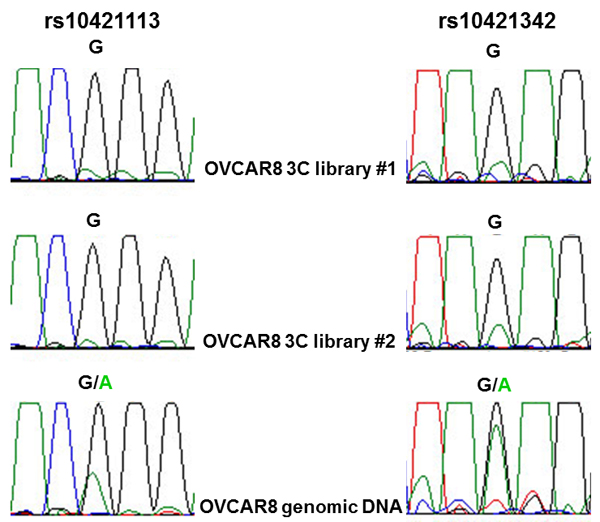
Figure 3: Allele-specific interaction between ZNF100 PRE1 and ZNF100 promoter region. OVCAR8 cells are heterozygous for rs10421113 and rs10421342 candidate outcome variants. Allele-specific 3C analysis using PCR-based Sanger sequencing of two independent 3C libraries indicates that sequence containing the major G allele of both variants preferentially interacts with the ZNF100 promoter.
The MEF2D promoter was too close to the candidate outcome variants for analysis of DNA chromatin interactions by 3C but the super-enhancer and GTEx eQTL data suggested that MEF2D is a regulatory target. To examine the effects of variants on activity of the MEF2D promoter, we tested the effects of the four candidate outcome variants in MEF2D PRE1 on promoter activity in OVCAR8 and JAM cells, the two ovarian cancer cell lines in which MEF2D was most highly expressed (Supplementary Figure 1). The reference MEF2D PRE1 construct, containing the most common European haplotype (1000 Genomes Project) of the four candidate variants, acted as an enhancer of promoter activity. Compared with a reporter gene construct containing the MEF2D promoter alone, the reference MEF2D PRE1 increased MEF2D promoter activity by 2.2-2.9 fold in OVCAR8 and JAM cells (Figure 5A-5B). In OVCAR8 cells, candidate variants did not individually show an effect but a haplotype (MEF2D PRE1 hap2) containing the alternate alleles of the variants in the reference construct had 1.21 fold (p = 0.03) greater activity than the reference MEF2D PRE1 (Figure 5A). It appears that the alternate (C) allele of rs11264488 is necessary for the haplotype effect as MEF2D PRE1 hap3, which does not contain this allele, has no effect on the PRE activity. Furthermore, this allele weakens the binding motif of FOXP1 (Supplementary Table 2), a transcriptional repressor [11] that appears to act as an oncogene in ovarian cancer [12]. In JAM cells, none of the candidate variants, or their haplotypes, affected MEF2D promoter activity (Figure 5B). MEF2D PRE2 also acted as an enhancer and increased MEF2D promoter activity 2.5-2.8 fold in OVCAR8 and JAM cells (Figure 5C-5D). The MEF2D PRE2 candidate variants, rs7550381 and rs947661, had no effect in OVCAR8 cells (Figure 5C), but in JAM cells their minor alleles were associated with 17% (p = 0.03) and 19% (p = 0.01), greater MEF2D PRE2 activity, respectively (Figure 5D). Notably, the minor allele (A) of rs7550381 strengthened two binding motifs of CTCF (Supplementary Table 2). The effect of these alleles appeared to be additive as the haplotype containing both (MEF2D PRE2 hap2) had 38% (p = 0.0002) greater activity (Figure 5D). We also cloned the promoter of the RP11-284F21.8 lncRNA into the MEF2D PRE1 and MEF2D PRE2 constructs to assess its effects but measurable levels of RP11-284F21.8 promoter activity were not detected (data not shown).
MEF2D and ZNF100 expression is associated with poorer ovarian cancer outcome
The Kaplan-Meier plotter (KM-plot) web-based application [13] was used to assess associations between MEF2D and ZNF100 expression and outcome using data available from serous ovarian cancer patients. For MEF2D, no significant associations with OS were observed using data from three different probe sets (n = 453-1138; Supplementary Figure 3), but higher expression associated (p<0.05) with shorter PFS and the associations observed from the two probe sets with the largest number of samples (n = 1019) also passed a false discovery rate correction (q < 0.05) (Supplementary Figure 4). For ZNF100, higher expression was significantly associated with shorter OS (p = 0.013, q = 0.035; n = 453) but no association was observed with PFS (n = 397) (Supplementary Figure 5).
Analysis of 1q22 and 19p12 outcome loci using a denser genotyping platform and additional patients
To refine the genetic associations at the 1q22 and 19p12 outcome loci, we analyzed 1 Mb regions encompassing both lead variants using a denser genotyping platform (OncoArray [14]) than had been previously applied to the OCAC patient set [3]. Additionally, to perform analyses in the largest possible number of patients, we meta-analyzed data in an expanded patient set that included patients from our previous study [3]. After quality control and data cleaning, the following numbers of patients were included in meta-analysis: for OS, 6,160 with any chemotherapy (N = 4,426 previously [3]), 2,620 with standard chemotherapy (N = 1,799 previously [3]); for PFS, 5,596 with any chemotherapy (N = 4,095 previously [3]) and 2,352 with standard chemotherapy (N = 1,958 previously [3]). However, none of the associations tested reached our previous threshold for significance (p < 1.0×10⁻⁵ [3]) in any analysis (Table 1).
At 1q22, the previous lead variant, rs6674079, was only nominally significant for association with OS among patients with any chemotherapy: p = 0.01 (Table 1) versus p = 7.1x10⁻⁶ previously; the strongest nominal association at this locus for this group was with rs11264494 (p = 2.6x10⁻⁴, Table 1). Of the candidate variants in haplotypes with functional effects on MEF2D promoter activity, the strongest association was observed between PRE2 variant rs947661 and any chemotherapy OS (p = 8.2x10⁻⁴; Table 1). Other candidate variants from functional haplotypes also nominally associated with OS and PFS among patients treated with any chemotherapy, but no variant at 1q22 passed our significance threshold of p < 1x10⁻⁵ (Table 1). Linkage disequilibrium was observed between the previous lead candidate, rs6674079, and rs11264494 (r2 = 0.33 in Europeans) and also between rs11264494 and candidate variants from the haplotypes with functional effects on MEF2D promoter activity (r2 = 0.33-0.79).
At 19p12, the association of the previous lead variant, rs3795247, with any chemotherapy PFS also lost significance: p = 0.007 versus p = 1.05x10⁻⁵ previously (Table 1). The strongest nominal association at this locus was between rs35308521 and any chemotherapy PFS (p = 0.002, Table 1). For the two candidate variants that correlated with the allele-specific chromatin interaction with the ZNF100 promoter region, nominal associations with outcome were observed only in the standard chemotherapy PFS analysis (Table 1). Linkage disequilibrium was observed between the previous lead candidate, rs3795247, and rs35308521 (r2 = 0.89) and between rs35308521 and the two variants that correlated with allele-specific looping with the ZNF100 promoter region (r2 = 0.47).
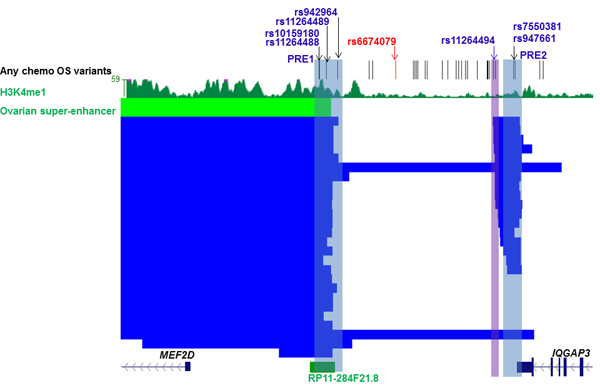
Figure 4: Candidate outcome variants at 1q22 are coincident with an ovarian super-enhancer that is predicted to target MEF2D. The figure shows candidate outcome variants, H3K4Me1 modification in normal ovarian tissue and super-enhancers (ovarian super-enhancer is colored green and super-enhancers from other tissues blue) at the 1q22 ovarian outcome locus that are predicted to target MEF2D (Supplementary Table 3). Putative Regulatory Elements (PREs), and their coincident candidate variants, cloned into reporter gene constructs are highlighted in blue. The original lead variant associated with any chemotherapy OS, rs6674079, is shown with correlated candidate outcome variants (r2 > 0.4) in black and the lead variant from the new OncoArray analysis with all chemotherapy OS, rs11264494, in blue (region cloned into reporter gene constructs highlighted in purple).
rs11264494 does not affect MEF2D promoter activity
Based on the results from the new genetic analysis, the variant with the strongest nominal association with outcome at either locus was rs11264494, located near the MEF2D PRE2 and proximal to several MEF2D super-enhancers (Figure 4). A region containing this variant was cloned in the luciferase reporter construct containing the MEF2D promoter. The region containing the (C) allele of rs11264494 enhanced MEF2D promoter activity 2.4-fold in OVCAR8 and 3.6-fold in JAM cells, but the T allelic variant of this SNP did not significantly affect this enhancer activity (Figure 5E-5F).
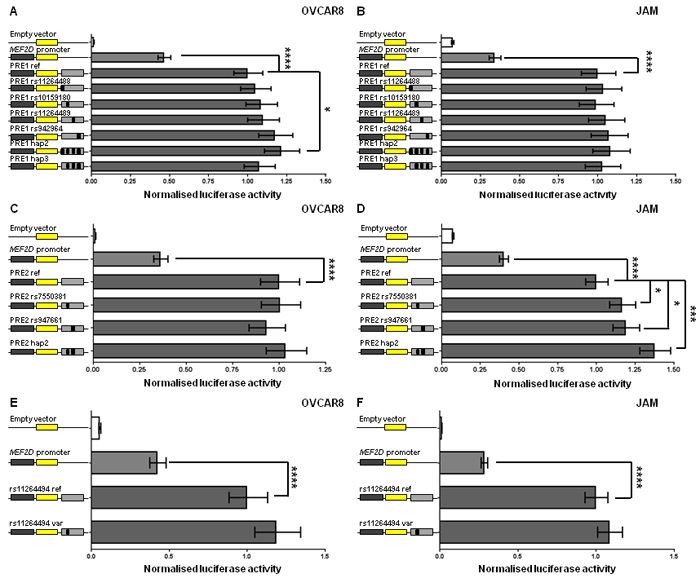
Figure 5: MEF2D regulatory regions act as enhancers and candidate outcome variants increase MEF2D PRE1 and PRE2 activity. Putative MEF2D regulatory regions containing candidate outcome variants were cloned downstream of a MEF2D-promoter-driven luciferase construct (MEF2D promoter in figure). The reference PRE1, PRE2 and rs11264494 constructs contain the most common haplotypes or alleles in Europeans. Alternative alleles of candidate outcome variants were engineered into constructs and are designated by the rs ID of the corresponding variant and a black box in the construct schematic. Constructs containing other haplotypes were also generated: PRE1 hap2 (all alternative alleles of PRE1 ref; 35% frequency in Europeans) and hap3 (all alternative alleles of PRE1 ref except rs11264488; 15% frequency in Europeans); and PRE2 hap2 (all alternative alleles of PRE2 ref; 30% frequency in Europeans). Cells were transiently transfected with each of these constructs and assayed for luciferase activity after 24 h. Back-transformed data are shown and error bars denote 95% confidence intervals of replicate experiments performed in OVCAR8 and JAM cells. P-values were determined by two-way ANOVA followed by Dunnett’s multiple comparisons test (*p < 0.05, **p < 0.01, ***p < 0.001 and ****p < 0.0001).
DISCUSSION
We have performed follow-up analyses of the 1q22 and 19p12 ovarian cancer outcome loci to identify functional genetic variants and refine the genetic associations. At the 1q22 locus, candidate outcome variants were located in an ovarian super-enhancer and haplotypes containing these variants had differential effects on MEF2D promoter activity. At the 19p12 locus, an allele-specific chromatin interaction with the ZNF100 promoter region was observed with two candidate outcome variants. Candidate functional variants at both loci nominally associated with survival outcome; however, neither these, nor other variants at either locus, passed our significance threshold (p < 1×10⁻⁵).
MEF2D encodes the myocyte enhancer factor 2D, a transcription factor that was initially found to be associated with muscle cell differentiation [15] but which also affects tumor development and progression [16]. Notably, in patients diagnosed with osteosarcoma, hepatocellular carcinoma or colorectal cancer, poorer prognosis is associated with greater MEF2D expression [16-18]. Using publicly available data, we also identified associations between greater MEF2D expression and shorter PFS in women with serous ovarian cancer. Consistent with these observations, the C allele of rs11264488, the functional variant most strongly associated with any chemotherapy PFS, appears to be a requisite component of the MEF2D PRE1 haplotype with the greatest enhancer effect on MEF2D promoter activity. However, as this variant was only nominally associated with any chemotherapy PFS, links between its molecular effect and a clinical phenotype remain speculative.
ZNF100 encodes a zinc finger protein transcription factor of which little is known, although the literature indicates that this gene may have a role in cancer. ZNF100 is among the 30 most hypermethylated genes in colorectal cancer [19] and is frequently mutated in multiple myeloma with mutated alleles preferentially expressed [20]. Knockdown screens have shown that ZNF100 knockdown sensitizes gastrointestinal stromal tumor cells to sunitinib and imatinib treatment [21]. The 19p12-13 region is amplified in ovarian cancer and ZNF100, and other ZNF genes, show increased expression in tumors with these amplifications [22]. In a public dataset, we identified an association between greater ZNF100 expression and shorter OS but we have not been able to find direct evidence that candidate outcome variants at 19p12 up-regulate ZNF100 expression.
This study has several limitations which should be noted. The clinical analysis is based on observational data and a lack of treatment standardization in our any chemotherapy analyses may cloud genetic associations; however, we had hypothesized that the analysis of a more homogenous treatment group in our standard chemotherapy analyses could reveal variants with greater effects, thus increasing power to detect associations. Nevertheless, it has become apparent that very large numbers of samples are needed to detect patient outcomes that are associated with common genetic variation. In the context of this study, 11,001 survival events are needed to detect with 80% power at p < 1×10⁻⁵ a variant with a minor allele frequency of 0.4 that confers a HR of 1.1. Therefore, though we cannot rule out associations between genetic variation at 1q22 and 19p12 with ovarian cancer patient outcome, larger patient numbers will be needed to identify true associations.
MATERIALS AND METHODS
TCGA eQTL analyses in ovarian cancer samples
Data from ovarian cancer patients were accessed from The Cancer Genome Atlas (TCGA; https://tcga-data.nci.nih.gov/). Tumor gene expression microarray data (Agilent G4502A platform) and copy-number information were downloaded through the public access TCGA portal. Germline genotypes (Affymetrix 6.0 arrays) were downloaded through the TCGA controlled access portal and QC performed. Variants were excluded for call rate < 95%, MAF < 1% or deviations from HWE significant at 10-4. Thirteen samples were excluded for low overall call rate ( < 95%), heterozygosity > 3 standard deviations from the mean or non-female sex status (X-chromosome homozygosity > 0.2). A pair of samples were identified as duplicates by identity-by-state probabilities = 0.99) and the sample with the lower call rate was excluded. Overall there were 386 TCGA patients with complete genotype, gene expression and copy-number data included in the analysis. Gene expression for genes 500kb upstream and downstream of each locus were adjusted for somatic copy number variation, as previously described [23]. The associations between genotype and adjusted expression for each gene were evaluated using linear regression models by PLINK [24].
Cell lines
ES-2, COV318, COV362 cells were cultured in Dulbecco’s Modified Eagle Medium and non-essential amino acids; FUOV1 cells were cultured in DMEM/F12 with L-Glutamine; and JAM and OVCAR8 cells were cultured in RPMI1640 with L-glutamine. All cell lines were cultured with 10% fetal calf serum and penicillin/streptomycin at 37°C in a humidified 5% CO2 atmosphere. Cell lines were stored in liquid nitrogen vapor phase with Mycoplasma testing and short tandem repeat profiling performed for cell line authentication prior to storage.
Real-time PCR (qPCR)
RNA was extracted from cells using Trizol (Life Technologies) and cDNA synthesised using the SuperScript III First-Strand Synthesis System (Life Technologies) according to the manufacturer’s instructions. mRNA expression was quantified by real-time PCR reactions using Syto9 and qPCR primers (Supplementary Table 5) with normalisation by ACTB expression.
Chromatin conformation capture (3C)
3C libraries were generated from OVCAR8 and COV362 cells using HindIII (New England Biolabs) as described previously [25]. 3C interactions were quantified by qPCR with primers designed within the HindIII restriction fragments spanning the 19p12 outcome locus (Supplementary Table 5). qPCR was performed as described previously [26] using three independent 3C libraries from each cell line with each experiment quantified in duplicate. Two BAC clones (RP11-120C22 and RP11-420K14: BACPAC Resource Center) covering the 19p12 outcome locus were used to create an artificial library of ligation products in order to normalize for PCR efficiency. As an internal control, interaction frequencies were normalized to that of the HindIII fragment immediately upstream of the promoter/bait fragment. To perform allele-specific 3C, DNA was amplified by PCR of two independent 3C libraries using the bait and a reverse primer specific to a PRE1 fragment containing rs10421113 and rs10421342 (Supplementary Table 5). Sanger sequencing (Australian Genome Research Facility, Brisbane) was performed to determine the alleles present in the interacting PRE1 fragment.
Reporter gene vector construction
MEF2D and ZNF100 promoter-driven luciferase reporter constructs were generated by inserting 2119 and 703 bp of DNA PCR-amplified from the respective promoters into the KpnI and HindIII sites of pGL3-Basic. To assist cloning of PREs downstream of the Firefly luciferase gene in pGL3-Basic, additional restriction sites had been introduced in a modified pGL3-Basic construct [27] and AgeI and SalI were then used to insert PREs into pGL3-Basic. For ZNF100 PRE1 and PRE2, a 1010 bp fragment was PCR generated using primers engineered with AgeI and SbfI sites and a 463 bp fragment (hg19, chr19:21900737-21901199) synthesized with terminal AgeI and SbfI sites (Integrated DNA Technologies, Singapore) for cloning into a modified pGL3-ZNF100 promoter construct, respectively. For MEF2D PRE1 and PRE2, a 1917 bp fragment and a 1723 bp fragment were also PCR generated as above and cloned into a modified pGL3-MEF2D promoter construct, respectively. The 477 bp rs11264494 construct (hg19, chr1:154693242-156493718) was also synthesized by Integrated DNA Technologies and cloned as above. The minor alleles of individual variants were introduced into cloned sequences, containing the major alleles of any other causal candidate variants, by overlap extension PCR. Common haplotypes predicted to be present in Europeans, from analyses of 1,000 Genomes Project data accessed via the LDlink web-based application [28], were also generated. All constructs were sequenced to confirm variant incorporation (AGRF, Brisbane, Australia). PCR cloning and sequencing primers are listed in Supplementary Table 5.
Reporter assays
COV362 and OVCAR8 cells were transfected with equimolar amounts of luciferase reporter plasmids and 50 ng of pRLTK transfection control plasmid with Lipofectamine 2000 (Life Technologies). The total amount of transfected DNA was kept constant at 600 ng for each construct by adding pUC19 as a carrier plasmid. Luciferase activity was measured 24 h post-transfection by the Dual-Glo Luciferase Assay System (Promega). To correct for differences in transfection efficiency or cell lysate preparation, Firefly luciferase activity was normalized to Renilla luciferase. All promoter constructs had greater activity than the empty pGL3-Basic construct which was used as a negative control. Data were log-transformed and statistical significance was tested by two-way ANOVA followed by Dunnett’s multiple comparisons test in GraphPad Prism.
Patient samples and genotyping
Genotype analyses were restricted to invasive epithelial ovarian cancer patients of European ancestry with detailed chemotherapy and clinical follow-up for disease progression and survival following first-line treatment from OCAC and TCGA (Supplementary Table 6). PFS was defined as the interval between the date of histological diagnosis and the first confirmed sign of disease progression or death; OS was the interval between the date of histological diagnosis and death from any cause. Criteria for progression for OCAC patients have been previously described [29]. TCGA genotype data were downloaded through the TCGA data portal and assessed for ancestral outliers to determine those of European descent. Genotype data for analysis of variants at the 19p12 and 1q22 loci were available from OCAC, with samples being genotyped with the Illumina Infinium OncoArray-500K beadchip. Duplicate pairs of samples and first degree relative pairs were identified and the sample with the lower call rate was removed as appropriate. Genotype, detailed clinical follow-up and pathology data were available for 5,508 EOC patients from 24 OCAC sites. Meta-analyzed data included OncoArray dataset described above, the iCOGS (n = 317) samples which were independent to the OncoArray genotyped patient set) and TCGA datasets (n = 337) [3, 30]. In each case imputation was carried out using SHAPEIT and IMPUTE2 [31] and the 1000 Genomes phase 3 reference dataset, NCBI build b37, (October 2014 release). All studies received approval from their respective human research ethics committees, and all OCAC participants provided written informed consent.
Statistical analysis
The associations between genotypes and PFS and OS were assessed for patients in the standard chemotherapy subset and the less restrictive any chemotherapy group. Patients who had an interval of > 12 months between the date of histological diagnosis and DNA collection were excluded from the analysis to avoid survival bias. Cox regression models adjusted for residual disease (nil vs. any), tumor stage (FIGO stage I-IV), histology (serous, mucinous, endometrioid, clear cell, other epithelial), tumor grade (low vs. high), age at diagnosis (OS only), nine European ancestry principal components, and stratified by study, were used to obtain the per-allele hazard ratio HR and standard error for each variant. We tested the proportional hazards assumption for the adjusted variables and stratified by those that violated the assumption, as described previously [30]. The effect estimates in the largest available dataset using data from different genotyping platforms were derived from fixed effects meta-analysis of platform-specific estimates. We evaluated associations with OS and PFS for each variant (minor allele frequency > 0.02, imputation quality INFO score > 0.9) within a 1 Mb region encompassing the original lead variants at the 19p12 and 1q22 loci. All tests for association were two-tailed and performed using STATA SE v. 13 (Stata Corp., USA) and the R project for Statistical Computing version 3.2.2 (http://www.r-project.org/).
ACKNOWLEDGMENTS
This study would not have been possible without the contributions of the following: Per Hall (COGS); Douglas F. Easton, Paul Pharoah, Kyriaki Michailidou, Manjeet K. Bolla, Qin Wang (BCAC), Andrew Berchuck (OCAC), Rosalind A. Eeles, Douglas F. Easton, Ali Amin Al Olama, Zsofia Kote-Jarai, Sara Benlloch (PRACTICAL), Georgia Chenevix-Trench, Antonis Antoniou, Lesley McGuffog, Fergus Couch and Ken Offit (CIMBA), Joe Dennis, Alison M. Dunning, Andrew Lee, and Ed Dicks, Craig Luccarini and the staff of the Centre for Genetic Epidemiology Laboratory, Javier Benitez, Anna Gonzalez-Neira and the staff of the CNIO genotyping unit, Jacques Simard and Daniel C. Tessier, Francois Bacot, Daniel Vincent, Sylvie LaBoissière and Frederic Robidoux and the staff of the McGill University and Génome Québec Innovation Centre, Stig E. Bojesen, Sune F. Nielsen, Borge G. Nordestgaard, and the staff of the Copenhagen DNA laboratory, and Julie M. Cunningham, Sharon A. Windebank, Christopher A. Hilker, Jeffrey Meyer and the staff of Mayo Clinic Genotyping Core Facility.
The OncoArray collaboration arose, in part, through the efforts of the Genetic Associations and Mechanisms in Oncology (GAME-ON, http://epi.grants.cancer.gov/gameon/) consortium, which was a multi-year project to characterize SNP associations for common cancers and to understand their mechanistic and functional consequences in disease development. We wish to pay tribute to the contribution of Professor Brian Henderson to the GAME-ON consortium.
We are grateful to the family and friends of Kathryn Sladek Smith for their generous support for the Ovarian Cancer Association Consortium through their donations to the Ovarian Cancer Research Fund. The authors wish to thank Margie Riggan for her tireless dedication to the Ovarian Cancer Association Consortium through her excellent project and data management. We thank study participants, doctors, nurses, clinical and scientific collaborators, health care providers and health information sources who have contributed to the following specific studies; the Australian Ovarian Cancer Study (AOCS) Management Group (D. Bowtell, G. Chenevix-Trench, A. deFazio, D. Gertig, A. Green, P. Webb) and ACS Investigators (A. Green, P. Parsons, N. Hayward, P. Webb, D. Whiteman) thank all the clinical and scientific collaborators (see http://www.aocstudy.org/) and the women for their contribution. The Belgian study (BEL) would like to thank Gilian Peuteman, Thomas Van Brussel and Dominiek Smeets for technical assistance. WMH thank the members of the Gynaecological Oncology Biobank (GynBiobank) at Westmead.
The International Collaborative Ovarian Neoplasm study (ICON)7 trial team would like to thank the Medical Research Council (MRC) Clinical Trial Unit (CTU) at the University of London (UCL), the ICON7 Translational Research Sub-group, and the University of Leeds for their work on the coordination of samples and data from the ICON7 trial. The Mayo Clinic Ovarian Cancer Case-Control Study (MAY) thank C. Hilker, S. Windebank, and J. Vollenweider for iSelect genotyping. The Scottish Randomised Trial in Ovarian Cancer (SRO) thank all members of Scottish Gynaecological Clinical Trails group and SCOTROC1 investigators. The results published here are in part based upon data generated by The Cancer Genome Atlas Pilot Project established by the National Cancer Institute and National Human Genome Research Institute. Information about TCGA can be found at http://cancergenome.nih.gov/.
conflicts of interest
No authors have financial or other conflicts of interest.
GRANT SUPPORT
The OCAC Oncoarray genotyping project was funded through grants from the U.S. National Institutes of Health 2 (NIH) (CA1X01HG007491-01, U19-CA148112, R01-CA149429 and R01-CA058598); Canadian Institutes of Health 3 Research (MOP-86727) and the Ovarian Cancer Research Fund (OCRF). Funding for the iCOGS infrastructure came from: the European Community’s Seventh Framework Programme under grant agreement n° 223175 (HEALTH-F2-2009-223175) (COGS), Cancer Research UK (C1287/A10118, C1287/A 10710, C12292/A11174, C1281/A12014, C5047/A8384, C5047/A15007, C5047/A10692, C8197/A16565), the National Institutes of Health (CA128978) and Post-Cancer GWAS initiative (1U19 CA148537, 1U19 CA148065 and 1U19 CA148112 - the GAME-ON initiative), the Department of Defence (W81XWH-10-1-0341), the Canadian Institutes of Health Research (CIHR) for the CIHR Team in Familial Risks of Breast Cancer, Komen Foundation for the Cure, the Breast Cancer Research Foundation, and the Ovarian Cancer Research Fund.
AUS studies (Australian Ovarian Cancer Study and the Australian Cancer Study) were funded by the U.S. Army Medical Research and Materiel Command (DAMD17-01-1-0729), National Health & Medical Research Council of Australia (199600 and 400281), Cancer Councils of New South Wales, Victoria, Queensland, South Australia and Tasmania, Cancer Foundation of Western Australia (Multi-State Application Numbers 191, 211 and 182). The Bavarian study (BAV) was supported by ELAN Funds of the University of Erlangen-Nuremberg. The Belgian study (BEL) was funded by Nationaal Kankerplan. The BVU study was funded by Vanderbilt CTSA grant from the National Institutes of Health (NIH)/National Center for Advancing Translational Sciences (NCATS) (ULTR000445). The CNIO Ovarian Cancer Study (CNI) study was supported by Instituto de Salud Carlos III (PI 12/01319); Ministerio de Economía y Competitividad (SAF2012). The Hawaii Ovarian Cancer Study (HAW) was supported the U.S. National Institutes of Health (R01-CA58598, N01-CN-55424 and N01-PC-67001). The Hannover-Jena Ovarian Cancer Study (HJO) study was funded by intramural funding through the Rudolf-Bartling Foundation. The Hormones and Ovarian Cancer Prediction study (HOP) was supported by US National Cancer Institute: K07-CA80668; R01CA095023; P50-CA159981; R01-CA126841; US Army Medical Research and Materiel Command: DAMD17-02-1-0669; NIH/National Center for Research Resources/General Clinical Research Center grant MO1- RR000056. The Women’s Cancer Program (LAX) was supported by the American Cancer Society Early Detection Professorship (120950-SIOP-06-258-06-COUN) and the National Center for Advancing Translational Sciences (NCATS), Grant UL1TR000124. The Mayo Clinic Case-Only Ovarian Cancer Study (MAC) and the Mayo Clinic Ovarian Cancer Case-Control Study (MAY) were funded by the National Institutes of Health (R01-CA122443, P30-CA15083, P50-CA136393); Mayo Foundation; Minnesota Ovarian Cancer Alliance; Fred C. and Katherine B. Andersen Foundation; Fraternal Order of Eagles. The MALOVA study (MAL) was funded by research grant R01- CA61107 from the National Cancer Institute, Bethesda, Md; research grant 94 222 52 from the Danish Cancer Society, Copenhagen, Denmark; and the Mermaid I project. The North Carolina Ovarian Cancer Study (NCO) National Institutes of Health (R01-CA76016) and the Department of Defense (DAMD17-02-1-0666). The New England-based Case-Control Study of Ovarian Cancer (NEC) was supported by NIH grants R01 CA 054419-10 and P50 CA105009, and Department of Defense CDMRP grant W81XWH-10-1-0280. The University of Bergen, Haukeland University Hospital, Norway study (NOR) was funded by Helse Vest, The Norwegian Cancer Society, The Research Council of Norway. The Oregon study (ORE) was funded by the Sherie Hildreth Ovarian Cancer Research Fund and the OHSU Foundation. The Ovarian Cancer Prognosis and Lifestyle Study (OPL) was funded by National Health and Medical Research Council (NHMRC) of Australia (APP1025142) and Brisbane Women’s Club. The Danish Pelvic Mass Study (PVD) was funded by Herlev Hospitals Forskningsråd, Direktør Jacob Madsens og Hustru Olga Madsens fond, Arvid Nilssons fond, Gangsted fonden, Herlev Hospitals Forskningsråd and Danish Cancer Society. The Royal Brisbane Hospital (RBH) study was funded by the National Health and Medical Research Council of Australia. The Scottish Randomised Trial in Ovarian Cancer study (SRO) was funded by Cancer Research UK (C536/A13086, C536/A6689) and Imperial Experimental Cancer Research Centre (C1312/A15589). The Princess Margaret Cancer Centre study (UHN) was funded by Princess Margaret Cancer Centre Foundation-Bridge for the Cure. The Gynaecological Oncology Biobank at Westmead (WMH) is a member of the Australasian Biospecimen Network-Oncology group, funded by the Australian National Health and Medical Research Council Enabling Grants ID 310670 & ID 628903 and the Cancer Institute NSW Grants ID 12/RIG/1-17 and 15/RIG/1-16. OVCARE Gynecologic Tissue Bank and Outcomes Unit (VAN) study was funded by BC Cancer Foundation, VGH & UBC Hospital Foundation.
Stuart MacGregor acknowledges funding from an Australian Research Council Future Fellowship and an Australian National Health and Medical Research Council project grant (APP1051698). Anna deFazio was funded by the University of Sydney Cancer Research Fund and the Cancer Institute NSW through the Sydney West-Translational Cancer Research Centre. Dr. Beth Y. Karlan is supported by American Cancer Society Early Detection Professorship (SIOP-06-258-01-COUN) and the National Center for Advancing Translational Sciences (NCATS), Grant UL1TR000124. Irene Orlow was supported by NCI CCSG award (P30-CA008748). GCT, PW and TO’M were funded by NHMRC Fellowships.
REFERENCES
1. Dinkelspiel HE, Champer M, Hou J, Tergas A, Burke WM, Huang Y, Neugut AI, Ananth CV, Hershman DL, Wright JD. Long-term mortality among women with epithelial ovarian cancer. Gynecologic Oncology. 2015; 138:421-428.
2. Sopik V, Iqbal J, Rosen B, Narod SA. Why have ovarian cancer mortality rates declined? Part II. Case-fatality. Gynecologic Oncology. 2015; 138:750-756.
3. Johnatty SE, Tyrer JP, Kar S, Beesley J, Lu Y, Gao B, Fasching PA, Hein A, Ekici AB, Beckmann MW, Lambrechts D, Van Nieuwenhuysen E, Vergote I, et al. Genome-wide Analysis Identifies Novel Loci Associated with Ovarian Cancer Outcomes: Findings from the Ovarian Cancer Association Consortium. Clin Cancer Res. 2015; 21:5264-5276.
4. Mifsud B, Tavares-Cadete F, Young AN, Sugar R, Schoenfelder S, Ferreira L, Wingett SW, Andrews S, Grey W, Ewels PA, Herman B, Happe S, Higgs A, et al. Mapping long-range promoter contacts in human cells with high-resolution capture Hi-C. Nat Genet. 2015; 47:598-606.
5. Li G, Ruan X, Auerbach RK, Sandhu KS, Zheng M, Wang P, Poh HM, Goh Y, Lim J, Zhang J, Sim HS, Peh SQ, Mulawadi FH, et al. Extensive promoter-centered chromatin interactions provide a topological basis for transcription regulation. Cell. 2012; 148:84-98.
6. Ardlie KG, Deluca DS, Segrè AV, Sullivan TJ, Young TR, Gelfand ET, Trowbridge CA, Maller JB, Tukiainen T, Lek M, Ward LD, Kheradpour P, Iriarte B, et al. The Genotype-Tissue Expression (GTEx) pilot analysis: Multitissue gene regulation in humans. Science. 2015; 348:648-660.
7. Hou C, Dale R, Dean A. Cell type specificity of chromatin organization mediated by CTCF and cohesin. Proc Natl Acad Sci U S A. 2010; 107:3651-3656.
8. Heinz S, Romanoski CE, Benner C, Glass CK. The selection and function of cell type-specific enhancers. Nat Rev Mol Cell Biol. 2015; 16:144-154.
9. Hnisz D, Abraham BJ, Lee TI, Lau A, Saint-André V, Sigova AA, Hoke HA, Young RA. Super-enhancers in the control of cell identity and disease. Cell. 2013; 155:934-947.
10. Ørom UA, Shiekhattar R. Long non-coding RNAs and enhancers. Curr Opin Genet Dev. 2011; 21:194-198.
11. Li S, Weidenfeld J, Morrisey EE. Transcriptional and DNA binding activity of the Foxp1/2/4 family is modulated by heterotypic and homotypic protein interactions. Mol Cell Biol. 2004; 24:809-822.
12. Choi EJ, Seo EJ, Kim DK, Lee SI, Kwon YW, Jang IH, Kim KH, Suh DS, Kim JH. FOXP1 functions as an oncogene in promoting cancer stem cell-like characteristics in ovarian cancer cells. Oncotarget. 2016; 7:3506-3519. doi: 10.18632/oncotarget.6510.
13. Gyorffy B, Lanczky A, Szallasi Z. Implementing an online tool for genome-wide validation of survival-associated biomarkers in ovarian-cancer using microarray data from 1287 patients. Endocr Relat Cancer. 2012; 19:197-208.
14. Amos CI, Dennis J, Wang Z, Byun J, Schumacher FR, Gayther SA, Casey G, Hunter DJ, Sellers TA, Gruber SB, Dunning AM, Michailidou K, Fachal L, et al. The OncoArray Consortium: A Network for Understanding the Genetic Architecture of Common Cancers. Cancer Epidemiol Biomarkers Prev. 2017; 26:126-135.
15. Breitbart RE, Liang CS, Smoot LB, Laheru DA, Mahdavi V, Nadal-Ginard B. A fourth human MEF2 transcription factor, hMEF2D, is an early marker of the myogenic lineage. Development. 1993; 118:1095-1106.
16. Ma L, Liu J, Liu L, Duan G, Wang Q, Xu Y, Xia F, Shan J, Shen J, Yang Z, Bie P, Cui Y, Bian XW, et al. Overexpression of the transcription factor MEF2D in hepatocellular cancer sustains malignant character by suppressing G2/M transition genes. Cancer Research. 2014; 74:1452-62.
17. Yu H, Sun H, Bai Y, Han J, Liu G, Liu Y, Zhang N. MEF2D overexpression contributes to the progression of osteosarcoma. Gene. 2015; 563:130-135.
18. Su L, Luo Y, Yang Z, Yang J, Yao C, Cheng F, Shan J, Chen J, Li F, Liu L, Liu C, Xu Y, Jiang L, et al. MEF2D transduces microenvironment stimuli to ZEB1 to promote epithelial-mesenchymal transition and metastasis in colorectal cancer. Cancer Research. 2016; 76:5054-67.
19. Chen W, Xiang J, Chen DF, Ni BB, Chen H, Fan XJ, Wang PN, Song SX, Fang LK, Xiao HY, Wang L, Wang JP. Screening for differentially methylated genes among human colorectal cancer tissues and normal mucosa by microarray chip. Mol Biol Rep. 2013; 40:3457-3464.
20. Craig DW, Liang W, Venkata Y, Kurdoglu A, Aldrich J, Auclair D, Allen K, Harrison B, Jewell S, Kidd PG, Correll M, Jagannath S, Siegel DS, et al. Interim Analysis Of The Mmrf Commpass Trial, a Longitudinal Study In Multiple Myeloma Relating Clinical Outcomes To Genomic and Immunophenotypic Profiles. Blood. 2013; 122:532-532.
21. Rink L, Ochs MF, Zhou Y, von Mehren M, Godwin AK. ZNF-mediated resistance to imatinib mesylate in gastrointestinal stromal tumor. PloS one. 2013; 8:e54477.
22. Smebye ML, Sveen A, Haugom L, Davidson B, Tropé CG, Lothe RA, Heim S, Skotheim RI, Micci F. Chromosome 19 rearrangements in ovarian carcinomas: Zinc finger genes are particularly targeted. Genes, Chromosomes and Cancer. 2014; 53:558-567.
23. Li Q, Seo JH, Stranger B, McKenna A, Pe’er I, Laframboise T, Brown M, Tyekucheva S, Freedman ML. Integrative eQTL-based analyses reveal the biology of breast cancer risk loci. Cell. 2013; 152:633-641.
24. Purcell S, Neale B, Todd-Brown K, Thomas L, Ferreira MA, Bender D, Maller J, Sklar P, de Bakker PI, Daly MJ, Sham PC. PLINK: a tool set for whole-genome association and population-based linkage analyses. Am J Hum Genet. 2007; 81:559-575.
25. Tan-Wong SM, French JD, Proudfoot NJ, Brown MA. Dynamic interactions between the promoter and terminator regions of the mammalian BRCA1 gene. Proc Natl Acad Sci U S A. 2008; 105:5160-5165.
26. French JD, Ghoussaini M, Edwards SL, Meyer KB, Michailidou K, Ahmed S, Khan S, Maranian MJ, O’Reilly M, Hillman KM, Betts JA, Carroll T, Bailey PJ, et al. Functional variants at the 11q13 risk locus for breast cancer regulate cyclin D1 expression through long-range enhancers. Am J Hum Genet. 2013; 92:489-503.
27. Glubb DM, Maranian MJ, Michailidou K, Pooley KA, Meyer KB, Kar S, Carlebur S, O’Reilly M, Betts JA, Hillman KM, Kaufmann S, Beesley J, Canisius S, et al. Fine-Scale Mapping of the 5q11.2 Breast Cancer Locus Reveals at Least Three Independent Risk Variants Regulating MAP3K1. Am J Hum Genet. 2015; 96:5-20.
28. Machiela MJ, Chanock SJ. LDlink: a web-based application for exploring population-specific haplotype structure and linking correlated alleles of possible functional variants. Bioinformatics. 2015; 31:3555-3557.
29. Johnatty SE, Beesley J, Gao B, Chen X, Lu Y, Law MH, Henderson MJ, Russell AJ, Hedditch EL, Emmanuel C, Fereday S, Webb PM, Group AOCS, et al. ABCB1 (MDR1) polymorphisms and ovarian cancer progression and survival: a comprehensive analysis from the Ovarian Cancer Association Consortium and The Cancer Genome Atlas. Gynecol Oncol. 2013; 131:8-14.
30. French JD, Johnatty SE, Lu Y, Beesley J, Gao B, Kalimutho M, Henderson MJ, Russell AJ, Kar S, Chen X, Hillman KM, Kaufmann S, Sivakumaran H, et al. Germline polymorphisms in an enhancer of PSIP1 are associated with progression-free survival in epithelial ovarian cancer. Oncotarget. 2016; 7:6353-6368. doi: 10.18632/oncotarget.7047.
31. Howie BN, Donnelly P, Marchini J. A flexible and accurate genotype imputation method for the next generation of genome-wide association studies. PLoS Genet. 2009; 5:e1000529.