
INTRODUCTION
In the past two decades, several lines of evidence have converged to support that schizophrenia is a disorder associated with extensive disturbance of brain functional connectivity/activity [1–5]. Most of the previous studies suggest that hyper-connectivity/activity is mainly located in subcortical regions and some cortical-subcortical circuits. However, hypo-connectivity/activity is mainly located in the cortical regions, particularly in the cortical regions of the frontal and parietal cortex [6–12]. The frontal, temporal, parietal, and cingulate gyri, as well as the cuneus, precuneus, occipital gyrus, basal ganglia, hippocampus, and thalami are the crucial regions of alterations of functional connectivity/activity alterations in schizophrenia [6–12]. As early as 2011, Fornito et al. reviewed many previous studies and suggested that schizophrenia is associated with a widespread cortical functional connectivity deficit, and on this background, hyper- and/or hypo-connectivity was also observed in some cortical or subcortical regions [13]. Recently, a few studies based on graph theory have suggested that the brain network appears to have only a few well-localized regions (hubs) for the fast integration of neural processing, and their dysfunction could contribute to neuropsychiatric diseases, including schizophrenia [14–17]. However, most previous studies were focused on investigating alterations in the functional connection strength in schizophrenia [13, 18–22], and few studies investigated alterations in the functional connection numbers in schizophrenia [16, 23, 24]. Moreover, even fewer studies have investigated alterations in functional hubs in schizophrenia [25].
Functional connectivity density mapping (FCDM) can delineate brain network topology based on data from individual voxels [26–32]. It can determine the properties of the resting state networks that are associated with the major local functional connectivity density (lFCD) and long-range functional connectivity density (lrFCD) hubs in the cortical and subcortical brain regions [26–32]. In recent years, FCDM has been used in many studies to characterize aberrant functional connectivity hubs and investigate the aberrant FCD. These studies have yielded many pivotal findings. For example, Tomasi et al. found that lFCD hubs can be used as a biomarker for clinical applications in individuals with neuropsychiatric disorders [16] and that lrFCD hubs are more vulnerable to aging effects than short-range connections [30]. Additionally, Zhuo et al. found global FCD alterations in schizophrenia patients [24]. Shokri-Kojori et al. found that alcohol influences brain functional connectivity as well as its coupling with behavior [31]. In summary, multiple lines of evidence confirm that FCDM can be used to reveal abnormal functional activity hubs and abnormal functional connectivity densities in patients with mental disorders.
More importantly, in FCDM, the numbers of resting-state functional connections between a given voxel and other voxels in the brain are counted. This method is different from the traditional functional connectivity methods that focus on the functional connectivity strength (FCS) of two brain regions or voxels. FCDM focuses on the numbers of functional connections. FCS and FCD reflect different connectivity properties. FCS measures the connectivity strength between two voxels, regions or networks, and thus represents a one-to-one relationship. However, FCD reflects a one-to-many relationship. The FCD value increases as the number of functional connections between a particular voxel and other brain voxels increases, and a high FCD value suggests that this voxel plays a more important role in the information processing of the brain than voxels with low FCD values [26–33]. However, FCDM to has not previously been used investigate the alterations in lFCD, lrFCD and FCD hubs in schizophrenia patients.
In the present study, using FCDM methods, we aimed to delineate the functional hubs of patients with schizophrenia and to characterize the aberrant lFCD and lrFCD patterns in these individuals. We hypothesized that the lFCD and lrFCD would be altered in schizophrenia patients and that the space distribution of aberrant lFCD or lrFCD and the aberrant pattern (increased or decreased) of lFCD or lrFCD would be different in schizophrenia patients from those in healthy individuals.
RESULTS
Demographic and clinical characteristics
A total of 95 patients and 93 healthy controls were enrolled in the study. There were no significant differences in gender (χ2=1.35, P=0.25) and age (t=0.48, P=0.63) between the two groups (Table 1). Among the 95 patients, 87 received medication during the MRI examinations. The duration of illness and antipsychotic dosage (chlorpromazine equivalents) were 121.42±92.80 months and 446.54±341.60 mg/d, respectively. The PANSS scores of the positive subscale, -negative subscale, and general psychopathology subscale were 17.10±7.92, 20.30±9.13, and 34.14±10.83, respectively (Table 1).
Table 1: Demographic and clinical characteristics of study groups
Characteristics | Schizophrenia patients |
Healthy controls |
t |
P |
|---|---|---|---|---|
Number of subjects |
95 |
93 |
- |
|
Age (years) |
33.6 ±7.8 |
33.0±10.2 |
0.482 |
0.633 |
Gender (female/male), n |
41/54 |
48/45 |
1.654 |
0.246 |
Antipsychotic dosage (mg/d), chlorpromazine equivalents |
446.54±341.60 |
- |
- |
|
Duration of illness (months) |
121.42±92.80 |
- |
||
PANSS |
17.10±7.92 |
- |
- |
PANSS, Positive and Negative Syndrome Scale. Data are shown as the means ± standard deviation.
Distributed specificity of FCD hubs in patients and healthy controls
In patients and healthy controls, the hubs with the highest FCD were consistently located in the precuneus and the inferior parietal lobe, followed by the superior temporal gyrus, medial prefrontal cortex, and dorsal lateral prefrontal cortex. The FCD hubs were also consistently distributed in similar brain regions in the patients and the healthy controls. Most of these FCD hubs were components of the default mode network and sensory cortices (Figure 1). The distribution of the FCD hubs was generally consistent with the findings of Tomasi et al. [32]. The hub distribution did not differ between the two groups.
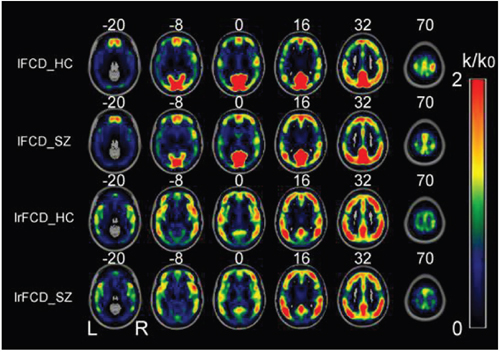
Figure 1: Spatial distributions of the average rescaled lFCD and lrFCD hubs in healthy control individuals and schizophrenia patients. FCD: functional connectivity density; HC: healthy controls; lFCD: local FCD; lrFCD: long-range FCD; SZ: schizophrenia patients; L: left; R: right.
FCD changes in schizophrenia patients
Voxel-wise analysis showed decreased lFCD primarily in the bilateral postcentral gyri, inferior temporo-occipital conjunction (TOC), and right calcarine sulcus. lFCD was increased in the bilateral subcortical regions (i.e., the bilateral putamen, caudate, pallidum, and thalami), hippocampus/parahippocampus complex, temporal pole, middle TOC, supplementary motor area, right orbital frontal gyrus, and left superior temporal gyrus. We found increased lrFCD only in the bilateral thalami and pallidum (Figure 2).
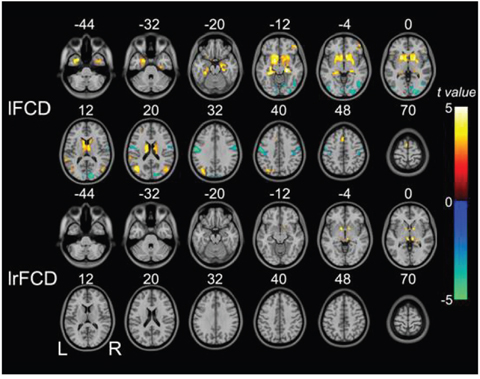
Figure 2: Brain regions in which lFCD and lrFCD differed significantly between schizophrenia patients and healthy controls. Voxel-based analysis shows brain regions with significant group differences in lFCD and lrFCD (P<0.05, false discovery rate corrected). Warm colors represent significantly increased FCD in schizophrenia patients. Cold colors denote significantly decreased FCD in schizophrenia patients. FCD: functional connectivity density; lFCD: local FCD; lrFCD: long-range FCD; L: left; R: right.
Associations between FCD and clinical variables
No associations were observed between the lFCD and lrFCD values and the antipsychotic dosage, illness duration, or any PANSS score.
DISCUSSION
In this study, we found that both lFCD and lrFCD were altered in schizophrenia patients. The brain regions with aberrant lFCD were more diffuse and larger than the brain regions with aberrant lrFCD. The altered patterns of lFCD were also more complex than lrFCD, with decreased and increased lFCD both observed in schizophrenia patients compared with only one inter-regional increase in lrFCD. These findings suggest that the disturbance in local functional connection numbers was pronounced in schizophrenia patients, which is partially in agreement with a previous observation that lFCD was decreased in the primary sensorimotor area and increased in frontal areas [23]. Although previous findings for some brain areas with aberrant lFCD did not agree with our findings, this previous study supported our findings to some extent. Contrary to lFCD alterations and lrFCD alterations, the distributions of both lFCD and lrFCD hubs were not significantly different between the patients and healthy controls. This phenomenon is not unusual. Tomasi et al. also found similar distributions of FCD hubs between children with attention-deficit/hyperactivity disorder and healthy controls [32]. Overall, our findings and Chen et al.’s findings [23] converge to support the hypothesis that schizophrenia is a disorder of brain dysfunction that particularly affects the local functional connectivity network [3, 13, 14, 17, 34, 35].
Fornito et al. suggested that schizophrenia is associated with a widespread cortical functional connectivity deficit. On this basis, hyper- and/or hypo-connectivity have also been observed in some cortical or subcortical regions [13]. In the present study, we found that decreased lFCD was primarily located in the posterior cortices, whereas increased lFCD and lrFCD were primarily located in the subcortical and limbic system regions. Under this background, some scattered increased or decreased lFCD areas were distributed in different cortical regions. A considerable number of studies that adopted other methods also found that subcortical functional activity alterations usually occur in an increased pattern, whereas local cortical functional activity alterations usually manifest as a pattern of hypo- and hyper-functional activity.. For example, Turner et al. reported that the amplitude of low-frequency fluctuations (ALFF) was significantly increased in the putamen, amygdala, hippocampus, and hypothalamus [8]. Yu et al. [7] also described decreased regional homogeneity (ReHo) in the precentral gyrus and the middle occipital gyrus, but increased ReHo in the medial prefrontal cortex and the anterior insula. Ren et al. [9] reported that ALFF was decreased in the right inferior and left superior frontal gyrus, bilateral medial frontal gyrus, bilateral inferior parietal lobule, and precuneus, but ALFF was increased in the bilateral occipital regions. Consistent with the above-mentioned studies, our findings support Fornito’s hypothesis from the perspective of connection numbers [13].
In our analysis, the lFCD and lrFCD values also showed no statistical correlation with the antipsychotic dosage. This is consistent with our previous reports that the global FCD value was not correlated with antipsychotic dosage. Previous studies also reported that there was no relationship of illness duration, symptom severity, and antipsychotic dosage with brain functional connectivity [9, 32, 36]. These studies and our findings indicate that BOLD signal alterations may track the presence of psychosis, instead of its severity or duration [9], and are not linearly correlated with the antipsychotic dosage [32, 36].
Although we found aberrant functional connection numbers in schizophrenia patients, the significance of our research is limited. Our study was a cross-sectional study, and the findings of this work reflect only the cross-sectional brain imaging characteristics of schizophrenia. Regarding the possible confounding effects of the medications the patients had received, we cannot be absolutely sure that the changes in lFCD and lrFCD observed in schizophrenia patients were due to the disease itself rather than the medication. A large-sample, extended follow-up study enrolling first-episode, drug naïve patients would enable a dynamic characterization of the developmental trajectory of the brain imaging characteristics of schizophrenia. These findings could be associated with the pathogenesis of the illness, its duration, and treatment interventions. Based on brain imaging results and the observed developmental trajectory of the imaging characteristics of schizophrenia, treatment targets could be explored, and treatment efficacy predictors based on pretreatment MRI data could be established. Such efforts could greatly improve the early cure rate; however, this goal will require the cooperation of many study centers.
MATERIALS AND METHODS
Study population
This study was conducted from February 2013 to November 2014 and was approved by the Ethics Committee of Tianjin Anning Hospital (No. 2012-H-008). All participants provided written informed consent. Two hundred right-handed participants, including 98 schizophrenia patients and 102 healthy controls, were enrolled in the present study. Patient diagnoses and the durations of illness were defined with the consensus of two professional psychiatrists who used the Structured Interview for DSM-IV (SCID) Axis I Disorder criteria. The lifetime absence of psychiatric illnesses in the healthy controls was confirmed by using the non-patient edition of the SCID (SCID-NP). Moreover, control subjects were interviewed to exclude those with a known family history of mental disorders in first-degree relatives. The exclusion criteria included 1) previous head trauma with a consciousness disturbance lasting more than 5 minutes; 2) a history of drug or other substance abuse; 3) pregnancy; 4) organic illness, including cardiovascular disease; or 5) a neurological disorder, as diagnosed by an interview and medical record review. The image quality was assessed by a professional radiologist. Consequently, three patients with schizophrenia and nine healthy controls were excluded due to poor image quality. Therefore, 95 patients and 93 healthy controls were included for further analysis. For all participants, the Positive and Negative Syndrome Scale (PANSS) was used to quantify the clinical symptoms of psychosis.
Magnetic resonance imaging (MRI) data acquisition
MRI was performed using a 3.0-Tesla MR system (Discovery MR750, General Electric, Milwaukee, WI, USA). Fitted foam padding and earplugs were used to minimize head motion and reduce scanner noise, respectively. Sagittal 3D T1-weighted images were acquired using a previously described brain volume (BRAVO) sequence [37]. Then, resting-state functional magnetic resonance imaging (fMRI) was performed using a gradient-echo single-short echo planar imaging sequence with previously described parameters [37]. All participants were instructed to keep their eyes closed, to stay relaxed, to minimize movement, to think of nothing in particular, and to stay awake during the fMRI scans.
fMRI data preprocessing
Preprocessing of resting-state fMRI data was conducted using SPM8 (http://www.fil.ion.ucl.ac.uk/spm). The first 10 volumes for each participant were discarded to avoid the use of data collected before participants could adapt to the scanning noise and the signal could reach equilibrium. The remaining volumes were corrected for the acquisition time delay between slices, and then, realignment for motion between time points was applied. The fMRI data of all participants were within defined motion thresholds (i.e., translational or rotational motion measures <2 mm or <2°). Frame-wise displacement (FD), which reflects the volume-to-volume changes in head position, was also calculated. Several nuisance variances, including the estimated six motion parameters, average blood oxygen level dependent (BOLD) signals of the ventricular and white matter, and the first-time derivatives, were removed through a linear regression analysis. The head motion-induced signal spike has been reported to significantly contaminate the final resting-state fMRI data, even after corrected for the six motion parameters via regression [25]. For this reason, we performed regression for the spike volumes if the FD of the specific volume was >0.5. Band-pass filtering of the data was applied within the frequency range of 0.01–0.08 Hz. For normalization, individual structural images were linearly co-registered with the mean functional image first and then to the MNI space. Finally, the filtered functional volumes underwent spatial normalization to the MNI space using the co-registration parameters, and then resampling into 3-mm cubic voxels was performed.
FCD calculation
A program written in-house on the Linux platform was used for calculating the FCD of each voxel, as previously described by Tomasi and Volkow [26–32]. The FCD was calculated only forthe cerebral gray matter mask regions. For FCDM, the lFCD at x0 was computed as the number of elements in the local functional connectivity cluster, k(x0). The calculated then proceeded through all values of x0 for all qualified voxels in the brain. The strength of the lrFCD was defined as the global FCD [28] minus the lFCD. Grand mean scaling of lFCD and lrFCD was achieved by division by the mean value for all brain voxels to better normalize the distribution. Finally, the FCD maps were spatially smoothed using a 6×6×6-mm3 Gaussian kernel to minimize inter-subject differences in functional brain anatomy. As recommended by the developer of FCDM, Pearson’s linear correlation was used to evaluate the strength of the functional connectivity between voxels. A correlation coefficient of r>0.6 for two voxels indicated a significant connection between them. This threshold and the above-mentioned in-house script have been confirmed to be optimal for calculating FCD [25–31]. Therefore, in the present study, we used the threshold of r=0.6 to calculate FCD.
Statistical analysis
Demographic and clinical data were analyzed for statistical significance using SPSS version 19.0 software (SPSS, Chicago, IL, USA). Differences in dosages of antipsychotic agent and disease durations between the two groups were determined by two-sample t-tests, and the significance of the difference in gender between the two groups was determined by the chi-square test. Differences in lFCD and LrFCD were compared using two-sample t-tests, in a voxel-wise manner, with age and gender considered nuisance variables. A false discovery rate method with a corrected threshold of P<0.05 was applied for multiple comparisons.
CONCLUSION
This study found both aberrant lFCD and lrFCD in schizophrenia patients, and the variation in lFCD was more pronounced and more complicated than that of lrFCD. The lFCD and lrFCD values also showed no statistical correlation with the antipsychotic dosage, illness duration, or severity of the illness. Simultaneously, we found that the distributions of lFCD and lrFCD hubs did not differ significantly between the patient and control groups. Our findings support the hypothesis that schizophrenia is a disorder of brain dysconnectivity that particularly affects the local functional connectivity network, which is characterized by coexisting hyper- and hypo-connectivity in some cortical or subcortical regions.
Author contributions
LC, J Z and CZ conceptional design and writing of the draft manuscript.
C L, W Z and GC acquired and examined the fMRI data of this study.
HT, JL and HQ acquired and examined the clinical data of this study.
ACKNOWLEDGMENTS
We thank the patients and their families.
CONFLICTS OF INTEREST
There are no conflicts of interest.
FUNDING
This study was supported by grants from the National Natural Science Foundation of China (No. 81425013, No .91332113 and No. 81271551), the China Postdoctoral Science Foundation Funded Project (No. 2012M 520585), and the Tianjin Key Technology R&D Program (No. 14ZCZDSY00018).
REFERENCES
1. Pettersson-Yeo W, Allen P, Benetti S, McGuire P, Mechelli A. Dysconnectivity in schizophrenia: where are we now? Neurosci Biobehav Rev. 2011; 35:1110-24.
2. Stephan KE, Friston KJ, Frith CD. Dysconnection in schizophrenia: from abnormal synaptic plasticity to failures of self-monitoring. Schizophr Bull. 2009; 35:509-27.
3. Friston KJ, Frith CD. Schizophrenia: a disconnection syndrome? Clin Neurosci. 1995; 3:89.
4. Zhou Y, Liang M, Tian L, Wang K, Hao Y, Liu H, Liu Z, Jiang T. Functional disintegration in paranoid schizophrenia using resting-state fMRI. Schizophr Res. 2007; 97:194-205. doi: 10.1016/j.schres.2007.05.029.
5. Whitfield-Gabrieli S, Thermenos HW, Milanovic S, Tsuang MT, Faraone SV, McCarley RW, Shenton ME, Green AI, Nieto-Castanon A, LaViolette P, Wojcik J, Gabrieli JD, Seidman LJ. Hyperactivity and hyperconnectivity of the default network in schizophrenia and in first-degree relatives of persons with schizophrenia. Proc Natl Acad Sci U S A. 2009; 106:1279-84.
6. Argyelan M, Ikuta T, DeRosse P, Braga RJ, Burdick KE, John M, Kingsley PB, Malhotra AK, Szeszko PR. Resting-state fMRI connectivity impairment in schizophrenia and bipolar disorder. Schizophr Bull. 2014; 40:100-10. doi: 10.1093/schbul/sbt092.
7. Yu R, Hsieh MH, Wang HL, Liu CM, Liu CC, Hwang TJ, Chien YL, Hwu HG, Tseng WY. Frequency dependent alterations in regional homogeneity of baseline brain activity in schizophrenia. PLoS One. 2013; 8:e57516. doi: 10.1371/journal.pone.0057516.
8. Turner JA, Damaraju E, van Erp TG, Mathalon DH, Ford JM, Voyvodic J, Mueller BA, Belger A, Bustillo J, McEwen S, Potkin SG, Fbirn, Calhoun VD. A multi-site resting state fMRI study on the amplitude of low frequency fluctuations in schizophrenia. Front Neurosci. 2013; 7:137. doi: 10.3389/fnins.2013.00137.
9. Ren W, Lui S, Deng W, Li F, Li M, Huang X, Wang Y, Li T, Sweeney JA, Gong Q. Anatomical and functional brain abnormalities in drug-naive first-episode schizophrenia. Am J Psychiatry. 2013; 170:1308-16. doi: 10.1176/appi.ajp.2013.12091148.
10. He Z, Deng W, Li M, Chen Z, Jiang L, Wang Q, Huang C, Collier DA, Gong Q, Ma X, Zhang N, Li T. Aberrant intrinsic brain activity and cognitive deficit in first-episode treatment-naive patients with schizophrenia. Psychol Med. 2013; 43:769-80. doi: 10.1017/s0033291712001638.
11. Hoptman MJ, Zuo XN, Butler PD, Javitt DC, D'Angelo D, Mauro CJ, Milham MP. Amplitude of low-frequency oscillations in schizophrenia: a resting state fMRI study. Schizophr Res. 2010; 117:13-20. doi: 10.1016/j.schres.2009.09.030.
12. Ikuta T, Robinson DG, Gallego JA, Peters BD, Gruner P, Kane J, John M, Sevy S, Malhotra AK, Szeszko PR. Subcortical modulation of attentional control by second-generation antipsychotics in first-episode psychosis. Psychiatry Res. 2014; 221:127-34. doi: 10.1016/j.pscychresns.2013.09.010.
13. Fornito A, Zalesky A, Pantelis C, Bullmore ET. Schizophrenia, neuroimaging and connectomics. Neuroimage. 2012; 62:2296-314.
14. Schmidt A, Diwadkar VA, Smieskova R, Harrisberger F, Lang UE, McGuire P, Fusar-Poli P, Borgwardt S. Approaching a network connectivity-driven classification of the psychosis continuum: a selective review and suggestions for future research. Front Hum Neurosci. 2015; 8:1047. doi: 10.3389/fnhum.2015.01047.
15. Karbasforoushan H, Woodward ND. Resting-state networks in schizophrenia. Curr Top Med Chem. 2012; 12:2404-14.
16. Tomasi D, Volkow ND. Mapping small-world properties through development in the human brain: disruption in schizophrenia. PLoS One. 2014; 9:e96176. doi: 10.1371/journal.pone.0096176.
17. Liu Y, Liang M, Zhou Y, He Y, Hao Y, Song M, Yu C, Liu H, Liu Z, Jiang T. Disrupted small-world networks in schizophrenia. Brain. 2008; 131:945-61.
18. Narr KL, Leaver AM. Connectome and schizophrenia. Curr Opin Psychiatry. 2015; 28:229.
19. Fornito A, Bullmore ET. Reconciling abnormalities of brain network structure and function in schizophrenia. Curr Opin Neurobiol. 2015; 30:44-50.
20. van den Heuvel MP, Fornito A. Brain networks in schizophrenia. Neuropsychol Rev. 2014; 24:32-48.
21. Fitzsimmons J, Kubicki M, Shenton ME. Review of functional and anatomical brain connectivity findings in schizophrenia. Curr Opin Psychiatry. 2013; 26:172-87.
22. Liang M, Zhou Y, Jiang T, Liu Z, Tian L, Liu H, Hao Y. Widespread functional disconnectivity in schizophrenia with resting-state functional magnetic resonance imaging. Neuroreport. 2006; 17:209.
23. Chen X, Duan M, Xie Q, Lai Y, Li D, Cao W, Yao D, Luo C. Functional disconnection between the visual cortex and the sensorimotor cortex suggests a potential mechanism for self-disorder in schizophrenia. Schizophr Res. 2015; 166:151-7.
24. Zhuo C, Zhu J, Qin W, Qu H, Ma X, Tian H, Xu Q, Yu C. Functional connectivity density alterations in schizophrenia. Front Behav Neurosci. 2014; 8:404.
25. van den Heuvel MP, Sporns O, Collin G, Scheewe T, Mandl RC, Cahn W, Goni J, Hulshoff Pol HE, Kahn RS. Abnormal rich club organization and functional brain dynamics in schizophrenia. JAMA Psychiatry. 2013; 70:783-92. doi: 10.1001/jamapsychiatry.2013.1328.
26. Tomasi D, Volkow ND. Functional connectivity density mapping. Proc Natl Acad Sci U S A. 2010; 107:9885-90.
27. Tomasi D, Volkow ND. Functional connectivity hubs in the human brain. Neuroimage. 2011; 57:908-17.
28. Tomasi D, Volkow ND. Association between functional connectivity hubs and brain networks. Cereb Cortex. 2011; 21:2003-13.
29. Tomasi D, Shokri-Kojori E, Volkow ND. High-resolution functional connectivity density: hub locations, sensitivity, specificity, reproducibility, and reliability. Cereb Cortex. 2016; 26:3249.
30. Tomasi D, Volkow ND. Aging and functional brain networks. Mol Psychiatry. 2012; 17:471, 549-58.
31. Shokri-Kojori E, Tomasi D, Wiers CE, Wang GJ, Volkow ND. Alcohol affects brain functional connectivity and its coupling with behavior: greater effects in male heavy drinkers. Mol Psychiatry. 2016. Mar 29. doi: 10.1038/mp.2016.25. [Epub ahead of print].
32. Tomasi D, Volkow ND. Abnormal functional connectivity in children with attention-deficit/hyperactivity disorder. Biol Psychiatry. 2012; 71:443-50.
33. Power JD, Barnes KA, Snyder AZ, Schlaggar BL, Petersen SE. Spurious but systematic correlations in functional connectivity MRI networks arise from subject motion. Neuroimage. 2012; 59:2142-54. doi: 10.1016/j.neuroimage.2011.10.018.
34. Wang L, Metzak PD, Honer WG, Woodward TS. Impaired efficiency of functional networks underlying episodic memory-for-context in schizophrenia. J Neurosci. 2010; 30:13171-9. doi: 10.1523/jneurosci.3514-10.2010.
35. Bracht T, Schnell S, Federspiel A, Razavi N, Horn H, Strik W, Wiest R, Dierks T, Muller TJ, Walther S. Altered cortico-basal ganglia motor pathways reflect reduced volitional motor activity in schizophrenia. Schizophr Res. 2013; 143:269-76. doi: 10.1016/j.schres.2012.12.004.
36. Woodward ND, Karbasforoushan H, Heckers S. Thalamocortical dysconnectivity in schizophrenia. Am J Psychiatry. 2012; 169:1092-9.
37. Zhuo C, Zhu J, Wang C, Qu H, Ma X, Tian H, Liu M, Qin W. Brain structural and functional dissociated patterns in schizophrenia. BMC Psychiatry. 2017; 17:45.