
INTRODUCTION
Esophageal cancer (EC) is the eighth most common and the sixth most deadly cancer worldwide [1]. Esophageal adenocarcinoma (EAC) and esophageal squamous cell carcinoma (ESCC) are two major histologic subtypes of EC. EAC is more common in western Europe and north America, whereas ESCC is more prevalent in south-eastern and central Asia, particularly China and Japan [2]. In China alone, 477,900 newly diagnosed EC cases and 375,000 deaths from EC were projected to occur in 2015 [3]. Despite recent advances in combination therapy strategies, including surgery, chemotherapy, and radiotherapy, the prognosis for EC patients remains unsatisfactory, especially for advanced-stage patients, and the 5-year overall survival rate remains at less than 20% [4]. The rapidly increasing incidence, demanding treatment, and poor outcomes of EC highlight the need for effective potential biomarkers for early diagnosis, prognosis prediction, and novel therapeutic targets.
The etiology and pathogenesis of EC involve complicated interactions between epigenetic, genetic, and environmental factors [5–7]. DNA methylation is a common form of epigenetic modification, which has a crucial role in human malignancies, such as breast [8], lung [9], and gastric [10] cancers. Abnormal methylation in the promoter region of tumor suppressor genes is one of the most common mechanisms of modification, and results in target gene transcriptional silencing. Moreover, with the introduction of precise and convenient methods of detection, DNA methylation has become a credible potential biomarker for early detection and diagnosis of cancer [11].
The cyclin-dependent kinase inhibitor 2A (CDKN2A) gene on chromosome 9p21 is a classical tumor suppressor gene [12]. It is responsible for inhibiting various cyclin-dependent kinases and plays an important role in cell cycle regulation by decelerating cell cycle progression at the G1/S phase [13, 14]. Hypermethylation of the CDKN2A gene promoter region, resulting in its inactivation, has been reported in several types of malignancy, including lung [15], head and neck [16], hepatocellular [17], breast [18], and esophageal [19] cancers. Although they have been frequently investigated, the association between CDKN2A promoter methylation and EC and the role of this modification in EC carcinogenesis, remain controversial. For example, one study reported that the methylation rate at the CDKN2A promoter was similar in EC patients and healthy controls [20]; however, another investigation identified a differential frequency of CDKN2A promoter methylation between these two groups [21]. In addition, the value for EC diagnosis of testing for CDKN2A methylation, particularly using blood samples, has been less intensely investigated.
Here, we performed a meta-analysis to generate a quantitative estimate of the association of CDKN2A methylation with EC risk and its role in EC carcinogenesis. Furthermore, we assessed whether there were associations between CDKN2A promoter methylation and the clinical characteristics of EC patients. In addition, we comprehensively evaluated the diagnostic utility of CDKN2A methylation for EC, to assess the future potential applicability of CDKN2A methylation testing for the prevention, diagnosis, and therapy of EC.
RESULTS
Study characteristics
The flow chart of the selection process for inclusion of studies in our analysis is presented in Figure 1. A total of 423 articles were initially identified, with 421 identified by database, and two by manual searching. After a careful initial review of the titles and abstracts, 237 duplicate and 83 irrelevant articles were excluded. Next, we reviewed the full text of the remaining articles. Among these, 61 articles were excluded, since 22 were focused on cell lines or animals trials, three were reviews, and 36 lacked methylation data. Finally, 42 articles including 44 studies (41 case-control and 3 cohort studies) were included in the meta-analysis. The basic characteristics of all eligible studies are presented in Table 1.
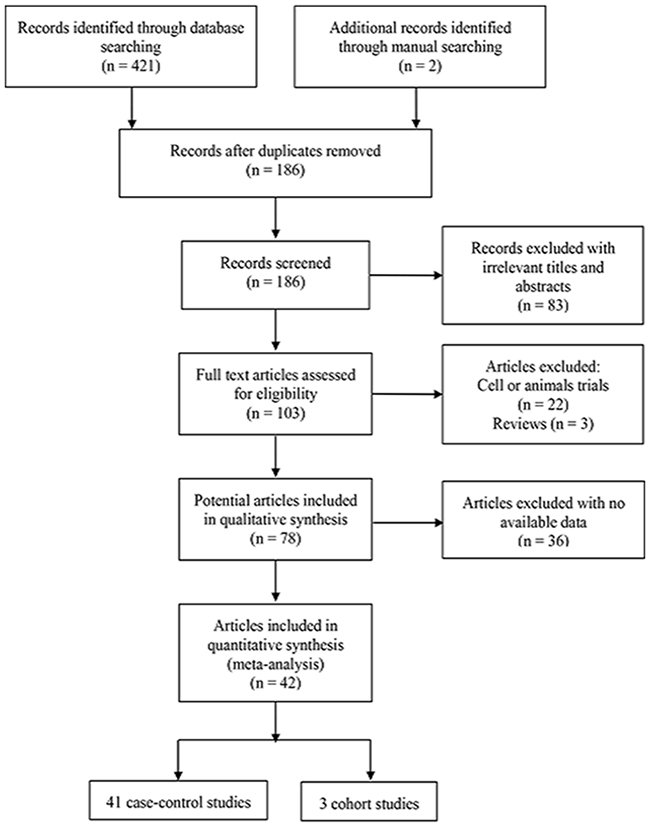
Figure 1: Flow diagram of the study search strategy for this meta-analysis.
Table 1: The main characteristics of studies included in the analysis of the association of CDKN2A promoter methylation with esophageal cancer
First author |
Year |
Country |
Ethnicity |
Method |
Histology |
Type |
Carcinoma |
Normal |
Pre-carcinoma |
||||
|---|---|---|---|---|---|---|---|---|---|---|---|---|---|
M+ |
Total |
M+ |
Total |
Source |
M+ |
Total |
|||||||
Wang |
2011 |
China |
Asian |
MSP |
ESCC |
Tissue |
6 |
13 |
0 |
12 |
H |
14 |
64 |
Song |
2009 |
China |
Asian |
MSP |
ESCC |
Tissue |
41 |
130 |
18 |
260 |
A |
Na |
Na |
Song |
2007 |
China |
Asian |
MSP |
ESCC |
Tissue |
65 |
140 |
31 |
280 |
A |
Na |
Na |
Yan |
2003 |
China |
Asian |
MSP |
ESCC |
Tissue |
5 |
34 |
0 |
6 |
H |
Na |
Na |
Guo |
2008 |
China |
Asian |
MSP |
ESCC |
Tissue |
35 |
51 |
1 |
10 |
H |
18 |
44 |
Yu |
2006 |
China |
Asian |
MSP |
ESCC |
Tissue |
33 |
45 |
26 |
45 |
A |
Na |
Na |
Guo |
2006 |
China |
Asian |
MSP |
ESCC |
Blood |
14 |
51 |
0 |
10 |
H |
0 |
44 |
Zhao |
2011 |
China |
Asian |
MSP |
ESCC |
Tissue |
31 |
71 |
10 |
71 |
A |
Na |
Na |
2 |
71 |
H |
Na |
Na |
|||||||||
Wang |
2012 |
China |
Asian |
qMSP |
ESCC |
Tissue |
66 |
76 |
3 |
76 |
A |
Na |
Na |
Wang |
2012 |
China |
Asian |
qMSP |
ESCC |
Blood |
54 |
76 |
2 |
60 |
H |
Na |
Na |
Yao |
2005 |
China |
Asian |
nMSP |
ESCC |
Blood |
34 |
56 |
0 |
22 |
H |
Na |
Na |
Wang |
1997 |
USA |
Caucasian |
MSP |
EAC |
Tissue |
5 |
11 |
0 |
21 |
A |
3 |
10 |
Kempste |
2000 |
Australia |
Caucasian |
MSP |
ESCC |
Tissue |
3 |
7 |
0 |
7 |
A |
Na |
Na |
EAC |
Tissue |
6 |
9 |
0 |
9 |
A |
Na |
Na |
|||||
Bian |
2002 |
Switzerland |
Caucasian |
MS-SSCA |
EAC |
Tissue |
18 |
22 |
0 |
10 |
H |
10 |
33 |
Nie |
2002 |
China |
Asian |
MSP |
ESCC |
Tissue |
7 |
21 |
0 |
25 |
A |
5 |
13 |
Sarbia |
2004 |
Germany |
Caucasian |
qMSP |
EAC |
Tissue |
27 |
50 |
0 |
50 |
A |
Na |
Na |
Zhang |
2004 |
China |
Asian |
MSP |
ESCC |
Tissue |
5 |
34 |
0 |
6 |
H |
Na |
Na |
Schulmann |
2005 |
USA |
Caucasian |
qMSP |
EAC |
Tissue |
34 |
76 |
2 |
64 |
A |
14 |
93 |
Abbaszadegan |
2005 |
Iran |
Caucasian |
MSP |
ESCC |
Tissue |
22 |
30 |
0 |
30 |
H |
Na |
Na |
Abbaszadegan |
2005 |
Iran |
Caucasian |
MSP |
ESCC |
Blood |
13 |
30 |
0 |
30 |
H |
Na |
Na |
Roth |
2006 |
China |
Asian |
MSP |
ESCC |
Tissue |
5 |
13 |
0 |
11 |
H |
3 |
15 |
Clement |
2006 |
Switzerland |
Caucasian |
MS-SSCA |
EAC |
Tissue |
13 |
27 |
0 |
16 |
H |
Na |
Na |
Guo |
2006 |
China |
Asian |
MSP |
ESCC |
Tissue |
36 |
69 |
0 |
17 |
H |
20 |
60 |
Ishii |
2007 |
Japan |
Asian |
COBRA |
ESCC |
Tissue |
22 |
56 |
18 |
56 |
A |
8 |
21 |
Tissue |
0 |
42 |
H |
Na |
Na |
||||||||
Wang |
2008 |
China |
Asian |
MSP |
ESCC |
Tissue |
110 |
125 |
46 |
125 |
A |
Na |
Na |
Tissue |
0 |
10 |
H |
Na |
Na |
||||||||
Salam |
2009 |
India |
African |
MSP |
ESCC |
Tissue |
36 |
69 |
2 |
69 |
A |
Na |
Na |
Wang |
2009 |
USA |
Caucasian |
MSP |
ESCC |
Tissue |
22 |
41 |
0 |
17 |
H |
33 |
92 |
Ganji |
2010 |
Italy |
Caucasian |
MSP |
ESCC |
Tissue |
12 |
44 |
0 |
19 |
H |
Na |
Na |
Taghavi |
2010 |
Iran |
Caucasian |
MSP |
ESCC |
Tissue |
31 |
50 |
2 |
50 |
A |
Na |
Na |
Lu |
2011 |
China |
Asian |
MSP |
ESCC |
Tissue |
106 |
120 |
46 |
120 |
A |
Na |
Na |
Ikoma |
2007 |
Japan |
Asian |
MSP |
ESCC |
Blood |
6 |
44 |
0 |
12 |
H |
Na |
Na |
1999 |
China |
Asian |
MSRE |
ESCC |
Tissue |
17 |
34 |
3 |
34 |
A |
Na |
Na |
|
Brock |
2003 |
Japan |
Asian |
MSP |
EAC |
Tissue |
16 |
41 |
10 |
41 |
A |
Na |
Na |
Vieth |
2004 |
Germany |
Caucasian |
MSP |
EAC |
Tissue |
8 |
15 |
0 |
15 |
A |
17 |
55 |
Hardie |
2005 |
UK |
Caucasian |
MSP |
EAC |
Tissue |
18 |
21 |
9 |
21 |
H |
14 |
18 |
Li |
2011 |
China |
Asian |
MSP |
ESCC |
Tissue |
21 |
47 |
10 |
47 |
A |
Na |
Na |
Ling |
2010 |
China |
Asian |
MSP |
ESCC |
Tissue |
25 |
50 |
1 |
50 |
H |
10 |
50 |
Chen |
2012 |
China |
Asian |
MSP |
ESCC |
Tissue |
210 |
257 |
75 |
257 |
A |
Na |
Na |
Talukdar |
2013 |
India |
African |
MSP |
ESCC |
Tissue |
42 |
112 |
2 |
30 |
A |
Na |
Na |
Liao |
2009 |
China |
Asian |
MSP |
ESCC |
Tissue |
53 |
105 |
8 |
105 |
A |
Na |
Na |
Hoshimoto |
2015 |
USA |
Caucasian |
qMSP |
ESCC |
Tissue |
27 |
114 |
0 |
28 |
A |
Na |
Na |
Das |
2014 |
India |
African |
MSP |
ESCC |
Blood |
81 |
100 |
Na |
Na |
Na |
Na |
Na |
Ito |
2007 |
Japan |
Asian |
MSP |
ESCC |
Tissue |
29 |
38 |
Na |
Na |
Na |
Na |
Na |
Hibi |
2001 |
Japan |
Asian |
MSP |
ESCC |
Blood |
7 |
31 |
Na |
Na |
Na |
Na |
Na |
M+, positive for CDKN2A methylation; MSP, methylation specific polymerase chain reaction; qMSP, quantitative methylation specific polymerase chain reaction; MSRE, methylation sensitive restriction endonuclease; nMSP, nested methylation specific polymerase chain reaction; MS-SSCA, methylation-sensitive-single-strand conformation analysis; COBRA, combined bisulfite restriction analysis; A, autologous (control sample from the same patients); H, heterogeneous (control samples from other individuals); ESCC, esophageal squamous cell carcinoma; EAC, esophageal adenocarcinoma; Na, not available.
Comparison of the frequency of methylation of the CDKN2A promoter in EC cases and healthy controls
A total of 41 case-control studies, including 2487 EC cases and 2367 healthy controls, were included in the current meta-analysis. Our results indicated that the frequency of methylation of the CDKN2A promoter was significantly higher in EC cases than in healthy controls (odds ratio (OR) = 12.60, 95 % CI = 8.90–17.85; Figure 2A). Meta-regression and subgroup analysis were applied to investigate potential sources of the substantial heterogeneity that was detected among the studies. Although, meta-regression analysis did not identify any obvious source of heterogeneity (Table 2), decreased heterogeneity was observed in several of the subgroup analyses (conducted according to ethnicity, sample source, control type, and detection method; Table 3 ), suggesting that the heterogeneity may derive from multiple sources. Additionally, all subgroups showed that CDKN2A hypermethylation was significantly associated with EC. Moreover, the subgroup analysis showed that the OR of the EAC subgroup (OR = 19.03) was greater than that of the ESCC subgroup (OR = 12.00), and the OR of the Caucasian subgroup (OR = 32.67) was greater than that of the Asian (OR = 9.37) and African subgroups (OR = 17.59), as well as the OR of the blood sample subgroup (OR = 34.98) was greater than that of the tissue sample subgroup (OR = 11.60). To test the robustness of our results, a sensitivity analysis to determine the influence of single studies on overall pooled ORs was performed, and the results supported the stability and credibility of our data (Figure 3A). Application of Begg’s funnel plot analysis indicated no significant publication bias among the studies (P = 0.47; Figure 4A).
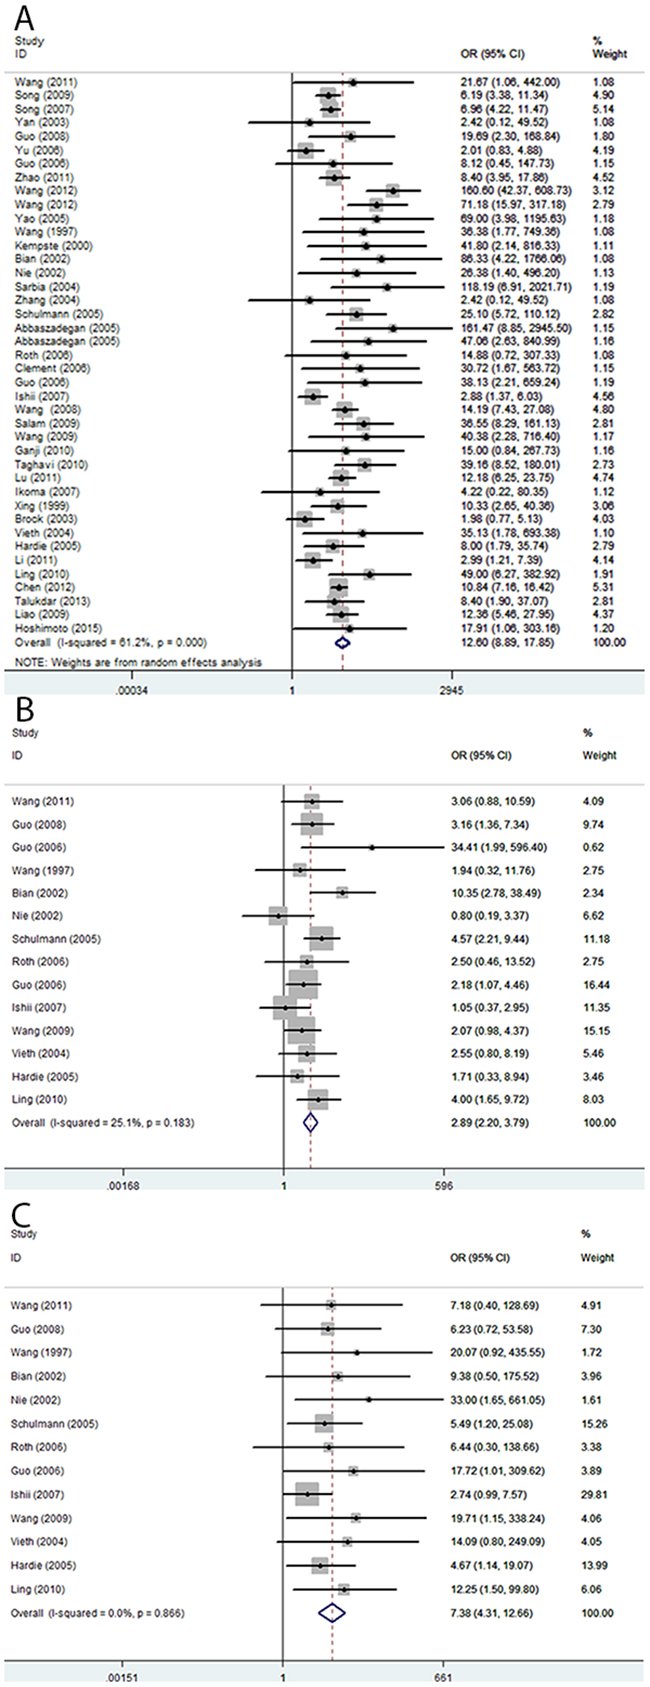
Figure 2: Pooled forest plot of CDKN2A methylation status during the carcinogenesis of esophageal cancer. (A) Cancer vs. controls: OR = 12.60; 95 % CI, 8.90–17.85. (B) Cancer vs. precancerous lesions: OR = 2.89; 95% CI, 2.20–3.79. (C) Precancerous lesions vs. control: OR = 7.38; 95% CI, 4.31–12.66.
Table 2: Meta regression analyses of CDKN2A promoter methylation in esophageal cancer
Heterogeneity source |
Coefficient |
95% CI |
P |
|
|---|---|---|---|---|
Lower |
Upper |
|||
Publication year |
0.031 |
-0.097 |
0.159 |
0.625 |
Sample size |
0.003 |
-0.005 |
0.011 |
0.449 |
Ethnicity |
||||
Asian |
-0.831 |
-2.42 |
0.759 |
0.295 |
Caucasian |
0.672 |
-1.197 |
2.54 |
0.469 |
Detection method |
||||
MSP |
-0.883 |
-1.79 |
0.024 |
0.056 |
Sample source |
||||
Tissue |
-0.248 |
-1.901 |
1.405 |
0.762 |
Histology |
||||
ESCC |
0.721 |
-0.581 |
2.022 |
0.268 |
Control type |
||||
Heterogeneous |
0.64 |
-0.426 |
1.706 |
0.23 |
Table 3: Subgroup analyses of CDKN2A promoter methylation in esophageal cancer
Subgroup |
Case |
Control |
Pooled OR (95% CI) |
Heterogeneity |
|||
|---|---|---|---|---|---|---|---|
M |
U |
M |
U |
I2(%) |
P |
||
Race |
|||||||
African |
259 |
288 |
13 |
374 |
17.59 (6.20–49.94) |
47 |
0.17 |
Caucasian |
1023 |
736 |
310 |
1571 |
32.67 (17.61–60.62) |
0 |
0.93 |
Asian |
78 |
103 |
4 |
95 |
9.37 (6.28–13.99) |
68.7 |
< 0.01 |
Sample source |
|||||||
Tissue |
1239 |
991 |
325 |
1908 |
11.60 (8.14–16.54) |
61.8 |
< 0.01 |
Blood |
121 |
136 |
2 |
132 |
34.98 (12.01–101.85) |
2 |
0.4 |
Histology |
|||||||
ESCC |
1215 |
1000 |
306 |
1814 |
12.00 (8.35–17.26) |
60.9 |
< 0.01 |
EAC |
145 |
127 |
21 |
226 |
19.03 (6.03–60.11) |
62.4 |
< 0.01 |
Control type |
|||||||
Autologous |
1017 |
764 |
312 |
1573 |
9.75 (6.33–15.04) |
75.5 |
< 0.01 |
Heterogeneous |
506 |
452 |
15 |
467 |
28.57 (16.96–48.12) |
0 |
0.69 |
Methods |
|||||||
MSP |
1048 |
852 |
299 |
1610 |
9.67 (5.46–27.95) |
47 |
< 0.01 |
Not MSP |
312 |
275 |
28 |
430 |
31.50 (9.66–102.73) |
78.7 |
< 0.01 |
Sample size |
|||||||
< 60 |
449 |
498 |
80 |
644 |
5.64 (3.078–10.333) |
57.7 |
< 0.01 |
≥ 60 |
911 |
629 |
247 |
1396 |
10.948 (1.247–96.116) |
62.2 |
< 0.01 |
Publication year |
|||||||
< 2010 |
729 |
728 |
174 |
1302 |
10.74 (7.00–16.49) |
54.9 |
< 0.01 |
≥ 2010 |
631 |
399 |
153 |
738 |
16.83 (9.17–30.89) |
68.9 |
< 0.01 |
M, methylated; U, unmethylated.
Comparison of the frequency of methylation of the CDKN2A promoter in EC and precancerous lesions
There were 14 studies involving 510 ECs and 612 precancerous lesions included in this analysis. In the absence of heterogeneity (I2 = 25%, P = 0.183), a fixed-effects model was applied to evaluate the association of between methylation of CDKN2A in EC and precancerous lesions. We observed that the frequency of CDKN2A methylation was significantly higher in EC than precancerous lesion samples (OR = 2.89; 95% CI, 2.20–3.79; Figure 2B). The results of a sensitivity analysis indicated the authenticity of our results (Figure 3B) and a Begg’s test for publication bias was not statistically significant (P = 0.74; Figure 4B)
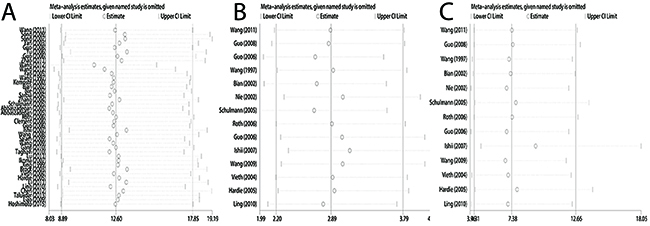
Figure 3: Sensitivity analysis of pooled odds ratios for CDKN2A methylation during the carcinogenesis of esophageal cancer. (A) Cancer vs. controls. (B) Cancer vs. precancerous lesions. (C) Precancerous lesions vs. control.
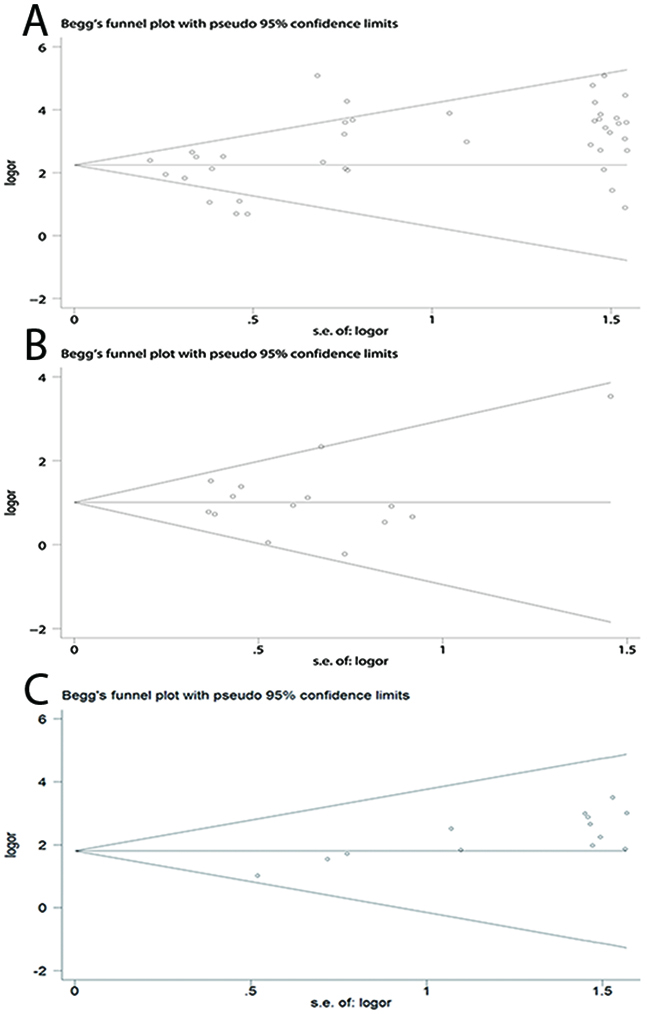
Figure 4: Begg’s funnel plots of publication bias for CDKN2A methylation during the carcinogenesis of esophageal cancer. (A) Cancer vs. controls. (B) Cancer vs. precancerous lesions. (C) Precancerous lesions vs. control.
Comparison of the frequency of methylation of the CDKN2A promoter between precancerous esophageal lesions and healthy controls
The analysis of the association between methylated CDKN2A and esophageal precancerous lesions included 612 precancerosis samples and 381 healthy controls from 14 studies. As demonstrated in Figure 2C, the methylation frequency of CDKN2A was significantly elevated in precancerous lesions compared with controls (OR = 7.38; 95% CI, 4.31–12.66). Sensitivity analysis confirmed the robustness of our results (Figure 3C) and a Begg’s test revealed no publication bias (P > 0.05, Figure 4C).
Association of methylation of the CDKN2A promoter with clinicopathological features of EC
A total of 1313 ECs from 16 studies were used to evaluate the relationships between CDKN2A methylation and clinicopathological features, including age, gender, smoking behavior, alcohol consumption, tumor location, tumor diameter, differentiation grade, tumor stage, clinical stage, and lymph node metastasis (Table 4). Our findings demonstrated that CDKN2A methylation was significantly associated with differentiation grade (poor vs. well and moderate: OR = 1.79; 95% CI, 1.20–2.67; P < 0.01) and clinical stage (advanced vs. early: OR = 2.56; 95% CI, 1.33–4.92; P < 0.01). However, there were no associations between other clinicopathological characteristics and CDKN2A promoter methylation in EC.
Table 4: The association of CDKN2A promoter methylation with clinicopathological features of esophageal cancer patients
Characteristic |
No. |
Case type/control type |
Cases/controls |
OR (95% CI) |
P |
Heterogeneity |
|
|---|---|---|---|---|---|---|---|
I2 (%) |
P |
||||||
Age |
8 |
Older/younger |
259/230 |
0.98 (0.65–1.47) |
0.91 |
0 |
0.45 |
Gender |
12 |
Male/female |
568/259 |
0.97 (0.68–1.38) |
0.84 |
0 |
0.83 |
Smoking behavior |
8 |
Yes/no |
409/354 |
1.10 (0.54–2.28) |
0.79 |
71.2 |
0 |
Alcohol consumption |
5 |
Yes/no |
282/322 |
0.92 (0.47–1.82) |
0.82 |
59.1 |
0.04 |
Differentiation grade |
11 |
Poor/well and moderate |
144/614 |
1.79 (1.20–2.67) |
0 |
25.2 |
0.2 |
T stage |
6 |
T3+4/T1+2 |
409/230 |
0.88 (0.42–1.82) |
0.73 |
68.8 |
0.01 |
Clinical stage |
9 |
III + IV/I+II |
307/288 |
2.56 (1.33–4.92) |
0.01 |
55.9 |
0.02 |
Lymph node metastasis |
8 |
Yes/no |
379/358 |
1.69 (0.76–3.75) |
0.2 |
77.4 |
< 0.01 |
Diameter |
4 |
> 5 cm/< 5 cm |
100/98 |
1.37 (0.74–2.52) |
0.32 |
0 |
0.91 |
Location |
7 |
Up and middle/down |
456/237 |
0.79 (0.54–1.14) |
0.2 |
0 |
0.6 |
No., number of studies.
The accuracy of testing for CDKN2A methylation for EC diagnosis
In the current analysis, the diagnostic value of methylated CDKN2A for EC diagnosis was assessed using data from 41 eligible case-control studies. The pooled sensitivity and specificity values were 0.52 (95% CI, 0.44–0.59) and 0.96 (95% CI, 0.93–0.98), respectively. The area under the summary receiver operating characteristic (SROC) curve (AUC) based on the specificity and sensitivity was 0.83 (95% CI, 0.79–0.86) (Figure 5A). The AUCs based on subgroups where methylation was tested in tissue and blood samples were 0.82 (95% CI, 0.79–0.85) (Figure 5B) and 0.90 (95% CI, 0.87–0.92) (Figure 5C), respectively. As shown in the Figure 6, Fagan plot analysis demonstrated that the probabilities of a patient being diagnosed with EC were 82%, 93%, and 98% following a positive result for methylation of CDKN2A, where the pretest probabilities of being diagnosed with EC were set to 25%, 50%, and 75%, respectively; when the test was negative, the probabilities of diagnosis with EC reduced to 14%, 33%, and 60%, respectively.
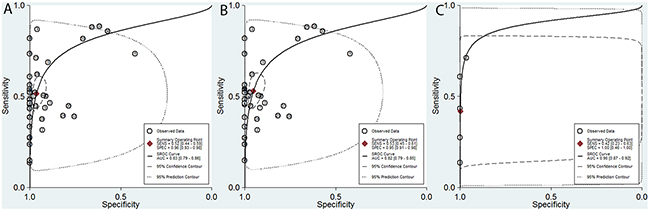
Figure 5: Summary of receiver operating characteristic (SROC) plots of methylated CDKN2A for the diagnosis of esophageal cancer based on all samples, tissue samples, and blood samples. (A) All samples: sensitivity, 0.52 (95% CI, 0.44–0.59); specificity, 0.96 (95% CI, 0.93–0.98); AUC, 0.83 (95% CI, 0.79–0.86). (B) Tissue samples: sensitivity, 0.53 (95% CI, 0.45–0.61); specificity, 0.95 (95% CI, 0.91–0.98); AUC, 0.82 (95% CI, 0.79–0.85). (C) Blood samples: sensitivity, 0.42 (95% CI, 0.23–0.63); specificity, 1.00 (95% CI, 0.46–1.00); AUC, 0.90 (95% CI, 0.87–0.92).
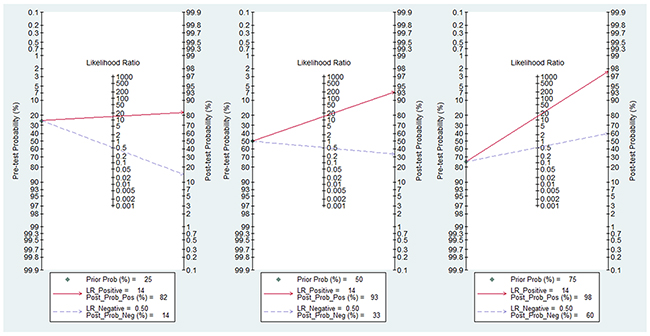
Figure 6: Fagan plot analysis to evaluate the clinical applicability of screening for methylated CDKN2A in esophageal cancer diagnosis. (A) The post-test probability was 82% at a pretest probability of 25%. (B) The post-test probability was 93% at a pretest probability of 50%. (C) The post-test probability was 98% at a pretest probability of 75%.
DISCUSSION
EC is a complex, progressive disease with multiple stages. Barrett’s esophagus (BE), a metaplastic condition where the squamous-lined esophageal mucosa is replaced by specialized intestinal mucosa, and dysplasia, are precursor lesions of EC [2, 22].
Epigenetic modifications, including DNA methylation, contribute significantly to the pathogenesis of EC. DNA methylation is a relatively early molecular change that is a candidate biomarker in several carcinomas [23]. Increasing evidence demonstrates that methylation of the promoter of CDKN2A, an important negative regulator of cell growth and proliferation [24], is involved in the tumorigenesis and progression of various tumors, including pancreatic [25], gastric [26], and prostate [27] cancers. Although there have been several reports that the frequency of CDKN2A promoter methylation is higher in EC samples than those from cancer-free controls, the association and the role of CDKN2A promoter methylation in EC remain controversial. We performed this meta-analysis to address these issues, achieve insights into the role of CDKN2A promoter methylation in EC carcinogenesis, and evaluate its diagnostic value in screening for early stage EC.
The current study incorporated a total of 41 case-control studies, including 2487 ECs, 618 precancerosis (including dysplasia and BE), and 2367 control samples. Our results indicate that the frequency of methylation of the CDKN2A promoter was significantly higher in EC than in healthy controls and precancerous lesions. Moreover, the level of CDKN2A methylation was also remarkably higher in precancerous lesions than in healthy controls. This evidence supports the association of methylated CDKN2A with EC carcinogenesis. Recent research has revealed that ESCC and EAC have different molecular features [28]. In our results, the OR of the association with CDKN2A methylation for the EAC subgroup was greater than that for the ESCC subgroup, indicating that this molecular feature may be more relevant in EAC. The subgroup analysis by ethnicity showed that CDKN2A promoter methylation was associated with an increased risk of EC in Asian and Caucasian, as well as African population, with the Caucasian population showing a higher OR than the Asian and African population, suggesting that the Caucasian population may be more susceptible to CDKN2A promoter methylation. The subgroup analysis of sample source presented a significant correlation between hypermethylated CDKN2A and EC in both tissue and blood samples, and the pooled OR of blood samples was remarkably higher than that of tissue samples, which suggested that hypermethylated CDKN2A may be a useful noninvasive biomarker for blood detection.
Additionally, we evaluated the relationship between CDKN2A methylation and the clinicopathological characteristics of EC. A previous systematic review reported that there was a trend towards increased frequency of CDKN2A methylation according to EC differentiation grade; however, the association was not statistically significant [29]. In contrast, our results indicate that methylation of the CDKN2A promoter is significantly more common among patients with poorly differentiated tumors and advanced clinical stage, compared with those with well/moderately differentiated tumors and early stage disease. Together, these results support the hypothesis that hypermethylation of the CDKN2A promoter is involved in the progression of EC.
We further assessed the diagnostic potential of CDKN2A promoter methylation for EC, based on data from 41 eligible case-control studies. The pooled sensitivity and specificity for all included studies were 0.52 and 0.96, respectively, indicating that CDKN2A promoter methylation could be a useful biomarker for diagnosis of EC. In the current study, we also analyzed SROC and AUC statistics. SROC is a comprehensive index synthesizing sensitivity and specificity, which can be used to evaluate the accuracy of diagnostic tests. The SROC curve and AUC can also be used to evaluate diagnostic power, where an AUC closer to 1.0 signifies that the test has better discrimination. The AUC calculated from all studies included in the current analysis was 0.83, indicating that CDKN2A promoter methylation is an extremely useful biomarker for EC diagnosis. In addition, there is increasing evidence that abnormal DNA methylation in body fluid samples is a promising biomarker for cancer screening and diagnosis [30, 31]. As a relatively noninvasive test, blood sample collection is generally acceptable to patients and is a promising route for clinical application of methylation screening. Previous studies have reported that abnormal DNA methylation markers in blood samples can be used to diagnose various cancers [32, 33]. Our subgroup analysis showed that the AUC value for the blood sample group was 0.9, higher than that for the tissue group (0.82), which are in accordance with numerous previous studies [34]. The existence of cell-free circulating tumor DNA (ctDNA) in blood sample could be responsible for this phenomenon. This form of circulating DNA is presumably shed from tumors, either through necrosis or apoptosis [35]. It has been reported that tumor-derived somatic alterations in DNA can be detected in ctDNA with broad clinical application, high sensitivity, and specificity [36–38]. All these above indicated that testing for CDKN2A methylation in blood samples has potential as a noninvasive tool for the diagnosis of EC. Future rigorous clinical research studies with larger sample sizes will be essential to validate our findings.
The clinical utility of CDKN2A methylation was also evaluated by Fagan plot analysis [39, 40]. The results demonstrated that, when the pre-test probabilities were assumed to be 25%, 50%, and 75%, a corresponding 82%, 93%, and 98% of patients would be correctly diagnosed with EC following positive CDKN2A methylation tests; moreover, a diagnosis of EC could be ruled out for 86%, 67%, and 40% of patients following negative results. These analyses suggest that methylated CDKN2A has good diagnostic power to discriminate patients with EC from healthy individuals.
The present meta-analysis had several limitations. First, only articles published in English and Chinese were included in the study. Second, significant heterogeneity was observed in the current analysis, and its source was not definitively identified. Third, we did not specifically investigate the association of CDKN2A methylation and different EC histology subtypes; therefore, an updated meta-analysis, including more rigorous studies with large sample sizes in the future would support, and could add to the findings of the present study.
In conclusion, our findings provide strong evidence that CDKN2A methylation is involved in the carcinogenesis and progression of EC and that it is a promising biomarker for the diagnosis of EC, especially by screening of blood samples. Future large-scale studies are necessary to support or add to our findings, especially regarding the role of CDKN2A methylation in the prediction of prognosis, and to support the clinical application of our findings for the benefit of patients with EC.
MATERIALS AND METHODS
Literature search
Five electronic databases (including PubMed, Google Scholar, Web of Science, Embase, and China National Knowledge Infrastructure) were searched for eligible studies until October 20, 2016. The following search terms, and various combinations of them, were used: “p16,” “p16INK4a,” “p14arf”, “p14”, “CDKN2A (p16 and p14),” “cyclin-dependent kinase inhibitor 2A,” “methylation,” “DNA methylation,” “promoter methylation,” “esophageal carcinoma,” “esophagus cancer,” “esophageal tumor,” and “esophageal malignancy.” In addition, we performed a manual search of references to find potentially relevant articles.
Selection criteria
We collected all eligible articles that addressed the association between CDKN2A methylation and EC. Articles with data meeting the following criteria were included: (1) all samples confirmed by pathology, including ECs, esophageal precancerous lesions (dysplasia or Barrett’s esophagus), and healthy controls; (2) case-control or cohort studies of CDKN2A promoter methylation in EC; (3) included sufficient data regarding the methylation frequency of the CDKN2A promoter to enable the calculation of odds ratios and 95% confidence intervals; and (4) where authors published several reports using the same population or overlapping data, only the most complete study with the most information was selected.
Data quality assessment
The quality of studies was assessed according to Newcastle–Ottawa Scale (NOS) criteria [41]. The NOS evaluation system includes three aspects: (1) subject selection: 0–4 points; (2) comparability of subjects: 0–2 points; and (3) clinical outcome: 0–3 points. NOS scores range from 0 to 9; and a score ≥ 7 indicates good quality. Only studies with scores ≥ 7 were included in the analysis.
Data extraction
Three authors (QL, JL, and CZ) independently reviewed all the available articles and extracted relevant data from eligible articles. The following information was recorded: the first author’s name; the country, ethnicity of subjects, year of publication, sample type, number of cases, control type, and detection method of methylation of the study; and the methylation frequency of CDKN2A, and clinicopathological parameters (including age, gender, smoking behavior, alcohol consumption, tumor location, tumor diameter, differentiation grade, tumor stage, clinical stage and lymph node metastasis) of the subjects. Inconsistent information was discussed by all authors and a consensus reached on its use.
Statistical analyses
Data were analyzed using Stata statistical software, version 12.0 (Stata Corporation, College Station, TX, USA). Overall odds ORs and corresponding 95% CIs were calculated to evaluate the strengths of the associations between CDKN2A methylation and different EC pathological processes (cancer vs. healthy control, cancer vs. precancerous lesion, precancerous lesion vs. healthy control), as well as clinicopathological features. Potential heterogeneity was quantified using Cochran’s Q statistic and I2 tests [42]. When significant heterogeneity was observed among studies, a random-effects model (DerSimonian-Laird method) [43] was applied to calculate a pooled OR (I2 > 50% or P < 0.05), otherwise, a fixed-effects model (Mantel–Haenszel method) was used [44]. Meta-regression and subgroup analyses were performed to explore the sources of heterogeneity. Sensitivity analyses were conducted to determine the influence of individual studies on the pooled results, through the omission of single studies [45]. Publication bias was quantitatively assessed using Begg’s linear regression tests [46]. Pooled sensitivity and specificity were used to estimate the diagnostic efficacy of testing for CDKN2A promoter methylation. Two indicators, the SROC and AUC, were also calculated to evaluate the stability and accuracy of the diagnostic capacity of CDKN2A promoter methylation for EC [47]. Fagan plot analysis was performed with 25%, 50%, and 75% pre-test probability to assess the diagnostic power of CDKN2A promoter methylation in clinical practice [39]. All P values are two-sided and P values < 0.05 were considered statistically significant.
Abbreviations
EC: esophageal cancer
EAC: esophageal adenocarcinoma
ESCC: esophageal squamous cell carcinoma
BE: Barrett’s esophagus
CDKN2A: cyclin-dependent kinase inhibitor 2A
SROC: summary receiver operating characteristic
AUC: the area under the SROC
NOS: the Newcastle–Ottawa Scale
OR: odds ratio
CI: confidence interval
Author contributions
Conceived and designed the experiments: JL and QL. Performed the experiments: JL and CZ. Analyzed the data: JL, CZ, and QL. Contributed analysis tools: JL and CZ. Wrote the manuscript: JL and CZ.
ACKNOWLEDGMENTS
This research was supported by grants from the Medical and Health Research Project of Zhejiang Province (No. 2013KYB231; No. 2014KYB229), Medical Association Clinical Research Project Funding of Zhejiang Province (No. 2015ZYC-A49), and Ningbo Natural Science Foundation (No. 2015A610221).
CONFLICTS OF INTEREST
None of the authors has any commercial or other associations that might pose a conflicts of interest.
REFERENCES
1. Ferlay J, Soerjomataram I, Dikshit R, Eser S, Mathers C, Rebelo M, Parkin DM, Forman D, Bray F. Cancer incidence and mortality worldwide: sources, methods and major patterns in GLOBOCAN 2012. Int J Cancer. 2015; 136:E359-386.
2. Arnold M, Soerjomataram I, Ferlay J, Forman D. Global incidence of oesophageal cancer by histological subtype in 2012. Gut. 2015; 64:381-387.
3. Chen W, Zheng R, Baade PD, Zhang S, Zeng H, Bray F, Jemal A, Yu XQ, He J. Cancer statistics in China, 2015. CA Cancer J Clin. 2016; 66:115-132.
4. Rutegard M, Charonis K, Lu Y, Lagergren P, Lagergren J, Rouvelas I. Population-based esophageal cancer survival after resection without neoadjuvant therapy: an update. Surgery. 2012; 152:903-910.
5. Blot WJ. Esophageal cancer trends and risk factors. Semin Oncol. 1994; 21:403-410.
6. Gao YT, McLaughlin JK, Blot WJ, Ji BT, Benichou J, Dai Q, Fraumeni JF Jr. Risk factors for esophageal cancer in Shanghai, China. I. Role of cigarette smoking and alcohol drinking. Int J Cancer. 1994; 58:192-196.
7. Gao YT, McLaughlin JK, Gridley G, Blot WJ, Ji BT, Dai Q, Fraumeni JF Jr. Risk factors for esophageal cancer in Shanghai, China. II. Role of diet and nutrients. Int J Cancer. 1994; 58:197-202.
8. Wu L, Shen Y, Peng X, Zhang S, Wang M, Xu G, Zheng X, Wang J, Lu C. Aberrant promoter methylation of cancer-related genes in human breast cancer. Oncol Lett. 2016; 12:5145-5155.
9. Kajiura K, Masuda K, Naruto T, Kohmoto T, Watabnabe M, Tsuboi M, Takizawa H, Kondo K, Tangoku A, Imoto I. Frequent silencing of the candidate tumor suppressor TRIM58 by promoter methylation in early-stage lung adenocarcinoma. Oncotarget. 2017; 8:2890-2905. doi: 10.18632/oncotarget.13761.
10. Wang N, Sui F, Ma J, Su X, Liu J, Yao D, Shi B, Hou P, Yang Q. Site-specific hypermethylation of RUNX3 predicts poor prognosis in gastric cancer. Arch Med Res. 2016; 47:285-292.
11. Arantes LM, de Carvalho AC, Melendez ME, Carvalho AL, Goloni-Bertollo EM. Methylation as a biomarker for head and neck cancer. Oral Oncol. 2014; 50:587-592.
12. Nakashima R, Fujita M, Enomoto T, Haba T, Yoshino K, Wada H, Kurachi H, Sasaki M, Wakasa K, Inoue M, Buzard G, Murata Y. Alteration of p16 and p15 genes in human uterine tumours. Br J Cancer. 1999; 80:458-467.
13. Kamb A, Gruis NA, Weaver-Feldhaus J, Liu Q, Harshman K, Tavtigian SV, Stockert E, Day RS 3rd, Johnson BE, Skolnick MH. A cell cycle regulator potentially involved in genesis of many tumor types. Science. 1994; 264:436-440.
14. Serrano M, Hannon GJ, Beach D. A new regulatory motif in cell-cycle control causing specific inhibition of cyclin D/CDK4. Nature. 1993; 366:704-707.
15. Tam KW, Zhang W, Soh J, Stastny V, Chen M, Sun H, Thu K, Rios JJ, Yang C, Marconett CN, Selamat SA, Laird-Offringa IA, Taguchi A, et al. CDKN2A/p16 inactivation mechanisms and their relationship to smoke exposure and molecular features in non-small-cell lung cancer. J Thorac Oncol. 2013; 8:1378-1388.
16. Pierini S, Jordanov SH, Mitkova AV, Chalakov IJ, Melnicharov MB, Kunev KV, Mitev VI, Kaneva RP, Goranova TE. Promoter hypermethylation of CDKN2A, MGMT, MLH1, and DAPK genes in laryngeal squamous cell carcinoma and their associations with clinical profiles of the patients. Head Neck. 2014; 36:1103-1108.
17. Csepregi A, Ebert MP, Rocken C, Schneider-Stock R, Hoffmann J, Schulz HU, Roessner A, Malfertheiner P. Promoter methylation of CDKN2A and lack of p16 expression characterize patients with hepatocellular carcinoma. BMC Cancer. 2010; 10:317.
18. Sinha S, Chunder N, Mukherjee N, Alam N, Roy A, Roychoudhury S, Kumar Panda C. Frequent deletion and methylation in SH3GL2 and CDKN2A loci are associated with early- and late-onset breast carcinoma. Ann Surg Oncol. 2008; 15:1070-1080.
19. Ito S, Ohga T, Saeki H, Watanabe M, Kakeji Y, Morita M, Yamada T, Maehara Y. Promoter hypermethylation and quantitative expression analysis of CDKN2A (p14ARF and p16INK4a) gene in esophageal squamous cell carcinoma. Anticancer Res. 2007; 27:3345-3353.
20. Zhang F, Wang L, Wu PP, Yan ZW, Zheng L, Yu YY, Jiang XC. In situ analysis of p16/INK4 promoter hypermethylation in esophageal carcinoma and gastric carcinoma. Chin J Dig Dis. 2004; 5:149-155.
21. Abbaszadegan MR, Raziee HR, Ghafarzadegan K, Shakeri MT, Afsharnezhad S, Ghavamnasiry MR. Aberrant p16 methylation, a possible epigenetic risk factor in familial esophageal squamous cell carcinoma. Int J Gastrointest Cancer. 2005; 36:47-54.
22. Kaz AM, Wong CJ, Varadan V, Willis JE, Chak A, Grady WM. Global DNA methylation patterns in Barrett's esophagus, dysplastic Barrett's, and esophageal adenocarcinoma are associated with BMI, gender, and tobacco use. Clin Epigenetics. 2016; 8:111.
23. Trujillo KA, Jones AC, Griffith JK, Bisoffi M. Markers of field cancerization: proposed clinical applications in prostate biopsies. Prostate Cancer. 2012; 2012:302894.
24. Foulkes WD, Flanders TY, Pollock PM, Hayward NK. The CDKN2A (p16) gene and human cancer. Mol Med. 1997; 3:5-20.
25. Tang B, Li Y, Qi G, Yuan S, Wang Z, Yu S, Li B, He S. Clinicopathological significance of CDKN2A promoter hypermethylation frequency with pancreatic cancer. Sci Rep. 2015; 5:13563.
26. Peng D, Zhang H, Sun G. The relationship between P16 gene promoter methylation and gastric cancer: a meta-analysis based on Chinese patients. J Cancer Res Ther. 2014; 10:292-295.
27. Jiang D, Shen Y, Dai D, Xu Y, Xu C, Zhu H, Huang T, Duan S. Meta-analyses of methylation markers for prostate cancer. Tumour Biol. 2014; 35:10449-10455.
28. Cancer Genome Atlas Research Network, Analysis Working Group: Asan University, BC Cancer Agency; Brigham and Women’s Hospital, Broad Institute; Brown University, Case Western Reserve University, Dana-Farber Cancer Institute, Duke University, Greater Poland Cancer Centre, Harvard Medical School, Institute for Systems Biology, KU Leuven, et al. Integrated genomic characterization of oesophageal carcinoma. Nature. 2017; 541:169-175.
29. Xu R, Wang F, Wu L, Wang J, Lu C. A systematic review of hypermethylation of p16 gene in esophageal cancer. Cancer Biomark. 2013; 13:215-226.
30. Kim Y, Kim DH. CpG island hypermethylation as a biomarker for the early detection of lung cancer. Methods Mol Biol. 2015; 1238:141-171.
31. Parikh RB, Prasad V. Blood-based screening for colon cancer: a disruptive innovation or simply a disruption? JAMA. 2016; 315:2519-2520.
32. Shan M, Yin H, Li J, Li X, Wang D, Su Y, Niu M, Zhong Z, Wang J, Zhang X, Kang W, Pang D. Detection of aberrant methylation of a six-gene panel in serum DNA for diagnosis of breast cancer. Oncotarget. 2016; 7:18485-18494. doi: 10.18632/oncotarget.7608.
33. Yang Q, Huang T, Ye G, Wang B, Zhang X. Methylation of SFRP2 gene as a promising noninvasive biomarker using feces in colorectal cancer diagnosis: a systematic meta-analysis. Sci Rep. 2016; 6:33339.
34. He K, Zhang L, Long X. Quantitative assessment of the association between APC promoter methylation, breast cancer. Oncotarget. 2016; 7:37920-37930. doi: 10.18632/oncotarget.9354.
35. Aravanis AM, Lee M, Klausner RD. Next-generation sequencing of circulating tumor DNA for early cancer detection. Cell. 2017; 168:571-574.
36. Bettegowda C, Sausen M, Leary RJ, Kinde I, Wang Y, Agrawal N, Bartlett BR, Wang H, Luber B, Alani RM, Antonarakis ES, Azad NS, Bardelli A, et al. Detection of circulating tumor DNA in early- and late-stage human malignancies. Sci Transl Med. 2014; 6:224ra224.
37. Fernandez-Cuesta L, Perdomo S, Avogbe PH, Leblay N, Delhomme TM, Gaborieau V, Abedi-Ardekani B, Chanudet E, Olivier M, Zaridze D, Mukeria A, Vilensky M, Holcatova I, et al. Identification of circulating tumor DNA for the early detection of small-cell lung cancer. EBioMedicine. 2016; 10:117-123.
38. Sozzi G, Conte D, Mariani L, Lo Vullo S, Roz L, Lombardo C, Pierotti MA, Tavecchio L. Analysis of circulating tumor DNA in plasma at diagnosis and during follow-up of lung cancer patients. Cancer Res. 2001; 61:4675-4678.
39. Fagan TJ. Letter: nomogram for Bayes theorem. N Engl J Med. 1975; 293:257.
40. Hellmich M, Lehmacher W. A ruler for interpreting diagnostic test results. Methods Inf Med. 2005; 44:124-126.
41. Stang A. Critical evaluation of the Newcastle-Ottawa scale for the assessment of the quality of nonrandomized studies in meta-analyses. Eur J Epidemiol. 2010; 25:603-605.
42. Zintzaras E, Ioannidis JP. HEGESMA: genome search meta-analysis and heterogeneity testing. Bioinformatics. 2005; 21:3672-3673.
43. DerSimonian R, Laird N. Meta-analysis in clinical trials revisited. Contemp Clin Trials. 2015; 45:139-145.
44. Mantel N, Haenszel W. Statistical aspects of the analysis of data from retrospective studies of disease. J Natl Cancer Inst. 1959; 22:719-748.
45. Lau J, Ioannidis JP, Schmid CH. Quantitative synthesis in systematic reviews. Ann Intern Med. 1997; 127:820-826.
46. Peters JL, Sutton AJ, Jones DR, Abrams KR, Rushton L. Comparison of two methods to detect publication bias in meta-analysis. JAMA. 2006; 295:676-680.
47. Deville WL, Buntinx F, Bouter LM, Montori VM, de Vet HC, van der Windt DA, Bezemer PD. Conducting systematic reviews of diagnostic studies: didactic guidelines. BMC Med Res Methodol. 2002; 2:9.