
INTRODUCTION
Biliary tract cancers (BTCs) are relatively rare tumors comprising intrahepatic cholangiocarcinoma (ICC), gallbladder cancer (GB Ca), extrahepatic biliary tract cancer (extrahepatic BTC) and ampulla of Vater cancer (AoV Ca) [1]. BTCs are associated with poor prognoses and significant cachexia [2].
Cachexia is a multi-organ syndrome associated anorexia, inflammation and increased muscle protein breakdown that cannot be fully reversed by nutritional support, and leads to progressive functional impairment [3, 4]. Cachexia is associated with reduced tolerance to anticancer therapy and reduced survival [5, 6]. Historically, cachexia has been defined by weight loss [7]. Weight loss during chemotherapy is associated with reduced response rates and increased toxicity [5]. However, body weight measurement may be underestimated in patients who have gained weight because of edema or tumor mass [3, 8]. Likewise, body mass index (BMI) is used clinically to define underweight and cachexia [9]. However, because obesity is now prevalent in industrialized nations, it may be unclear whether cancer patients with a BMI < 20 are cachectic [10]. Thus, cancer cachexia is a complex condition that is not yet fully defined [11].
Recently, low skeletal muscle mass (with or without loss of fat mass) – the concept of body composition –has been considered a main characteristic of cancer cachexia [12]. Several reports have shown low skeletal muscle mass as an independent poor prognostic factor for survival in patients with various cancers [13–15]. Furthermore, low skeletal muscle mass obesity is known to be a poor risk factor in several cancers in which loss of skeletal muscle and gain of adipose tissue can occur simultaneously [16, 17]. In addition, a recent report described that weight loss and muscle depletion share a poor prognosis [17]. Considering the above, recently, weight loss, body mass index (BMI) and low skeletal muscle mass the basis of the cancer cachexia definition.
In BTC, preoperative low skeletal muscle mass is closely related to mortality after resection [18, 19]. However, to date, reports on low skeletal muscle mass as a prognostic factor in advanced BTC are rare. Furthermore, to our knowledge, no study to date has investigated the dynamics of body weight and body muscle mass in advanced BTC patients undergoing palliative chemotherapy.
Hence, we investigated whether low skeletal muscle mass upon diagnosis and loss of skeletal muscle during palliative chemotherapy were associated with survival in patients with BTC. We also co-analyzed the dynamics of body weight and muscle depletion.
RESULTS
Patient characteristics
Of 598 initially-identified consecutive advanced BTC patients, this study included 524 patients with adequate CT images or existing BMI data undergoing palliative chemotherapy. The clinical characteristics of enrolled patients at initial assessment are shown according to sex in Table 1. The median age was 61 years (range, 26–87 years). There were 231 patients with ICC (44.1%), 162 patients with GB Ca (30.9%), 72 with extrahepatic BTC (13.7%), and 59 with AoV Ca (11.3%). Thirty-nine and nine tenths of a percent of patients were treated with gemcitabine/platinum, 37.6 % with 5-FU/platinum chemotherapy. The chemotherapies used are described in Supplementary Table 1.
Table 1: Clinical characteristics of patients
Characteristics |
Men (N = 344) |
Women (N = 180) |
Total (N = 524) |
p value men vs women |
||||
|---|---|---|---|---|---|---|---|---|
N |
% |
N |
% |
N |
% |
|||
Age (years) |
mean |
61 |
61 |
61 |
0.920b |
|||
SD |
9.5 |
9.2 |
9.4 |
|||||
Primary tumor site |
< 0.001a |
|||||||
ICC |
178 |
51.7% |
53 |
29.4% |
231 |
44.1 % |
||
GB Ca |
82 |
23.8% |
80 |
44.4% |
162 |
30.9 % |
||
Extrahepatic BTC |
49 |
14.2% |
23 |
12.8% |
72 |
13.7 % |
||
AoV Ca |
35 |
10.2% |
24 |
13.3% |
59 |
11.3 % |
||
ECOG PS |
0–1 |
264 |
90.7% |
140 |
84.8% |
404 |
88.6 % |
0.066a |
≥ 2 |
27 |
9.3% |
25 |
15.2% |
52 |
11.4 % |
||
SMI at diagnosis, Cm2/m2 |
Mean |
48.58 |
41.24 |
46.02 |
< 0.001b |
|||
SD |
7.74 |
7.39 |
8.38 |
|||||
Low skeletal muscle mass |
Yes |
150 |
51.0 % |
62 |
39.5% |
212 |
47.0 % |
0.023 a |
No |
144 |
49.0 % |
95 |
60.5% |
239 |
53.0 % |
||
BMI at diagnosis, kg/m2 |
Mean |
22.4 |
23.1 |
22.73 |
0.320 c |
|||
SD |
2.94 |
2.83 |
2.91 |
|||||
BMI at diagnosis |
< 20 kg/m2 |
64 |
18.9 % |
18 |
10.4 % |
82 |
16.1 % |
0.042 a |
20–24.9 kg/m2 |
202 |
59.8 % |
110 |
64.0 % |
312 |
61.2 % |
||
> 25 kg/m2 |
72 |
21.3 % |
44 |
25.6 % |
116 |
22.7 % |
||
Disease status |
Locally advanced |
98 |
28.5 % |
66 |
36.7 % |
164 |
31.3 % |
0.060 |
Metastatic |
246 |
71.5 % |
114 |
63.3 % |
360 |
68.7 % |
||
Sites of metastases |
Lymph Node |
182 |
52.9 % |
113 |
62.8 % |
295 |
56.3% |
0.033 |
Liver |
161 |
46.8 % |
89 |
49.4 % |
250 |
47.7 % |
0.582 |
|
Peritoneum |
114 |
33.1 % |
52 |
28.9 % |
166 |
31.7 % |
0.374 |
|
Lung |
39 |
11.3 % |
19 |
10.6 % |
58 |
11.1 % |
0.884 |
|
Bone |
17 |
4.9 % |
7 |
3.9 % |
24 |
4.6 % |
0.665 |
|
ICC, intrahepatic cholangiocarcinoma;GB Ca, gallbladder cancer;extrahepatic BTC, extrahepatic biliary tract cancer;AoV Ca, ampulla of Vater cancer; ECOG PS, Eastern Cooperative Oncology Group performance status; BMI, body mass index; SMI, skeletal muscle index
† Low skeletal muscle mass: males < 48.5 cm2/m2, females < 39.5 cm2/m2.
ap values were calculated using the Fisher exact test.
bp values were calculated using the Mann-Whitney U test.
cp values were calculated using the independent t-test.
The cutoff values for low skeletal muscle mass as determined via ROC curves were < 48.5 cm2/m2 for men and < 39.5 cm2/m2 for women (Figure 1).
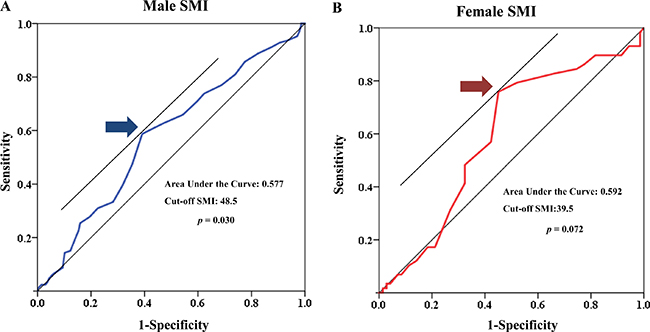
Figure 1: Receiver operating characteristic (ROC) curve of low muscle mass for both sexes.
Body composition
There were no significant differences in mean BMI values or the distribution of patients in BMI subgroups based on sex. The proportion of overweight or obese (BMI ≥ 25 kg/m2) men and women was 21.3% and 25.6%, respectively.
The mean SMI values (± SD) for men and women were 48.58 ± 7.74 cm2/m2 and 41.24 ± 7.39 cm2/m2, respectively (p < 0.001). Additionally, there were significant differences in the distributions of men and women in SMI subgroups (p = 0.023). The proportion of patients with low skeletal muscle mass upon diagnosis was 51.0% and 39.5% for men and women, respectively (Table 1). The distribution of low skeletal muscle mass was broader in men. There were 16 (3.1%) patients with low skeletal muscle mass and obesity (overweight or obese patients with low skeletal muscle mass) and 55 (10.5%) with obvious cachexia (BMI < 20 kg/m2 with low skeletal muscle mass; Supplementary Table 2). SMI upon diagnosis was significantly correlated with BMI upon diagnosis in both sexes (Pearson r = 0.449, p < 0.001 for all the patients; males, r = 0.593, p < 0.001; females, r = 0.381, p < 0 .001; Figure 2).
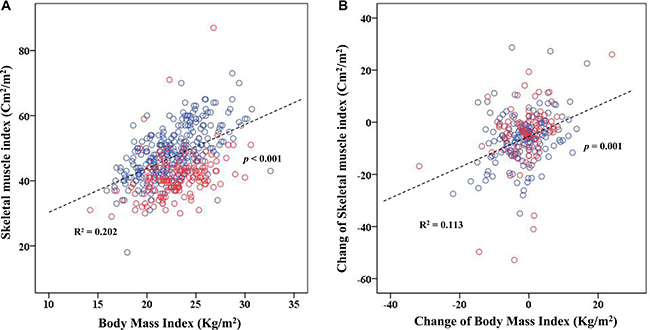
Figure 2: Scatter plot for skeletal muscle index (SMI) and body mass index (BMI). (A) Relationship between SMI and BMI. (Pearson r = 0.449, p < 0.001 for all patients; men, r = 0.593, p < 0.001; women, r = 0.381, p < 0 .001). (B) Relationship between changes in SMI and BMI. (Pearson r = 0.336, p < 0.001 for all patients; men, r = 0.328, p < 0.001; women, r = 0.349, p = 0.001).
During palliative chemotherapy, mean BMI and SMI losses were 1.63 Kg/m2 and 5.35 cm2/m2, respectively (Table 2). Mean BMI loss was not significantly different between men and women (p = 0.109). However, mean SMI loss was significantly greater in men than in women (5.72 cm2/m2 vs 4.61 cm2/m2; p = 0.031).
Table 2: Changes in body composition during palliative chemotherapy
Characteristics |
Men |
Women |
Total |
p value |
|||
|---|---|---|---|---|---|---|---|
N |
% |
N |
% |
N |
% |
||
Change in BMI Mean |
−1.95 |
−1.021 |
−1.63 |
0.109b |
|||
Kg/m2 (%) SD |
6.36 |
7.01 |
6.59 |
||||
Change in BMI |
0.518a |
||||||
Decreased |
35 |
17.7% |
15 |
14.4% |
|||
Maintained |
163 |
82.3% |
89 |
85.6% |
|||
Change in SMI Mean |
−5.72 |
−4.61 |
−5.35 |
0.031b |
|||
Cm2/m2 (%) SD |
9.52 |
12.02 |
10.40 |
||||
Change in SMI |
0.197a |
||||||
Decreased |
75 |
37.5% |
29 |
29.6% |
|||
Maintained |
125 |
62.5% |
69 |
70.4% |
|||
BMI, body mass index; SMI, skeletal muscle index; SD, standard deviation.
†Change in BMI: maintained ≥ −7% kg/m2, decreased < −7% kg/m2
‡Change in SMI: maintained ≥ −7 % cm2/m2; decreased < −7 %cm2/m2.
ap values were calculated using the Fisher exact test.
bp values were calculated using the Mann-Whitney U test.
Factors related to a decrease in skeletal muscle index during chemotherapy
Logistic regression analysis revealed that primary tumor origin, ECOG and decreased BMI during chemotherapy were significantly associated with decreased SMI during chemotherapy (Supplementary Tables 3 and 4).
Treatment outcome and factors related to overall survival
Median OS and PFS of all patients were 9.00 months (95% CI, 8.31–9.69 months) and 4.30 months (95% CI, 3.88–4.72 months), respectively. The objective response and disease control rates were 19.5% and 68.6%, respectively.
Table 3 shows the effects of multiple clinical factors on OS. Via multivariate analysis, low skeletal muscle mass (HR, 1.569; 95% CI, 1.127–2.186; p = 0.008; Figure 3A) and decreased SMI (HR, 2.580; 95% CI, 1.860–3.579; p < 0.001; Figure 4D) were associated with poor survival. However, BMI upon initial diagnosis and decreased BMI were not related to OS (Figure 4A).
Table 3: Factors associated with OS
Univariate analysis |
Mutivariate |
||||||
|---|---|---|---|---|---|---|---|
OS , months |
95% CI |
p value |
HR |
95% CI |
p value |
||
Gender |
Male |
9.00 |
8.110–9.890 |
0.837 |
1 |
0.793 |
|
Female |
9.00 |
8.039–9.961 |
0.955 |
0.679–1.345 |
|||
Age |
< 60 |
10.00 |
9.123–10.877 |
0.033 |
1 |
0.192 |
|
≥ 60 |
8.00 |
7.142–8.858 |
1.223 |
0.904–1.654 |
|||
Primary tumor site |
0.106 |
0.086 |
|||||
ICC |
9.00 |
7.993–10.007 |
1 |
||||
GB Ca |
9.00 |
7.924–10.076 |
0.937 |
0.659–1.334 |
0.720 |
||
Extrahepatic BTC |
9.00 |
7.829–10.171 |
0.683 |
0.440–1.060 |
0.089 |
||
AoV Ca |
12.00 |
8.863–15.137 |
0.559 |
0.328–0.951 |
0.032 |
||
ECOG PS |
0–1 |
10.00 |
9.186–10.814 |
< 0.001 |
1 |
0.445 |
|
≥ 2 |
5.00 |
3.647–6.353 |
1.261 |
0.695 –2.287 |
|||
1stchemotherapy |
Gemcitabine- platinum |
8.67 |
7.422–9.911 |
0.085 |
1 |
0.399 |
|
FU- platinum |
9.40 |
8.371–10.429 |
0.826 |
0.604 –1.131 |
0.234 |
||
Others |
8.53 |
7.591–9.476 |
1.081 |
0.657 –1.778 |
0.759 |
||
Extended status |
Locally advanced |
8.73 |
7.94–9.523 |
0.945 |
1 |
0.991 |
|
Metastasis |
8.90 |
0.998 |
0.716–1.391 |
||||
Low skeletal muscle mass |
Yes |
7.00 |
6.003–7.997 |
< 0.001 |
1.569 |
1.127–2.186 |
0.008 |
No |
11.00 |
10.007–11.993 |
1 |
||||
BMI at diagnosis |
0.345 |
0.031 |
|||||
< 20 kg/m2 |
8.00 |
6.338–9.662 |
1 |
||||
20–24.9 kg/m2 |
9.00 |
8.067–9.933 |
0.701 |
0.453–1.084 |
0.110 |
||
> 25 kg/m2 |
9.00 |
7.879–10.121 |
1.162 |
0.679–1.989 |
0.585 |
||
Change in BMI |
Decreased |
8.00 |
6.594–9.406 |
0.003 |
1.402 |
0.920–2.138 |
0.116 |
Maintained |
10.00 |
8.909–11.091 |
1 |
||||
Change in SMI |
Decreased |
7.00 |
6.291–7.709 |
< 0.001 |
2.580 |
1.860–3.579 |
< 0.001 |
Maintained |
12.00 |
10.776–13.224 |
1 |
||||
Best response |
Controlled |
11.00 |
10.007–11.993 |
< 0.001 |
1 |
< 0.001 |
|
Progression |
6.00 |
5.335–6.665 |
2.647 |
1.908–3.672 |
|||
ICC, intrahepatic cholangiocarcinoma;GB Ca, gallbladder cancer;extrahepatic BTC, extrahepatic biliary tract cancer;AoV Ca, ampulla of Vater cancer; ECOG PS, Eastern Cooperative Oncology Group performance status; BMI, body mass index; SMI, skeletal muscle index; OS, overall survival; HR, hazard ratio; CI, confidential interval. † controlled: complete response, partial response, and stable disease.
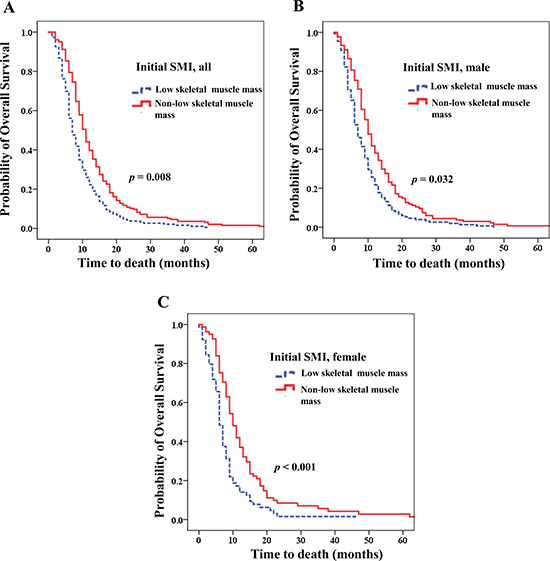
Figure 3: Overall survival according to skeletal muscle index (SMI). Initial low skeletal muscle mass was related to poorer prognosis (A) for the entire patient population (Hazard ratio (HR) 1.569; p = 0.008); (B) for men (HR 1.511; p = 0.032); (C) for women (HR 4.042; p < 0.001).
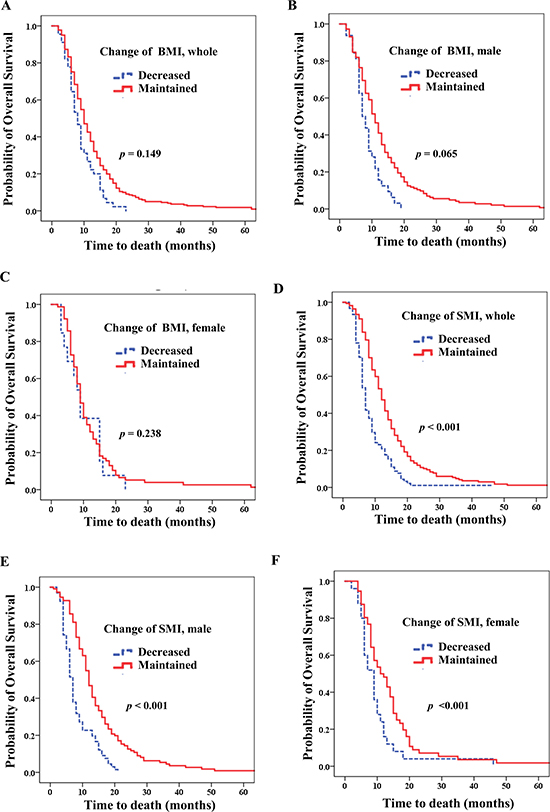
Figure 4: Overall survival according to change in body mass index (BMI) and skeletal muscle index (SMI). Decrease in BMI (A) for the entire patient population (Hazard ratio (HR) 1.402; p = 0.116); (B) for men (HR 1.584; p = 0.065); (C) for women (HR 0.571; p = 0.238). Decrease in SMI (D) for the entire patient population (HR 2.580; p < 0.001); (E) for men (HR 2.370; p < 0.001); (F) for women (HR 4.042; p < 0.001).
For men, low skeletal muscle mass (median OS of 7.0 vs 10.0 months; HR 1.511; 95% CI, 1.037–2.200; p = 0.032; Figure 3B) and decreased SMI (median OS of 7.0 vs 12.0 months; HR, 2.370, 95% CI, 1.603–3.504; p < 0.001; Figure 4E) were strongly related to poorer prognosis. Additionally, patients who were overweight upon diagnosis (median OS 8.0 vs 9.0 months; p = 0.029) showed poorer prognoses than those who were normal weight. However, decreased BMI did not influence OS (p = 0.065; Figure 4B).
For women, both low skeletal muscle (median OS 6.00 vs 11.00 months; HR,4.042; 95% CI, 2.007–8.140; p < 0.001; Figure 3C) and decreased SMI (median OS 9.00 vs 11.00 months; HR, 4.042; 95% CI, 2.007–8.140; p < 0.001; Figure 4F) were significantly associated with poorer prognosis. However, BMI upon diagnosis and decreased BMI were not related to OS (p = 0.207 and 0.238, respectively; Table 4; Figure 4C).
Table 4: Body composition analyses for predictors of overall survival by gender groups
Male |
Female |
||||||||
|---|---|---|---|---|---|---|---|---|---|
OS, months |
HR |
95% CI |
pavalue |
OS, months |
HR |
95% CI |
pavalue |
||
Low skeletal muscle mass |
Yes |
7.00 |
1.511 |
1.037–2.200 |
0.032 |
6.00 |
4.042 |
2.007–8.140 |
< 0.001 |
No |
10.00 |
1 |
11.00 |
1 |
|||||
Initial BMI at diagnosis |
0.029 |
0.207 |
|||||||
< 20 kg/m2 |
8.00 |
1 |
7.00 |
1 |
|||||
20–24.9 kg/m2 |
9.00 |
0.600 |
0.365–0.985 |
0.043 |
9.00 |
0.730 |
0.230–2.315 |
||
≥25 kg/m2 |
8.00 |
0.995 |
0.531–1.864 |
0.988 |
9.00 |
1.577 |
0.454–5.480 |
||
Change in BMI |
Decreased |
7.00 |
1.584 |
0.971–2.584 |
0.065 |
9.00 |
0.571 |
0.226–1.447 |
0.238 |
Maintained |
11.00 |
1 |
9.00 |
1 |
|||||
Change in SMI |
Decreased |
7.00 |
2.370 |
1.603–3.504 |
< 0.001 |
9.00 |
4.042 |
2.007–8.140 |
< 0.001 |
Maintained |
12.00 |
1 |
11.00 |
1 |
|||||
Disease status |
Locally advanced |
9.00 |
1 |
0.925 |
1 |
0.612 |
|||
Metastatic |
8.90 |
1.020 |
0.670–1.554 |
0.854 |
0.465–1.570 |
||||
BMI, body mass index; SMI, skeletal muscle index; OS, overall survival; HR, harzard ratio; CI, confidential interval.
ap values were calculated using the Cox-proportional hazard model, adjusted with age, Primary tumor site, and PS.
Low skeletal muscle mass and decrease in SMI were significantly associated with poorer OS than non-lower skeletal muscle mass and maintained in SMI via subgroup analysis according to ICC (p < 0.001 and 0.002, respectively; Supplementary Table 5). The number of patients with both initial SMI and BMI as well as progression SMI and BMI was 248. When we performed an analysis of these patients, the results were similar (Supplementary Table 6).
Correlation between BMI and SMI upon diagnosis
Further analysis categorizing BMI upon diagnosis into overweight or obese (≥ 25 kg/m2) or not (< 25 kg/m2) and SMI upon diagnosis into non-low skeletal muscle mass or low skeletal muscle mass was performed. The results revealed that low skeletal muscle mass patients who were overweight or obese had the poorest OS (Table 5). Compared to a median OS of 11.0 months for patients with non-low skeletal muscle mass who were not obese, low skeletal muscle was a poor prognostic indicator independent of BMI. Low skeletal muscle mass patients had a 4.0-month shorter OS than non-low skeletal muscle mass patients who were not overweight or obese (median OS 11.0 vs 7.0 months; HR, 1.854; p < 0.001) (Figure 5). For patients with low skeletal muscle mass, being overweight or obese had no effect on survival (p = 0.803). For patients with non-low skeletal muscle mass, being overweight or obese worsened survival (p = 0.002). Similar results were observed for men. For men with non-low skeletal muscle mass, being overweight or obese had a negative effect on survival, although this result did not achieve statistical significance.
Table 5: Correlation of BMI and SMI at diagnosis
BMI at diagnosis |
|||||
|---|---|---|---|---|---|
< 25 kg/m2 (N= 394) |
≥ 25 kg/m2(N = 116) |
||||
SMI at diagnosis |
Low skeletal muscle mass, N = 212 |
HR:1.854 (95% CI:1.430–2.403) p < 0.001a, OS = 7.00 months, N = 190 |
HR:2.130 (95% CI:1.135–3.997) p = 0.019a, OS = 6.00 months, N= 16 |
p = 0.803a,c |
p < 0.001a |
Non-low skeletal muscle mass, N = 239 |
HR:1 reference OS=11.00 months, N=150 |
HR:1.630 (95% CI:1.178–2.256) p = 0.003a, OS = 9.00 months, N= 81 |
p = 0.002a,d |
||
SMI males, N= 344 |
Low skeletal muscle mass, N = 150 |
HR:1.723 (95% CI:1.257–2.362 ) p = 0.001b, OS= 8.00 months, N=138 |
HR: 2.598 (95% CI:1.217–5.548) p = 0.014b, OS = 6.00 months, N= 10 |
p = 0.314b,c |
p = 0.003b |
Non-low skeletal muscle mass, N = 144 |
HR:1 Reference OS= 11.00 months,N=90 |
HR:1.532 (95% CI:1.006–2.333) p = 0.047 b, OS = 10.00 months, N= 50 |
p = 0.07b,d |
||
SMI female,N = 180 |
Low skeletal muscle mass, N = 62 |
HR: 2.526 (95% CI:1.518–4.204) p < 0.001b, OS=6.00 months, N=52 |
HR:1.792 (95% CI:0.517–6.204) p = 0.357 b, OS = 7.00 months, N= 6 |
p = 0.840b,c |
p = 0.005b |
Non-low skeletal muscle mass, N = 95 |
HR: 1 Reference OS=12.00 months, N=60 |
HR: 1.919 (95% CI:1.091–3.376) p = 0.024b, OS = 9.00 months, N= 31 |
p = 0.032b,d |
||
ap values were calculated using the Cox-proportional hazard model, Primary tumor site , age and PS,gender.
bp values were calculated using the Cox-proportional hazard model, adjusted with age, Primary tumor site and PS.
cp values were calculated within sarcopenia group. dp values were calculated within nonsarcopenia group.
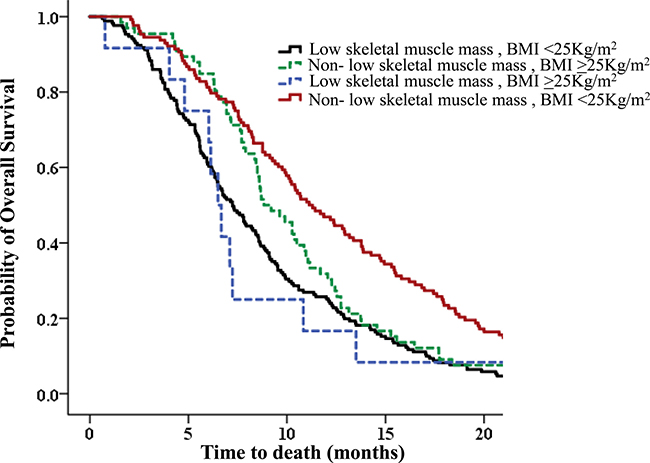
Figure 5: Overall survival (OS) according to correlation between body mass index (BMI) and skeletal muscle index (SMI) upon diagnosis. Patients with low skeletal muscle mass who were overweight or obese had the poorest OS. Patients with low skeletal muscle mass who were overweight or obese had a 4.0-month shorter average OS than non-low skeletal muscle mass patients who were not overweight or obese (median OS 11.0 months vs 6.0 months; HR,2.130; p < 0.001).
Women who had low skeletal muscle mass and were not overweight demonstrated the poorest OS. However, little difference was observed in OS between low skeletal muscle mass patients who were not vs were overweight (6.0 months vs 7.0 months). When we performed similar analysis focusing on ICC, the results were similar (Supplementary Table 7).
Correlation of changes BMI and SMI during chemotherapy
Decreased BMI was an important factor associated with a decrease in SMI (HR, 2.650; p = 0.022; Supplementary Table 3). Additionally, the distribution of change in BMI was strongly correlated with the distribution of change in SMI in both sexes (Pearson r = 0.336, p < 0.001 for all the patients; males, r = 0.328, p < 0.001; females, r = 0.349, p = 0.001; Figure 2).
Analysis of patients in SMI and BMI subgroups (SMI and BMI both maintained during chemotherapy, SMI maintained and BMI decreased, SMI decreased and BMI maintained, and SMI and BMI both decreased) revealed that patients with both decreased BMI and SMI had the shortest survival (p < 0.001; Table 6). Furthermore, patients with decreased SMI had shorter survival regardless of change in BMI (p < 0.001; Table 6).
Table 6: Correlation of changes in BMI and SMI
BMI |
|||||
|---|---|---|---|---|---|
Decreased (N = 50) |
Maintained (N = 252) |
||||
SMI |
Decreased (N = 104) |
HR:2.779 (CI 95% 1.587–4.866) p < 0.001a, OS = 7.00 months, N = 20 |
HR:2.186 (CI 95% 1.555–3.074) ;p < 0.001a, OS = 7.00 months, N = 69 |
p = 0.430a,c |
p < 0.001a |
Maintained (N = 194) |
HR:1.176 (CI 95% 0.666–2.075) ;p = 0.576a , OS = 11.00 months, N = 18 |
HR:1; Reference OS = 12.00 months, N=139 |
p = 0.714a,d |
||
Males (N = 344) |
Decreased (N = 75) |
HR:3.380 (CI 95% 1.729–6.609) ;p < 0.001b, OS = 6.00 months, N = 15 |
HR:2.333(CI 95% 1.523–3.575) ;p < 0.001b, OS = 6.00 months, N = 48 |
p = 0.459b,c |
p < 0.001b |
Maintained (N = 125) |
HR:1.626 (CI 95% 0.815–3.243); p = 0.167 b, OS = 11.00 months, N = 13 |
HR:1; Reference OS = 12.00 months, N = 88 |
p = 0.241b,d |
||
Female (N = 180) |
Decreased (N = 29) |
HR:2.079 (CI 95% 0.513–8.426) p = 0.305 b, OS = 7.00 months, N = 5 |
HR:2.182 (CI 95% 1.049–4.542) p = 0.037 b, OS = 7.00 months, N = 21 |
p = 0.109 b,c |
p = 0.067b |
Maintained (N = 69) |
HR: 0.454 (CI 95% 0.145–1.419) p = 0.174 b, OS = 15.00 months, N = 5 |
HR:1 Reference OS = 10.00 months, N = 51 |
p = 0.278 b,d |
||
ap values were calculated using the Cox-proportional hazard model, adjusted with gender, age, primary tumor site, PS, BMI at diagnosis, and sarcopenia.
bp values were calculated using the Cox-proportional hazard model, adjusted with age, PS, primary tumor site BMI at diagnosis, and sarcopenia.
cp values were calculated within decreased SMI group. dP values were calculated within maintained SMI group.
Compared with a median OS of 12.0 months for patients with both SMI and BMI maintained during chemotherapy, decreased SMI was a poor prognostic indicator when BMI was maintained (median OS 7.0 months; HR, 2.186; p < 0.001; Table 6). However, for patients with SMI maintained during chemotherapy, decreased BMI had no effect on survival (p = 0.576). Analyses according to each sex (men, women) showed similar results.
DISCUSSION
In this study, we found that low skeletal muscle mass upon diagnosis and skeletal muscle depletion during chemotherapy predicted worse survival for patients with advanced BTC.
The influence of BMI upon diagnosis and change of weight (BMI) during chemotherapy is not well understood. One report has shown that obesity is associated with a high risk of BTC [20]. However, no report has analyzed BMI in BTC as predicting OS prognosis. Our study revealed that initial BMI upon diagnosis is not significantly associated with OS. However, based on sex analysis, a BMI upon diagnosis > 25 kg/m2 confers a poor prognosis for men. Furthermore, within the non-low skeletal muscle mass patient group, being overweight or obese (BMI > 25 kg/m2) leads to a worse prognosis (Table 5). Considering the above, although initial BMI is not prognostic in BTC, when considered along with the low skeletal muscle mass state, BMI might help to predict prognosis in BTC.
Our study showed that low skeletal muscle mass and decreased SMI during chemotherapy were associated with poor survival. Subdivision analysis of men & women showed similar results. Our study revealed that low skeletal muscle mass and obesity confers the poorest prognosis (HR, 2.130; p < 0.001; Table 5). This result is in line with that of a previous report, which showed that low skeletal muscle mass and obesity confers a poor prognosis [17]. Our study revealed that women with low skeletal muscle mass and obesity did not have the poorest survival. However, the OS for patients with low skeletal muscle mass and obesity in women, was similar to that of the women demonstrating the poorest OS (7.0 vs 6.0 months; Table 5). Additionally, in our study, very few women were enrolled who had low skeletal muscle mass and were obese (N = 6), mainly because the prevalence of obesity is lower in Asian than in Western populations.
We showed that the decreased SMI during chemotherapy with decreased BMI was associated with a worse survival outcome (Table 6). Furthermore, while the decrease in BMI during chemotherapy did not significantly affect survival in the patients with maintained SMI (p = 0.714), a decrease in SMI was associated with reduced survival in the patients with maintained BMI (HR, 2.186; p < 0.001; Table 6). Analysis by sex showed similar results. Additionally, decreased BMI did not confer a significantly worse prognosis via multivariate analysis. Considering above, muscle depletion would be a more accurate prognostic factor than weight loss. However, considering muscle depletion along with weight loss might help to more accurately predict heterogeneous prognoses in BTC.
Our study also showed that muscle depletion varies according to the tumor origin of BTC (p = 0.008; Supplementary Table 3). The AoV Ca shows the lowest SMI decrease as compared to other primary tumors; thus, differences in OS between primary tumors in BTC might be associated with muscle depletion to some extent.
One previous report shows that median OS was significantly shorter in patients with low skeletal muscle mass (7.0 vs 2.0 months) in BTC [21]. However, this study analyzed only 29 patients and employed univariate survival analysis [21]. In contrast, our study enrolled a larger number of patients and employed multivariate survival analysis. Additionally, co-analysis was performed in our study for BMI, weight change and muscle change during chemotherapy.
Low skeletal muscle mass and obesity are common in advanced cancer and independently predict immobility and mortality [16]. Decreased quality of life, decreased disease-free survival, increased risk of cerebral vascular disease, reduced bone mass, and increased risk of fractures at multiple sites are likely related to both sarcopenia and obesity [22, 23]. Furthermore, patients with low skeletal muscle mass or low skeletal muscle mass obesity seem prone to toxic effects during chemotherapy [24–26], requiring dose reductions or treatment delays [26]. Most chemotherapy drugs are administered based on body surface area. Such practice ignores the large individual variability in muscle mass such that patients with lean body mass may receive a large concentration of drug, increasing drug toxicity [16].
Pathophysiology is characterized by a negative protein and energy balance driven by a variable combination of reduced food intake and abnormal metabolism [3]. IL-6 and TNF-α play important roles in inducing low skeletal muscle mass [27], mainly through stimulating muscle proteolysis and myocyte apoptosis [28]. Furthermore, deteriorated mitochondria are known to be associated with a loss of skeletal muscle integrity [29].
No treatment that leads to a gain of muscle mass in cancer patients has been defined to date. However, one recent report has shown that selumetinib promotes muscle gain in BTC [30]. Additionally, although there is little evidence of an effect of physical exercise on muscle strength, there is one report that showed ameliorated muscle proteolysis in experimental cancer cachexia [31]. Thus, increasing physical activity and muscle loading would be helpful for cancer patients.
The main limitations of our study were its retrospective design and the threshold values used to identify low skeletal muscle mass. The most frequently used cutoffs of sarcopenia in the Western population are 7.26 kg/m2 for men and 5.45 kg/m2 for women by dual-energy x-ray absorptiometry (DEXA) [32, 33]. Recently, these values were converted to CT measurements, which are correlated with the L3 skeletal muscle area and lumbar SMI (cm2/m2) [34–36]. However, low skeletal muscle mass defined by the cutoffs from previous Western studies may not be appropriate for a diagnosis of sarcopenia in the Asian population [37]. Therefore, we used ROC curve cut offs, the same method that was used in a previous report in Korea [13]. However, cutoff values in our study are different from those of previous reports on pancreatic cancer [13]. This observed difference in cutoff value may be attributable to different cancers, obese patients, or sex composition of the analyzed patient group. Thus, to validate our study, we used the cutoff value used in a previous study (52.4 cm2/m2 for men and 38.5 cm2/m2 for women) [38]; the results were similar to those of our original analysis (Supplementary Table 8). In addition, when we validated the current results using an ongoing study (selection of patients from “Biomarker discovery for predicting anti-cancer treatment response and prognosis in advanced gastric cancer, pancreatic cancer, biliary tract cancer and neuroendocrine tumor through prospective collection (from 2013) of human material: IRB No. H1306-069-497), we found that patients with low skeletal muscle mass had shorter OS than patients with non-low skeletal muscle mass; however, this result was not significant (Supplementary Table 9). Considering that is and ongoing prospective study, only sixty-two patients was analyzed; thus, further study and more patients are needed for a more robust analysis.
Finally, our study produced somewhat different results as compared to studies including other tumors, such as lung cancer [39]. However, ours represents a well-structured study on BTC, and provides a basis for further study.
In conclusion, low skeletal muscle, low skeletal muscle mass obesity and muscle depletion during palliative chemotherapy are meaningful prognostic factors in advanced BTC. Although initial BMI upon diagnosis might not be a prognostic factor, considering BMI along with low skeletal muscle mass state might aid in predicting prognosis. In addition, considering muscle depletion with weight change could be help to predict a more accurate prognosis in BTC. Thus, assessment of body composition should be considered when treating patients with advanced BTC.
MATERIALS AND METHODS
Patients
We retrospectively enrolled consecutive patients with advanced biliary tract cancer (BTC) who were treated at Seoul National University Hospital (Seoul, South Korea) between 2003 and 2013. All patients fulfilled the following criteria: (1) BTC was histologically confirmed; (2) BTC was unresectable and recurrent; (3) body weight and height were recorded at the time of unresectable/recurrent BTC diagnosis; and (4) an abdominal computed tomography (CT) scan was performed within the 30 days prior to starting the first cycle of palliative chemotherapy. The medical records of each patient were reviewed and the following data were extracted: BMI, sex, age, anatomical origin of tumor, tumor localization, pathology, progression-free survival (PFS) and overall survival (OS).
Skeletal muscle mass measurement
CT scans performed upon diagnosis and progression date after first-line chemotherapy were used to quantify the initial area of L3 skeletal muscle. Two adjacent axial images within the same series, the third lumbar vertebra (L3), were selected for analysis of total muscle cross-sectional area (cm2) and averaged for each patient [17, 34, 40, 41]. Muscles were quantified within a Hounsfield unit (HU) range of -29 to 150 HU19 using Rapidia 3D software (v2.8; INFINITT Healthcare, Seoul, Korea) [13]. Muscle area was normalized to height in meters squared (m2) and reported as lumbar skeletal muscle index (SMI; cm2/m2) [13, 16, 17]. We used the area under the receiver operating characteristic (ROC) curve to determine the cutoff values for low skeletal muscle mass for both sexes.
Statistical analyses
Fisher’s exact and independent t-tests were used for continuous variables to compare baseline characteristics between two groups of patients. Logistic regression was used to identify factors associated with a decrease in SMI during chemotherapy. OS was calculated from the first day of palliative chemotherapy to the day of death, and PFS was calculated from the first day of palliative chemotherapy to the first day of progression or last follow-up. OS and PFS were estimated using the Kaplan-Meier method. A log-rank test was used to assess differences in OS and PFS across groups. The effect of patient characteristics and other prognostic factors, such as SMI or a decrease in SMI, on survival was evaluated using Cox proportional hazard models (univariate and multivariate analyses) and the resultant hazard ratio (HR) and 95% confidence intervals (95% CIs). A p value of 0.05 or less was considered statistically significant. All analyses were performed using SPSS software for Windows (version 20; IBM SPSS, Somers, NY, USA).
Ethics
The study protocol was reviewed and approved by the Institutional Review Board of Seoul National University Hospital (IRB No.H-1306-109-500). The study was conducted according to guidelines (Declaration of Helsinki) for biomedical research.
CONFLICTS OF INTEREST
All authors have no conflicts of interest to declare.
FUNDING
This study was supported by a grant from SNU Invitation Program for Distinguished Scholar to Dr. Do-Youn Oh.
REFERENCES
1. de Groen PC, Gores GJ, LaRusso NF, Gunderson LL, Nagorney DM. Biliary tract cancers. N Engl J Med. 1999; 341:1368–1378.
2. Mosconi S, Beretta GD, Labianca R, Zampino MG, Gatta G, Heinemann V. Cholangiocarcinoma. Crit Rev Oncol Hematol. 2009; 69:259–270.
3. Fearon K, Strasser F, Anker SD, Bosaeus I, Bruera E, Fainsinger RL, Jatoi A, Loprinzi C, MacDonald N, Mantovani G, Davis M, Muscaritoli M, Ottery F, et al. Definition and classification of cancer cachexia: an international consensus. Lancet Oncol. 2011; 12:489–495.
4. Argiles JM, Busquets S, Stemmler B, Lopez-Soriano FJ. Cachexia and sarcopenia: mechanisms and potential targets for intervention. Curr Opin Pharmacol. 2015; 22:100–106.
5. Dewys WD, Begg C, Lavin PT, Band PR, Bennett JM, Bertino JR, Cohen MH, Douglass HO Jr, Engstrom PF, Ezdinli EZ, Horton J, Johnson GJ, Moertel CG, et al. Prognostic effect of weight loss prior to chemotherapy in cancer patients. Eastern Cooperative Oncology Group. Am J Med. 1980; 69:491–497.
6. Fearon KC, Voss AC, Hustead DS. Definition of cancer cachexia: effect of weight loss, reduced food intake, and systemic inflammation on functional status and prognosis. Am J Clin Nutr. 2006; 83:1345–1350.
7. Davis MP, Dickerson D. Cachexia and anorexia: cancer’s covert killer. Support Care Cancer. 2000; 8:180–187.
8. Blum D, Strasser F. Cachexia assessment tools. Curr Opin Support Palliat Care. 2011; 5:350–355.
9. Jensen GL, Hsiao PY, Wheeler D. Adult nutrition assessment tutorial. JPEN J Parenter Enteral Nutr. 2012; 36:267–274.
10. Del Fabbro E, Hui D, Dalal S, Dev R, Nooruddin ZI, Bruera E. Clinical outcomes and contributors to weight loss in a cancer cachexia clinic. J Palliat Med. 2011; 14:1004–1008.
11. Yavuzsen T, Davis MP, Walsh D, LeGrand S, Lagman R. Systematic review of the treatment of cancer-associated anorexia and weight loss. J Clin Oncol. 2005; 23:8500–8511.
12. Evans WJ, Morley JE, Argiles J, Bales C, Baracos V, Guttridge D, Jatoi A, Kalantar-Zadeh K, Lochs H, Mantovani G, Marks D, Mitch WE, Muscaritoli M, et al. Cachexia: a new definition. Clin Nutr. 2008; 27:793–799.
13. Choi Y, Oh DY, Kim TY, Lee KH, Han SW, Im SA, Kim TY, Bang YJ. Skeletal Muscle Depletion Predicts the Prognosis of Patients with Advanced Pancreatic Cancer Undergoing Palliative Chemotherapy, Independent of Body Mass Index. PLoS One. 2015; 10:e0139749.
14. Meza-Junco J, Montano-Loza AJ, Baracos VE, Prado CM, Bain VG, Beaumont C, Esfandiari N, Lieffers JR, Sawyer MB. Sarcopenia as a prognostic index of nutritional status in concurrent cirrhosis and hepatocellular carcinoma. J Clin Gastroenterol. 2013; 47:861–870.
15. Sharma P, Zargar-Shoshtari K, Caracciolo JT, Fishman M, Poch MA, Pow-Sang J, Sexton WJ, Spiess PE. Sarcopenia as a predictor of overall survival after cytoreductive nephrectomy for metastatic renal cell carcinoma. Urol Oncol. 2015; 33:339.e17–23.
16. Prado CM, Lieffers JR, McCargar LJ, Reiman T, Sawyer MB, Martin L, Baracos VE. Prevalence and clinical implications of sarcopenic obesity in patients with solid tumours of the respiratory and gastrointestinal tracts: a population-based study. Lancet Oncol. 2008; 9:629–635.
17. Martin L, Birdsell L, Macdonald N, Reiman T, Clandinin MT, McCargar LJ, Murphy R, Ghosh S, Sawyer MB, Baracos VE. Cancer cachexia in the age of obesity: skeletal muscle depletion is a powerful prognostic factor, independent of body mass index. J Clin Oncol. 2013; 31:1539–1547.
18. Okumura S, Kaido T, Hamaguchi Y, Fujimoto Y, Kobayashi A, Iida T, Yagi S, Taura K, Hatano E, Uemoto S. Impact of the preoperative quantity and quality of skeletal muscle on outcomes after resection of extrahepatic biliary malignancies. Surgery. 2016; 159:821–833.
19. Otsuji H, Yokoyama Y, Ebata T, Igami T, Sugawara G, Mizuno T, Nagino M. Preoperative sarcopenia negatively impacts postoperative outcomes following major hepatectomy with extrahepatic bile duct resection. World J Surg. 2015; 39:1494–1500.
20. Park M, Song da Y, Je Y, Lee JE. Body mass index and biliary tract disease: a systematic review and meta-analysis of prospective studies. Prev Med. 2014; 65:13–22.
21. Mir O, Coriat R, Dhooge M, Perkins G, Boudou-Rouquette P, Brezault C, Ropert S, Durand JP, Chaussade S, Goldwasser F. Feasibility of gemcitabine and oxaliplatin in patients with advanced biliary tract carcinoma and a performance status of 2. Anticancer Drugs. 2012; 23:739–744.
22. Di Sebastiano KM, Mourtzakis M. A critical evaluation of body composition modalities used to assess adipose and skeletal muscle tissue in cancer. Appl Physiol Nutr Metab. 2012; 37:811–821.
23. Demark-Wahnefried W, Peterson BL, Winer EP, Marks L, Aziz N, Marcom PK, Blackwell K, Rimer BK. Changes in weight, body composition, and factors influencing energy balance among premenopausal breast cancer patients receiving adjuvant chemotherapy. J Clin Oncol. 2001; 19:2381–2389.
24. Prado CM, Birdsell LA, Baracos VE. The emerging role of computerized tomography in assessing cancer cachexia. Curr Opin Support Palliat Care. 2009; 3:269–275.
25. Prado CM, Baracos VE, McCargar LJ, Mourtzakis M, Mulder KE, Reiman T, Butts CA, Scarfe AG, Sawyer MB. Body composition as an independent determinant of 5-fluorouracil-based chemotherapy toxicity. Clin Cancer Res. 2007; 13:3264–3268.
26. Prado CM, Baracos VE, McCargar LJ, Reiman T, Mourtzakis M, Tonkin K, Mackey JR, Koski S, Pituskin E, Sawyer MB. Sarcopenia as a determinant of chemotherapy toxicity and time to tumor progression in metastatic breast cancer patients receiving capecitabine treatment. Clin Cancer Res. 2009; 15:2920–2926.
27. Argiles JM, Busquets S, Felipe A, Lopez-Soriano FJ. Muscle wasting in cancer and ageing: cachexia versus sarcopenia. Adv Gerontol. 2006; 18:39–54.
28. Argiles JM, Busquets S, Stemmler B, Lopez-Soriano FJ. Cancer cachexia: understanding the molecular basis. Nat Rev Cancer. 2014; 14:754–762.
29. Shum AM, Mahendradatta T, Taylor RJ, Painter AB, Moore MM, Tsoli M, Tan TC, Clarke SJ, Robertson GR, Polly P. Disruption of MEF2C signaling and loss of sarcomeric and mitochondrial integrity in cancer-induced skeletal muscle wasting. Aging (Albany NY). 2012; 4:133–143. https://doi.org/10.18632/aging.100436.
30. Prado CM, Bekaii-Saab T, Doyle LA, Shrestha S, Ghosh S, Baracos VE, Sawyer MB. Skeletal muscle anabolism is a side effect of therapy with the MEK inhibitor: selumetinib in patients with cholangiocarcinoma. Br J Cancer. 2012; 106: 1583–1586.
31. White JP, Puppa MJ, Sato S, Gao S, Price RL, Baynes JW, Kostek MC, Matesic LE, Carson JA. IL-6 regulation on skeletal muscle mitochondrial remodeling during cancer cachexia in the ApcMin/+ mouse. Skelet Muscle. 2012; 2:14.
32. Baumgartner RN, Koehler KM, Gallagher D, Romero L, Heymsfield SB, Ross RR, Garry PJ, Lindeman RD. Epidemiology of sarcopenia among the elderly in New Mexico. Am J Epidemiol. 1998; 147:755–763.
33. Gallagher D, Visser M, De Meersman RE, Sepulveda D, Baumgartner RN, Pierson RN, Harris T, Heymsfield SB. Appendicular skeletal muscle mass: effects of age, gender, and ethnicity. J Appl Physiol. 1997; 83:229–239.
34. Mourtzakis M, Prado CM, Lieffers JR, Reiman T, McCargar LJ, Baracos VE. A practical and precise approach to quantification of body composition in cancer patients using computed tomography images acquired during routine care. Appl Physiol Nutr Metab. 2008; 33:997–1006.
35. Tan BH, Birdsell LA, Martin L, Baracos VE, Fearon KC. Sarcopenia in an overweight or obese patient is an adverse prognostic factor in pancreatic cancer. Clin Cancer Res. 2009; 15:6973–6979.
36. Montano-Loza AJ, Meza-Junco J, Prado CM, Lieffers JR, Baracos VE, Bain VG, Sawyer MB. Muscle wasting is associated with mortality in patients with cirrhosis. Clin Gastroenterol Hepatol. 2012; 10:166–173, 73.e1.
37. Wen X, Wang M, Jiang CM, Zhang YM. Are current definitions of sarcopenia applicable for older Chinese adults? J Nutr Health Aging. 2011; 15:847–851.
38. Nishigori T, Okabe H, Tanaka E, Tsunoda S, Hisamori S, Sakai Y. Sarcopenia as a predictor of pulmonary complications after esophagectomy for thoracic esophageal cancer. J Surg Oncol. 2016; 113:678–684.
39. Wysham NG, Nipp RD, LeBlanc TW, Wolf SP, Ekstrom MP, Currow DC. A practical measurement of thoracic sarcopenia: correlation with clinical parameters and outcomes in advanced lung cancer. ERJ Open Res. 2016; 2.
40. Mitsiopoulos N, Baumgartner RN, Heymsfield SB, Lyons W, Gallagher D, Ross R. Cadaver validation of skeletal muscle measurement by magnetic resonance imaging and computerized tomography. J Appl Physiol. 1998; 85:115–122.
41. Shen W, Punyanitya M, Wang Z, Gallagher D, St-Onge MP, Albu J, Heymsfield SB, Heshka S. Total body skeletal muscle and adipose tissue volumes: estimation from a single abdominal cross-sectional image. J Appl Physiol. 2004; 97:2333–2338.