
INTRODUCTION
Male breast carcinoma (MBC) is a rare disease with steady incidence rates; it comprises about 1% of all cancers in men in Western countries [1–2]. Although rare, breast cancer (BC) affects men’s health and quality of life. The present study showed that the mean age of MBC patients was about 60–65 years old. However, this disease may develop in a wide range of ages. For example, the youngest MBC patient was 9 years old and the oldest was above 90 years [3].
As a result of the absence of screening programs in men, MBCs are usually diagnosed at a more advanced age. In the SEER data, the median ages at diagnosis of breast cancer were 67 and 62 years in males and females, respectively [4]. MBC patients are also diagnosed with a more severe clinical manifestation with relatively larger tumor sizes and more frequent lymph node involvement than female breast cancer (FBC) patients [5]. Moreover, male breast cancer also develops with a much higher proportion of positive tumor hormone receptors, a significantly prolonged treatment delay, and a more advanced tumor, node, and metastasis (TNM) stage of the disease at the time of diagnosis than FBC [6]. There are some differences in clinical and biological characteristics between FBC and MBC. However, the treatment of MBC is currently based on FBC due to the inadequate characterization [7–8].
Although the incidence of MBC is lower than that of FBC, a substantial variable may exist between different countries. The incidence of MBC in Thailand (0.14 per 100 000 man-years) was significantly lower than that in Israel (1.08 per 100 000 man-years). The variability in rates may be due to population-specific factors [9].
In specific population groups, cancer disparities exist in the incidence, prevalence, mortality, and burden of cancer and related adverse health conditions [10]. Of all the disparities, the differences in cancer related to race and ethnicity have been well described and are major public health concerns. For example, black men have higher incidence and death rates than white men when considering all cancer sites combined; black women also have higher death rates than white women [11–13]. These disparities apply to much of the United States, where whites and blacks are the predominant racial groups. However, a majority of studies ignore other races, including American Indians, AK Natives, Asians, and Pacific Islanders. Therefore, we wanted to know whether there was also some variability in male breast cancer in different races. Therefore, the aim of this study is to report clinicopathological characteristics and outcomes of a series of MBCs in different races.
RESULTS
Clinical characteristics of the study population
Overall, 8,607 patients with male breast cancer were enrolled, including 7,122 white patients, 1,111 black patients, and 374 patients of other races (including American Indians/AK Natives and Asian/Pacific Islanders). Their characteristics were analyzed and the results are summarized in Table 1. There were significant differences in clinical characteristics, including the year of diagnosis, age, tumor size, LN status, AJCC stage, ER status, PR status, and HER2 status. Among the 3 populations, white patients presented with an older age (50–85 years: 91.2% vs. 85.0% and 86.6%, respectively; P < 0.001). Furthermore, black MBC patients were more likely to be stages II-IV (9.7% vs. 8.3% and 6.7% in stage II, 4.7% vs. 3.3% and 3.2% in stage III, 3.4% vs. 1.5% and 1.9% in stage IV, respectively; P < 0.001) and to have more advanced tumors (2 cm < tumor size ≤ 5 cm: 23.0% vs. 20.8% and 19.5%, tumor size > 5 cm: 11.2% vs. 6.2% and 7.2%, respectively; P < 0.001). In addition, the rate of LN involvement at diagnosis was higher in blacks than in whites and others (29.6% vs. 22.9% and 23.3%, respectively; P < 0.001). An ER-positive rate was detected in 66.6% of the whites, 65.7% of the blacks, and 70.3% of the others (P < 0.001). Similarly, PR was expressed as 58.9%, 54.4%, and 66% of the whites, blacks, and others, respectively (P < 0.001). HER2 positivity was higher in the blacks than in the others and the whites (3.4% vs 2.1% and 2.1%, respectively; P = 0.002). The incidence of distant metastasis was higher in blacks than in the whites and others (bone metastasis: 2.3% vs 1.0 vs 1.1, P < 0.001; brain metastasis: 0.2 vs 0.1 vs 0, P = 0.010; liver metastasis: 0.5 vs 0.2 vs 0.3, P = 0.002; lung metastasis; 1.5 vs 0.6 vs 1.1, P < 0.001).
Table 1: Patient characteristics in white patients compared to blacks and others
Variables |
White |
Black |
othera |
total |
|||||
|---|---|---|---|---|---|---|---|---|---|
n = 7122 |
n = 1111 |
n = 374 |
n = 8607 |
||||||
No. |
% |
No. |
% |
No. |
% |
No. |
% |
p |
|
Median follow-up (months) (IQR) |
115 (111–119) |
105 (93–116) |
91 (78–103) |
||||||
Year of diagnosis |
|||||||||
1973–1993 |
1553 |
21.8 |
189 |
17.0 |
65 |
17.4 |
1807 |
21.0 |
< 0.001 |
1994–2013 |
5569 |
78.2 |
922 |
83.0 |
309 |
82.6 |
6800 |
79.0 |
|
age (years) |
|||||||||
10–49 |
630 |
8.8 |
167 |
15.0 |
50 |
13.4 |
847 |
9.8 |
< 0.001 |
50–85 |
6492 |
91.2 |
944 |
85.0 |
324 |
86.6 |
7760 |
90.2 |
|
Laterality |
|||||||||
right |
3375 |
47.4 |
540 |
48.6 |
178 |
47.6 |
4093 |
47.6 |
0.346 |
left |
3640 |
51.1 |
560 |
50.4 |
187 |
50.0 |
4387 |
51.0 |
|
bilateral |
107 |
1.5 |
11 |
1.0 |
9 |
2.4 |
127 |
1.5 |
|
Grade |
|||||||||
I |
703 |
9.9 |
106 |
9.5 |
34 |
9.1 |
843 |
9.8 |
0.385 |
II |
2795 |
39.2 |
414 |
37.3 |
148 |
39.6 |
3357 |
39.0 |
|
III |
1966 |
27.6 |
337 |
30.3 |
107 |
28.6 |
2410 |
28.0 |
|
IV |
109 |
1.5 |
13 |
1.2 |
10 |
2.7 |
132 |
1.5 |
|
unknown |
1549 |
21.7 |
241 |
21.7 |
75 |
20.1 |
1865 |
21.7 |
|
AJCC stage |
|||||||||
I |
532 |
7.5 |
85 |
7.7 |
29 |
7.8 |
646 |
7.5 |
< 0.001 |
II |
592 |
8.3 |
108 |
9.7 |
25 |
6.7 |
725 |
8.4 |
|
III |
238 |
3.3 |
52 |
4.7 |
12 |
3.2 |
302 |
3.5 |
|
IV |
108 |
1.5 |
38 |
3.4 |
7 |
1.9 |
153 |
1.8 |
|
unknown |
5652 |
79.4 |
828 |
74.5 |
301 |
80.5 |
6781 |
78.8 |
|
Tumor size (cm) |
|||||||||
≤ 2 |
1656 |
23.3 |
224 |
20.2 |
105 |
28.1 |
1985 |
23.1 |
< 0.001 |
> 2 and ≤ 5 |
1484 |
20.8 |
255 |
23.0 |
73 |
19.5 |
1812 |
21.1 |
|
> 5 |
441 |
6.2 |
124 |
11.2 |
27 |
7.2 |
592 |
6.9 |
|
unknown |
3541 |
49.7 |
508 |
45.7 |
169 |
45.2 |
4218 |
49 |
|
LN status |
|||||||||
Negative |
1952 |
27.4 |
274 |
24.7 |
118 |
31.6 |
2344 |
27.2 |
< 0.001 |
Positive |
1629 |
22.9 |
329 |
29.6 |
87 |
23.3 |
2045 |
23.8 |
|
To be continued |
|||||||||
unknown |
3541 |
49.7 |
508 |
45.7 |
169 |
45.2 |
4218 |
49.0 |
|
ER |
|||||||||
Negative |
233 |
3.3 |
62 |
5.6 |
21 |
5.6 |
316 |
3.7 |
< 0.001 |
Positive |
4745 |
66.6 |
730 |
65.7 |
263 |
70.3 |
5738 |
66.7 |
|
unknown |
2144 |
30.1 |
319 |
28.7 |
90 |
24.1 |
2553 |
29.7 |
|
PR |
|||||||||
Negative |
678 |
9.5 |
172 |
15.5 |
32 |
8.6 |
882 |
10.2 |
< 0.001 |
Positive |
4192 |
58.9 |
604 |
54.4 |
247 |
66 |
5043 |
58.6 |
|
unknown |
2252 |
31.6 |
335 |
30.2 |
95 |
25.4 |
2682 |
31.2 |
|
HER2 |
|||||||||
Negative |
1219 |
17.1 |
227 |
20.4 |
61 |
16.3 |
1507 |
17.5 |
0.002 |
Positive |
147 |
2.1 |
38 |
3.4 |
8 |
2.1 |
193 |
2.2 |
|
unknown |
5756 |
80.8 |
846 |
76.1 |
305 |
81.6 |
6907 |
80.2 |
|
Radiation |
|||||||||
Yes |
1612 |
22.6 |
268 |
24.1 |
75 |
20.1 |
1955 |
22.7 |
0.195 |
No |
5424 |
76.2 |
835 |
75.2 |
292 |
78.1 |
6551 |
76.1 |
|
unknown |
86 |
1.2 |
8 |
0.7 |
7 |
0.1 |
101 |
1.2 |
|
Bone metastasis |
|||||||||
No |
1434 |
20.1 |
264 |
23.8 |
72 |
19.3 |
1770 |
20.6 |
< 0.001 |
yes |
74 |
1.0 |
25 |
2.3 |
4 |
1.1 |
103 |
1.2 |
|
unknown |
5614 |
78.8 |
822 |
74.0 |
298 |
79.7 |
6734 |
78.2 |
|
Brain metastasis |
|||||||||
No |
1497 |
21.0 |
285 |
25.7 |
76 |
20.3 |
1858 |
21.6 |
0.010 |
Yes |
10 |
0.1 |
2 |
0.2 |
0 |
0 |
12 |
0.1 |
|
unknown |
5615 |
78.8 |
824 |
74.2 |
298 |
79.7 |
6737 |
78.3 |
|
Liver metastasis |
|||||||||
No |
1493 |
21.0 |
283 |
25.5 |
75 |
20.1 |
1851 |
21.5 |
0.002 |
Yes |
14 |
0.2 |
6 |
0.5 |
1 |
0.3 |
21 |
0.2 |
|
unknown |
5615 |
78.8 |
822 |
74.0 |
298 |
79.7 |
6735 |
78.3 |
|
Lung metastasis |
|||||||||
No |
1462 |
20.5 |
271 |
24.4 |
72 |
19.3 |
1805 |
21.0 |
< 0.001 |
Yes |
42 |
0.6 |
17 |
1.5 |
4 |
1.1 |
63 |
0.7 |
|
unknown |
5618 |
78.9 |
823 |
74.1 |
298 |
79.7 |
6739 |
78.3 |
|
P-value was calculated among all groups by the Chi-square test, and a bold type indicates significance. a: Including American Indian/Alaskan native, Asian/Pacific Islander and others-unspecified.
Comparison of MBC survival among whites, blacks, and other races
As shown in Kaplan-Meier plots, 30-year overall survival (OS) was better in other patients than in the white and black populations (χ 2 = 29.974, P < 0.001, Figure 1A). We also analyzed the breast cancer-specific survival (BCSS) and slightly significant differences were observed (χ 2 = 7.285, P = 0.026, Figure 1B). The median survival time was 102 months (95% CI: 98–1105), 80 months (95% CI: 72–88), and 133 months (95% CI: 108–157) in the white, black, and other patients, respectively. The 30-year OS likely represents mortality from other causes; we capped it at 15 years, and it showed similar results in the Supplementary Figure 1. Furthermore, we used the Cox proportional hazards model to investigate the effects of the clinical characteristics on OS (Table 2). Many prognostic indicators were also found to be significantly associated with OS in the univariate analysis, including the year of diagnosis, laterality, tumor grade, tumor size, age, LN status, ER status, PR status, HER2 status, and radiation (Table 2). The results showed that race could also be a prognostic indicator. Taking the white race as the reference, we found that the white race could be a protective factor when compared to the black race (HR = 1.208, 95% CI: 1.107–1.319, P < 0.001), but could also be a risk factor when compared to the others (HR = 0.775, 95% CI: 0.659–0.911, P = 0.002). All the variables were included in the multivariate analysis to estimate the prognostic factors that were identified in the univariate analysis (Table 2). Race was also an independent prognostic factor in the multivariate analysis after adding the other prognostic factors. When we adjusted for white patients as a control group, the white race could also be an independent protective factor when compared to the black race (HR = 1.208, 95% CI: 1.106–1.320, P < 0.001), while it was a risk factor when compared with the other races (HR = 0.801, 95% CI: 0.681–0.942, P = 0.007).
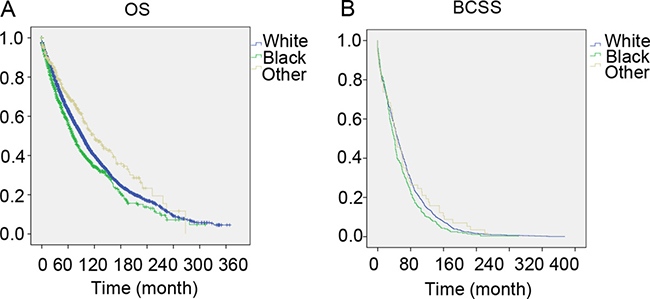
Figure 1: The overall survival and breast cancer specific survival of White, Black and other patients. Kaplan meier test for overall survival (χ2 = 29.974, P < 0.001) (Figure 1A) and breast cancer specific survival (χ2 = 7.285, P = 0.026, Figure 1B) to compare White patients to Blacks and others.
Table 2: Univariate and multivariate analysis of overall survival (OS)
Variables |
Univariate analysis |
Multivariate analysis |
||
|---|---|---|---|---|
HR (95% CI) |
P–Value |
HR (95% CI) |
P–Value |
|
Year of diagnosis |
||||
1973–1993 |
reference |
reference |
||
1994–2013 |
0.861 (0.087–0.920) |
< 0.001 |
1.002 (0.917–1.095) |
0.963 |
age (years) |
||||
10–49 |
reference |
reference |
||
50–85 |
2.373 (2.105–2.676) |
< 0.001 |
2.494 (2.211–2.814) |
< 0.001 |
Laterality |
||||
right |
reference |
reference |
||
left |
1.004 (0.946–1.066) |
0.885 |
1.000 (0.942–1.061) |
1.000 |
bilateral |
0.448 (0.353–0.568) |
< 0.001 |
1.620 (1.262–2.079) |
0.001 |
Grade |
||||
I |
reference |
reference |
||
II |
1.313 (1.159–1.487) |
< 0.001 |
1.267 (1.118–1.436) |
< 0.001 |
III |
1.712 (1.508–1.943) |
< 0.001 |
1.559 (1.372–1.772) |
< 0.001 |
IV |
1.988 (1.585–2.494)) |
< 0.001 |
1.759 (1.399–2.211) |
< 0.001 |
unknown |
1.736 (1.555–1.999) |
< 0.001 |
1.478 (1.293–1.690) |
< 0.001 |
AJCC stage |
||||
I |
reference |
reference |
||
II |
1.735 (1.195–2.520) |
0.004 |
0.940 (0.636–1.389) |
0.755 |
III |
2.361 (1.561–3.570) |
< 0.001 |
1.070 (0.694–1.650) |
0.758 |
IV |
8.156 (5.489–12.119) |
< 0.001 |
2.840 (1.863–4.329) |
< 0.001 |
unknown |
2.562 (1.892–3.469) |
< 0.001 |
0.791 (0.524–1.192) |
0.262 |
Tumor size (cm) |
||||
≤ 2 |
reference |
reference |
||
> 2 and ≤ 5 |
1.995 (1.756–2.266) |
< 0.001 |
1.802 (1.574–2.063) |
< 0.001 |
> 5 |
3.334 (2.850–3.899) |
< 0.001 |
2.519 (2.132–2.977) |
< 0.001 |
unknown |
1.779 (1.595–1.984) |
< 0.001 |
1.630 (1.432–1.856) |
< 0.001 |
LN status |
||||
Negative |
reference |
reference |
||
Positive |
1.584 (1.417–1.770) |
< 0.001 |
1.261 (1.122–1.418) |
< 0.001 |
unknown |
1.371 (1.249–1.506) |
< 0.001 |
– |
– |
ER |
||||
Negative |
reference |
reference |
||
Positive |
0.684 (0.587–0.796) |
< 0.001 |
0.800 (0.675–0.964) |
0.010 |
unknown |
0.892 (0.765–1.040) |
0.144 |
1.211 (0.912–1.608) |
0.186 |
Continued |
||||
PR |
||||
Negative |
reference |
reference |
||
To be continued |
||||
Positive |
0.763 (0.689–0.845) |
< 0.001 |
0.861 (0.768–0.964) |
0.010 |
unknown |
0.988 (0.891–1.095) |
0.813 |
0.675 (0.524–0.870) |
0.002 |
Her2 |
||||
Negative |
reference |
reference |
||
Positive |
1.698 (1.166–2.473) |
0.006 |
1.305 (0.894–1.905) |
0.168 |
unknown |
1.606 (1.361–1.894) |
< 0.001 |
2.059 (1.484–2.855) |
< 0.001 |
Radiation |
||||
Yes |
reference |
– |
– |
|
No |
0.950 (0.884–1.019) |
0.154 |
– |
– |
unknown |
1.397 (0.977–1.998) |
0.067 |
– |
– |
Race |
||||
White |
reference |
reference |
||
Black |
1.208 (1.107–1.319) |
< 0.001 |
1.208 (1.106–1.320) |
< 0.001 |
Othera |
0.775 (0.659–0.911) |
0.002 |
0.801 (0.681–0.942) |
0.007 |
The CI and P-value was calculated by Cox proportional hazards model and the bold type indicates significance. a:Including American Indian/Alaskan native, Asian/Pacific Islander and others-unspecified.
Survival analysis in matched groups
There was a large difference among the 3 races. To ensure that the outcomes were not based on the differences of patient quantity of the groups, we performed a 1:1:1 (white: black: other) matched case control analysis using the propensity score matching method. We finally focused on a group of 1122 patients, including 374 patients in each racial type (Table 3). Compared to the results in Table 1, similar results are shown in Table 3. There were also significant differences in the clinical characteristics, including tumor size, LN status, AJCC stage, ER status, and PR status, except in age and laterality. Furthermore, we also found that the black race was associated with a poorer prognosis in OS, similar to the total group (χ2 = 26.811, P < 0.001, Figure 2).
Table 3: Patient Characteristics in the 1:1 matched groups
Variables |
white |
black |
othera |
total |
|||||
|---|---|---|---|---|---|---|---|---|---|
n = 374 |
n = 374 |
n = 374 |
n = 1122 |
||||||
No. |
% |
No. |
% |
No. |
% |
No. |
% |
p |
|
Median follow-up (months) (IQR) |
290(255–324) |
148(128–167) |
91(78–103) |
||||||
Year of diagnosis |
|||||||||
1973-1993 |
263 |
70.3 |
141 |
37.7 |
65 |
17.4 |
469 |
41.8 |
< 0.001 |
1994-2013 |
111 |
29.7 |
233 |
62.3 |
309 |
82.6 |
653 |
58.2 |
|
age (years) |
|||||||||
10-49 |
37 |
9.9 |
51 |
13.6 |
50 |
13.4 |
138 |
12.3 |
0.22 |
50-85 |
337 |
90.1 |
323 |
86.4 |
324 |
86.6 |
984 |
87.7 |
|
Laterality |
|||||||||
right |
189 |
50.5 |
182 |
48.7 |
178 |
47.6 |
549 |
48.9 |
0.373 |
left |
174 |
46.5 |
188 |
50.3 |
187 |
50.0 |
549 |
48.9 |
|
bilateral |
11 |
1 |
4 |
0.4 |
9 |
0.8 |
24 |
2.1 |
|
Grade |
|||||||||
I |
36 |
9.6 |
19 |
5.1 |
34 |
9.1 |
89 |
7.9 |
< 0.001 |
II |
95 |
25.4 |
101 |
27.0 |
148 |
39.6 |
344 |
30.7 |
|
III |
70 |
18.7 |
120 |
32.1 |
107 |
28.6 |
297 |
26.5 |
|
IV |
3 |
0.8 |
4 |
1.1 |
10 |
2.7 |
17 |
1.5 |
|
unknown |
170 |
45.5 |
130 |
34.8 |
75 |
20.1 |
375 |
33.4 |
|
AJCC stage |
|||||||||
I |
1 |
0.3 |
21 |
5.6 |
29 |
7.8 |
51 |
4.5 |
< 0.001 |
II |
2 |
0.5 |
27 |
7.2 |
25 |
6.7 |
54 |
4.8 |
|
III |
0 |
0 |
10 |
2.7 |
12 |
3.2 |
22 |
2 |
|
IV |
1 |
0.5 |
12 |
3.2 |
7 |
1.9 |
20 |
1.8 |
|
unknown |
370 |
98.9 |
304 |
81.3 |
301 |
80.5 |
975 |
86.9 |
|
Tumor size (cm) |
|||||||||
≤ 2 |
9 |
2.4 |
43 |
11.5 |
105 |
28.1 |
157 |
14 |
< 0.001 |
> 2 and ≤ 5 |
9 |
2.4 |
58 |
15.5 |
73 |
19.5 |
140 |
12.5 |
|
> 5 |
1 |
0.3 |
29 |
7.8 |
27 |
7.2 |
57 |
5.1 |
|
unknown |
355 |
94.9 |
244 |
65.2 |
169 |
45.2 |
768 |
68.4 |
|
LN status |
|||||||||
To be continued |
|||||||||
Negative |
12 |
3.2 |
54 |
14.4 |
118 |
31.6 |
184 |
16.4 |
< 0.001 |
Positive |
7 |
1.9 |
76 |
20.3 |
87 |
23.3 |
170 |
15.2 |
|
unknown |
355 |
94.9 |
244 |
65.2 |
169 |
45.2 |
768 |
68.4 |
|
ER |
|||||||||
Negative |
8 |
2.1 |
19 |
5.1 |
21 |
5.6 |
48 |
4.3 |
< 0.001 |
Positive |
129 |
34.5 |
192 |
51.3 |
263 |
70.3 |
584 |
52.0 |
|
unknown |
237 |
63.4 |
163 |
43.6 |
90 |
24.1 |
490 |
43.7 |
|
PR |
|||||||||
Negative |
20 |
5.3 |
52 |
13.9 |
32 |
8.6 |
104 |
9.3 |
< 0.001 |
Positive |
112 |
29.9 |
156 |
41.7 |
247 |
66.0 |
515 |
45.9 |
|
unknown |
242 |
64.7 |
166 |
44.4 |
95 |
25.4 |
503 |
44.8 |
|
Her2 |
|||||||||
Negative |
3 |
0.8 |
55 |
14.7 |
61 |
16.3 |
119 |
10.6 |
< 0.001 |
Positive |
1 |
0.3 |
10 |
2.7 |
8 |
2.1 |
19 |
1.7 |
|
unknown |
370 |
98.9 |
309 |
82.6 |
305 |
81.6 |
984 |
87.7 |
|
Radiation |
|||||||||
Yes |
92 |
24.6 |
88 |
23.5 |
75 |
20.1 |
255 |
22.7 |
0.03 |
No |
282 |
75.4 |
284 |
75.9 |
292 |
78.1 |
858 |
76.5 |
|
unknown |
0 |
0 |
2 |
0.5 |
7 |
1.9 |
9 |
0.8 |
|
P-value was calculated among all groups by the Chi-square test, and the bold type indicates significance. a: Including American Indian/Alaskan native, Asian/Pacific Islander and others-unspecified.
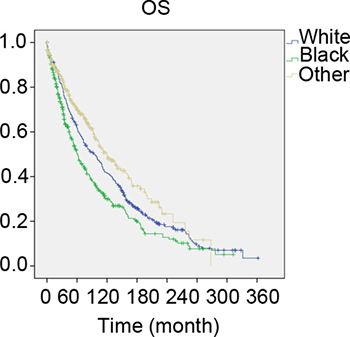
Figure 2: The overall survival of 1:1:1 matched groups of White, Black and other patients. Kaplan meier test for overall survival of 1:1:1 matched groups to compare to compare white patients to Blacks and others (χ2 = 26.811, P < 0.001).
We also used the Cox proportional hazards model to investigate the effects of the clinical characteristics on OS in the matched group (Table 4). The univariate analysis results showed results similar to Table 2. In the multivariate analysis, white race could also be an independent protective factor when compared to the black race (HR = 1.153, 95% CI: 0.936–1.419, P = 0.001) and other races (HR = 1.447, 95% CI: 1.169–1.793, P = 0.003) (Table 4).
Table 4: Univariate and multivariate analysis of overall survival in the 1:1 matched groups
Variables |
Univariate analysis |
Multivariate analysis |
||
|---|---|---|---|---|
HR (95% CI) |
P-Value |
HR (95% CI) |
P-Value |
|
Year of diagnosis |
||||
1973–1993 |
reference |
reference |
||
1994–2013 |
0.867 (0.740–1.015) |
0.075 |
- |
- |
age (years) |
||||
10–49 |
reference |
reference |
||
50–85 |
2.619 (1.976–3.472) |
< 0.001 |
2.741 (2.066–3.635) |
< 0.001 |
Laterality |
||||
right |
reference |
reference |
||
left |
0.971 (0.836–1.128) |
0.701 |
- |
- |
bilateral |
1.220 (0.749–1.987) |
0.425 |
- |
- |
Grade |
||||
I |
reference |
reference |
||
II |
1.183 (0.840–1.666) |
0.336 |
1.300 (0.922–1.835) |
0.135 |
III |
1.740 (1.237–2.446) |
0.001 |
1.687 (1.196–2.381) |
0.003 |
IV |
1.902 (1.037–3.491) |
0.038 |
1.692 (0.911–3.142) |
0.096 |
unknown |
1.634 (1.179–2.266) |
0.003 |
1.416 (1.008–1.988) |
0.045 |
Tumor size (cm) |
||||
≤ 2 |
reference |
reference |
||
> 2 and ≤ 5 |
2.101 (1.305–3.383) |
0.002 |
1.804 (1.118–2.912) |
0.016 |
> 5 |
4.026 (2.346–6.909) |
< 0.001 |
3.653 (2.112–6.318) |
0.003 |
unknown |
2.116 (1.441–3.109) |
< 0.001 |
1.624 (1.084–2.434) |
0.019 |
LN status |
||||
Negative |
reference |
reference |
||
Positive |
1.351 (0.904–2.018) |
0.142 |
- |
- |
unknown |
1.408 (1.029–1.926) |
0.033 |
- |
- |
ER |
||||
Negative |
reference |
reference |
||
Positive |
0.865 (0.573–1.304) |
0.488 |
4.006 (1.462–10.980) |
0.007 |
unknown |
1.204 (0.803–1.804) |
0.369 |
3.244 (1.328–7.926) |
0.01 |
PR |
||||
Negative |
reference |
reference |
||
Positive |
0.656 (0.498–0.866) |
0.003 |
1.512 (0.630–3.627) |
0.355 |
unknown |
0.977 (0.752–1.269) |
0.859 |
1.505 (0.668–3.390) |
0.324 |
Race |
||||
White |
reference |
reference |
||
Black |
1.310 (1.105–1.552) |
0.002 |
1.153 (0.936–1.419) |
0.001 |
Otherb |
0.770 (0.632–0.937) |
0.009 |
1.447 (1.169–1.793) |
0.003 |
a: The total CI and P-value using Cox proportional hazards model and a bold type indicates significance. b: Including American Indian/Alaskan native, Asian/Pacific Islander.
Stratification analysis with molecular subtype
To further investigate the effects of molecular subtypes on breast cancer outcomes between different races of patients, we stratified all the cases according to molecular subtype. In our study, only 1,796 cases had the definite subtype categorization when we eliminated all cases recorded before 2010. Hence, we attempted to conduct a subgroup analysis based on ER/PR/HER2 status. The results showed that 1,976 cases were included (1,748 cases of luminal, 15 cases of HER2+, and 33 cases of basal type). The subgroup distribution among whites, blacks, and others showed no significant difference (P = 0.475) (Table 5). We further performed the multivariate analysis, stratifying according to molecular subtype. However, all cases included were still alive during the follow-up period. Hence, we could not obtain more useful information for the subtype in the 3 races with MBC.
Table 5: Characteristics of patients with different ER/PR status
subtype |
White(n = 1543) |
Black (n = 293) |
othera |
total |
|||||
|---|---|---|---|---|---|---|---|---|---|
No. |
% |
No. |
% |
No. |
% |
No. |
% |
P |
|
Her+ 3 |
11 |
0.7 |
2 |
0.7 |
1 |
1.3 |
14 |
0.7 |
0.475 |
Luminal 1 |
1411 |
91.4 |
268 |
91.5 |
70 |
88.6 |
1749 |
91.3 |
|
Basal 0 |
22 |
1.4 |
8 |
2.7 |
3 |
3.8 |
33 |
1.7 |
|
Unknown 4 |
99 |
6.4 |
15 |
5.1 |
5 |
6.3 |
119 |
6.2 |
|
P-value was calculated among all groups by the Chi-square test. a: Including American Indian/Alaskan native, Asian/Pacific Islander.
DISCUSSION
Because of the delay in the diagnosis and loss of the social male-specific information, an increased trend in male breast cancer mortality rates has emerged. However, the relatively lower incidence of MBC than that of FBC has not aroused the same attention for improving research and prevention. At the present time, the management and treatment of MBC is based on guidelines developed for women [14]. It is known that FBC and MBC differ biologically. For example, the levels of hormone receptors in malignant tumors of the male mammary gland are higher than in malignant female breast tumors on average. The presence of receptor-positive tumors in men does not increase with the age, as is observed in FBC [15–17]. It is necessary to use optimized therapeutic approaches for the treatment of breast cancer in both sexes. Therefore, research on male breast cancer is needed to further promote treatment and prevention.
Because male breast cancer is a relatively rare disease, there is only limited data in the published literature regarding race as a risk factor in male breast cancer patients. For example, one report in 2011 showed the age-adjusted incidence rates overall and for white, black, and Hispanic males were 1.4, 1.3, 1.9, and 0.8 per 100,000, respectively [9, 18]. Crew et al. found that there was an association of black race with increased male breast cancer-specific mortality after adjustment for known clinical, demographic, and treatment factors using the SEER-Medicare database to identify men 65 years of age or older diagnosed with stage I-III breast cancer from 1991 to 2002 [19]. In our study, we obtained 8,607 cases from the current SEER database, and this study is currently the largest analysis of MBC in different races. The results provided evidence that white male breast cancer patients have a particular distribution of clinical characteristics. We summarized the clinicopathological characteristics of the 3 races with MBC and found that white patients presented with an older age, more were unmarried, they had smaller tumors, and they were more likely to be in stage I. Our study also indicated that the hormonal receptor-positive rate including ER, PR, and HER2 were higher in whites than in the blacks and others. Our study enrolled more cases of MBC from 1973 to 2013, and we analyzed more factors with racial disparities than Crew et al.
Common FBC risk factors such as the environment, genetics, hormones, smoking, and alcohol are also involved in the pathogenesis of male breast cancer [20]. For instance, one study found that MBC survival differences were observed between metropolitan and nonmetropolitan regions and an interaction between nonmetropolitan area and regional stage MBC was a significant predictor of poorer survival [21]. However, regional differences in tumor grade size and stage at diagnosis were not statistically significant. Only a small study analyzed those disparities in male breast cancer patients of different races. For example, Monederol et al. reported that smokers with male breast cancer had a significantly decreased survival rate [18].
This study provided some detailed relationships of these risk factors to race. The results showed that white and black male breast cancer patients have a poorer OS and BCSS than others. There were significant differences among whites, blacks, and others, such as the age of diagnosis (P < 0.001) and the hormone receptor status (ER, PR, and HER2, P < 0.001), which may be the main risk factors among whites, blacks and others.
Other factors might participate in the poorer OS of white and black patients than others. As a multifactorial disease, MBC requires a precise and comprehensive knowledge of the risk factors such as family history, genetic susceptibility, and predisposition for useful and effective treatment. In other words, male breast cancer can be affected by genetics, epigenetics, and ethical aspects [14]. In this study, we focused on the genetic and ethical factors to clarify the difference in clinical characteristics among the 3 groups. These might provide insights into a better understanding of MBC.
Our study has several limitations. FBC is categorized into different subtypes that have important prognostic implications, and clear racial/ethnic differences exist in the distribution of tumor subtypes [22–23]. However, it is not clear whether subtypes in MBC are associated with the same prognostic factors. It was reported that non-Hispanic blacks have more than triple the number of receptor-negative tumors and are more likely to have ER+/PR− tumors than non-Hispanic black patients.[24] In our study, with the incomplete subtype data, we could not obtain more useful information for the subtype in the 3 races with MBC.
In conclusion, this study explored the clinicopathological characteristics and survival in white, black, and other races with male breast cancer, including American Indians, AK Natives, Asians, and Pacific Islanders. The white and black MBC patients have poorer OS and BCSS than the others. Race could also be a prognostic indicator. Differences in outcomes may be partially explained by the differences in tumor grade, LN status, and ER and PR status between the 3 groups. Our study might provide insights into a better understanding of MBC and further promote its treatment and prevention.
MATERIALS AND METHODS
Ethics statement
We obtained the SEER research data using the reference number 11443-Nov2015, and the data in the SEER database do not require informed patient consent. Our study was approved by the Ethical Committee and Institutional Review Board of Fudan University Shanghai Cancer Center (FDUSCC). The methods were performed in accordance with the approved guidelines.
patients
The case listing in this study was generated by SEER *Stat version 8.3.2, which included data from 18 population-based registries (1973–2013) and covered approximately 28% of the United States. We choose 8,607 cases of patients according to the following criteria: male; known age; year of diagnosis before 2013; known race; unilateral breast cancer; pathologically confirmed breast cancer and breast cancer as the first and only malignant cancer diagnosis; known ER, PR, and HER2 status; and American Joint Committee on Cancer (AJCC) stages I-IV.
Patients were categorized according to the year of diagnosis (1973–2008 and 2009–2013), their ages (10–49 and 50–58 years), laterality (left or right or paired site), tumor size (tumor size ≤ 2 cm, tumor size 2–5 cm, or tumor size > 5 cm), LN, ER, PR, and HER2 status (negative, positive, and unknown), and radiation (yes, no, or unknown).
Statistical analysis
The clinical characteristics of all selected cases were compared between different racial groups using the χ2 test. We used the Kaplan-Meier method to generate the survival curves, and the log-rank test was performed to compare the OS of white, black, and other (including American Indians, AK Natives, Asians, and Pacific Islanders) patients. OS was defined as the time from the date of diagnosis to the date of death due to all causes (including breast cancer) or the last follow-up. BCSS was measured from the date of diagnosis to the date of breast cancer death. Adjusted HRs with 95% CIs were calculated using Cox proportional hazard regression models to estimate the prognostic factors. These statistical analyses were performed utilizing SPSS software version 22.0. In addition, we matched white, black, and other male patients 1:1:1 on the following predetermined factors: age, AJCC stage, grade, breast subtype, utilizing psmatch 3.04 in SPSS designed for propensity score matching methods. In detail: binary treatment indicator: race; covariates: AJCC stage, grade, tumor size, LN status, AJCC stage, ER status, PR status, and HER2 status; matching algorithm: nearest neighbor matching; discard units outside of common support: none (always used by optimal matching); estimation algorithm: logistic regression; caliper: no caliper. A two-sided P value < 0.05 was considered statistically significant.
Abbreviations
MBC: male breast cancer, FBC: female breast cancer; OS: overall survival; BCSS: breast cancer specific survival; CI: confidence interval; ER: oestrogen receptor; PR: progesterone receptor; HER2: human epidermal growth factor receptor 2; HR: hazard ratio; LN: lymph nodes.
Author contributions
W.J. and H.-F.S. conceived and designed the study. H.-F.S., S.-P.G., L.-D.L, W.-Y.F. performed the analysis, Y.-Z., M.-T.-C., H.-L.J. and P.-L.Y. prepared the figures, H.-F.S. prepared tables and wrote the main manuscript. All of the authors reviewed the manuscript.
CONFLICTS OF INTEREST
The authors declare no conflicts of interest.
FUNDING
This work was supported by grants from National Natural Science Foundation of China (81302299, 81472669).
REFERENCES
1. Fentiman IS, Fourquet A, Hortobagyi GN. Male breast cancer. Lancet. 2006; 367:595–604.
2. White J, Kearins O, Dodwell D, Horgan K, Hanby AM, Speirs V. Male breast carcinoma: increased awareness needed. Breast Cancer Res. 2011; 13:219.
3. Borgen PI, Wong GY, Vlamis V, Potter C, Hoffmann B, Kinne DW, Osborne MP, McKinnon WM. Current management of male breast cancer. A review of 104 cases. Ann Surg. 1992; 215:451–57.
4. Giordano SH, Buzdar AU, Hortobagyi GN. Breast cancer in men. Ann Intern Med. 2002; 137:678–87.
5. Ottini L, Palli D, Rizzo S, Federico M, Bazan V, Russo A. Male breast cancer. Crit Rev Oncol Hematol. 2010; 73:141–55.
6. Rudan I, Rudan N, Basic N, Basic V, Rudan D. Differences between male and female breast cancer. II. Clinicopathologic features. Acta Med Croatica. 1997; 51:129–33.
7. Speirs V, Shaaban AM. The rising incidence of male breast cancer. Breast Cancer Res Treat. 2009; 115:429–30.
8. Zurrida S, Nole F, Bonanni B, Mastropasqua MG, Arnone P, Gentilini O, Latronico A. Male breast cancer. Future Oncol. 2010; 6:985–91.
9. Ly D, Forman D, Ferlay J, Brinton LA, Cook MB. An international comparison of male and female breast cancer incidence rates. Int J Cancer. 2013; 132:1918–26.
10. Trans-HHS Cancer Health Disparities Progress Review Group. Making cancer health disparities history. United States Department of Health and Human Services, 2004. https://permanent.access.gpo.gov/gpo12674/2004chdprg.pdf.
11. Siegel R, Naishadham D, Jemal A. Cancer statistics, 2013. CA Cancer J Clin. 2013; 63: 11–30.
12. Morris AM, Rhoads KF, Stain SC, Birkmeyer JD. Understanding racial disparities in cancer treatment and outcomes. J Am Coll Surg. 2010; 211:105–13.
13. Rhoads KF, Cullen J, Ngo JV, Wren SM. Racial and ethnic differences in lymph node examination after colon cancer resection do not completely explain disparities in mortality. Cancer. 2012; 118:469–77.
14. Rizzolo P, Silvestri V, Tommasi S, Pinto R, Danza K, Falchetti M, Gulino M, Frati P, Ottini L. Male breast cancer: genetics, epigenetics, and ethical aspects. Ann Oncol. 2013; 24:viii75-viii82.
15. Anelli TF, Anelli A, Tran KN, Lebwohl DE, Borgen PI. Tamoxifen administration is associated with a high rate of treatment-limiting symptoms in male breast cancer patients. Cancer. 1994; 74:74–7.
16. Ribeiro GG. Tamoxifen in the treatment of male breast carcinoma. Clin Radiol. 1983; 34:625–8.
17. Hotko YS. Male breast cancer: clinical presentation, diagnosis, treatment. Exp Oncol. 2013; 35:303–10.
18. Padron-Monedero A, Koru-Sengul T, Tannenbaum SL, Miao F, Hansra D, Lee DJ, Byrne MM. Smoking and survival in male breast cancer patients. Breast Cancer Res Treat. 2015; 153:679–87.
19. Crew KD, Neugut AI, Wang X, Jacobson JS, Grann VR, Raptis G, Hershman DL. Racial disparities in treatment and survival of male breast cancer. J Clin Oncol. 2007; 25:1089–98.
20. Tannenbaum SL, Koru-Sengul T, Miao F, Byrne MM. Disparities in survival after female breast cancer diagnosis: a population-based study. Cancer Causes Control. 2013; 24:1705–15.
21. Klein J, Ji M, Rea NK, Stoodt G. Differences in male breast cancer stage, tumor size at diagnosis, and survival rate between metropolitan and nonmetropolitan regions. Am J Men Health. 2011; 5:430–37.
22. Carey LA, Perou CM, Livasy CA, Dressler LG, Cowan D, Conway K, Karaca G, Troester MA, Tse CK, Edmiston S, Deming SL, Geradts J, Cheang MC, et al. Race, breast cancer subtypes, and survival in the Carolina Breast Cancer Study. JAMA. 2006; 295:2492–502.
23. Parise CA, Bauer KR, Brown MM, Caggiano V. Breast cancer subtypes as defined by the estrogen receptor (ER), progesterone receptor (PR), and the human epidermal growth factor receptor 2 (HER2) among women with invasive breast cancer in California, 1999–2004. Breast J. 2009; 15:593–602.
24. Chavez-Macgregor M, Clarke CA, Lichtensztajn D, Hortobagyi GN, Giordano SH. Male breast cancer according to tumor subtype and race: a population-based study. Cancer. 2013; 119:1611–7.