
INTRODUCTION
Chronic lymphocytic leukemia (CLL) is characterized by the accumulation of monoclonal mature B cells with a CD5+CD19+CD20dimIgdimCD23+CD43+CD27+ surface phenotype in the circulation [1, 2]. Several lines of evidence support a key role for B cell receptor (BCR) signaling in CLL pathogenesis. First, CLL with hypermutated immunoglobulin heavy chain variable (IGHV) genes (M-CLL) show a more favorable prognosis than those with unmutated IGHV genes (U-CLL) [3, 4]. Secondly, the IGHV repertoire is highly restricted, whereby stereotypic BCRs are found in multiple CLL patients [5]. Thirdly, CLL B cells often show increased basal activity of protein tyrosine kinases downstream of the BCR [6, 7]. Hereby, Bruton’s tyrosine kinase (Btk) has been shown to be essential for several constitutively active pathways implicated in CLL cell survival, including the Akt, ERK and NF-κB pathway [8–11]. Antitumor activity of the Btk small-molecule inhibitors ibrutinib and acalabrutinib was recently shown in clinical studies of relapsed/refractory CLL [12, 13]. Furthermore, CLL B cells manifest low surface IgM (sIgM) expression and their BCR signaling properties resemble those of anergic B cells. During in vitro culture they readily upregulate sIgM expression and regain BCR responsiveness [14–17]. Accordingly, CLL B cells have higher basal, cell-autonomous Ca2+ signaling, dependent on an internal BCR epitope [18, 19]. Alternatively, the recent identification of antigen-specificity of particular CLL B cells indicates that their proliferation and survival is driven by specific (auto)antigens [20, 21].
CLL B cells are thought to interact with the tissue microenvironment [22–24] and lymph node resident CLL cells show gene expression signatures indicative of BCR activation [25]. Btk may be involved in trafficking of CLL B cells to survival niches, because it also functions downstream of chemokine receptors such as CXCR4 and CXCR5 [11] and has been implicated in in vivo homing to lymphoid organs [26]. Accordingly, treatment of CLL cells with ibrutinib inhibited CXCL12/CXCL13-induced in vitro cell adhesion and migration [27, 28] and in CLL patients ibrutinib treatment resulted in a transient lymphocytosis, further underscoring the role of Btk in CLL-cell trafficking and homing [12].
Given the importance of intrinsic BCR signaling for survival and progression of CLL as well as support from the tumor microenvironment, research into CLL pathogenesis would benefit from systems that can explore both pathways. However, these approaches have been hampered by the limited in vitro survival and non-dividing characteristics of human CLL B cells. Those few available cell lines derived from CLL patients (CD5- MEC1 and MEC2 [29], PCL12 [30], OSU-CLL [31] and MDA-BM5 [32]) may represent EBV+ B-lymphoblastoid cells rather than bonafide B-CLL cells.
Mouse models have provided important insights into CLL pathogenesis. These particularly include the widely studied Eμ-TCL1 model, in which B-cell specific overexpression of the TCL1 oncogene results in spontaneous development of leukemic CD5+IgM+ B cells [33–35]. Effects of ibrutinib or the Syk inhibitor fostamatinib (R406) on Eμ-TCL1 leukemias have been tested, whereby the outcome mimicked clinical observations in patients [28, 36]. Another mouse model (IgH.TEμ) was generated in our lab and is based on sporadic expression of the SV40 large T oncogene in mature B cells [37]. This was achieved by SV40T insertion in opposite transcriptional orientation into the IgH locus DH-JH region. Aging IgH.TEμ mice show accumulation of monoclonal leukemic CD5+CD43+IgM+IgDlowCD19+ B cells, which is dependent on Btk expression and whereby Btk-mediated signaling enhances leukemogenesis [37, 38].
Despite their proven usefulness as pre-clinical tools, transgenic mouse models take substantial time (> 6 months) to develop CLL and are not suitable for large-scale screens of novel compounds or combination therapies. Therefore, we aimed to obtain stable CLL cell lines that can be cultured in vitro or transferred into mice in vivo. In addition, we aimed to explore whether these cell lines could serve as a platform for the investigation of CLL signal transduction and to investigate the efficacy of small molecule inhibitor combinations in CLL. Here, we describe the generation and characterization of three monoclonal CD5+CD43+IgM+CD19+ cell lines from IgH.TEμ mice. Parallel to human CLL, our cell lines exhibited constitutive activation of BCR downstream kinases.
RESULTS
Generation and characterization of cell lines from IgH.TEμ CLL mice
To obtain stable cell lines, single cell suspensions from spleens of aged IgH.TEμ mice [37] with high tumor load (> 90% CD5+CD43+IgM+CD19+ cells) were cultured under various conditions, with or without BAFF, a-CD40 antibodies and rIL-4. After 8 weeks outgrowth was observed in three independent cultures: EMC2, EMC4 and EMC6. The presence of BAFF, a-CD40 or rIL-4 did not appear to be critical and after the initial few passages the EMC cell lines were expanded in culture medium without supplements.
Flow cytometry analysis showed that the EMC cell lines maintained the CD5+CD43+IgM+CD19+ phenotype of the primary leukemia [37], even after prolonged (at least 22 weeks) in vitro culture (Figure 1A, Supplementary Figure 1A). Expression levels of the activation markers CD69 and CD86 were higher on the EMC cell lines than on control wild type (WT) splenic B-cells, but surface MHCII or CD25 was similar (shown for EMC6 in Figure 1B, Supplementary Figure 1A). Compared with WT B cells, the EMC cell lines exhibited stronger expression of CXCR4 and CCR7, but not CXCR5 (Figure 1B; Supplementary Figure 1A, 1B). The expression profiles of activation markers and chemokine receptors of the EMC cell lines resembled those of primary tumors from IgH.TEμ mice (n = 20), except for CD69 when compared to WT B cells (Figure 1B ; Supplementary Figure 1C).
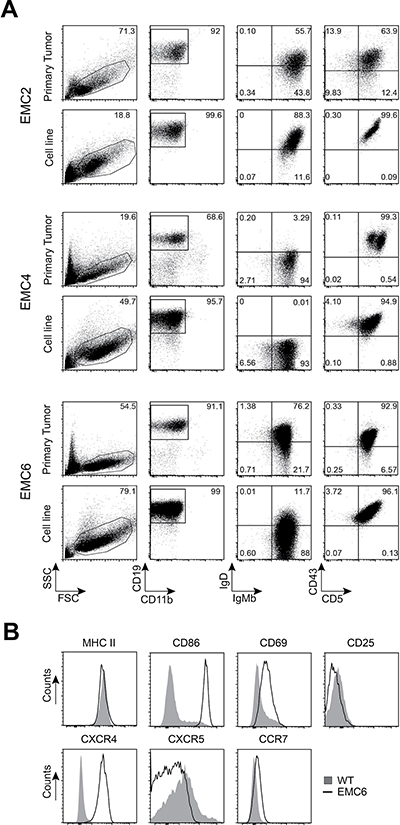
Figure 1: EMC cell lines resemble primary tumors from IgH.TEμ mice. (A) Phenotypic comparison of CLL cells from primary splenic tumor cells and established cell lines by flow cytometry. Gated CD11b-CD19+(second column) were analyzed for IgM/IgD (third column) and CD5/CD43 (fourth column). (B) Histograms showing expression of the indicated markers on gated CD19+ WT splenic cells (n = 4) and EMC6 cells, determined by flow cytometry. EMC4 and EMC2 showed similar expression profiles, unless indicated in text.
Thus, we generated three stable cell lines that maintained the CD5+CD43+IgM+CD19+ phenotype of the primary CLL, even after prolonged in vitro culture.
RNA sequencing reveals limited differences between EMC cell lines and their corresponding primary leukemias
To identify pathways involved in the outgrowth of the three cell lines from the corresponding primary tumors, we compared genome-wide RNA-seq gene expression profiles. We included resting and a-IgM-stimulated WT splenic B cells as controls. A principle component analysis (Figure 2A) revealed substantial differences between resting and activated WT splenic B cells and primary CLL. The three EMC cell lines clustered together, close to the primary tumors, with EMC6 showing the smallest difference to its corresponding primary leukemia (Figure 2A).
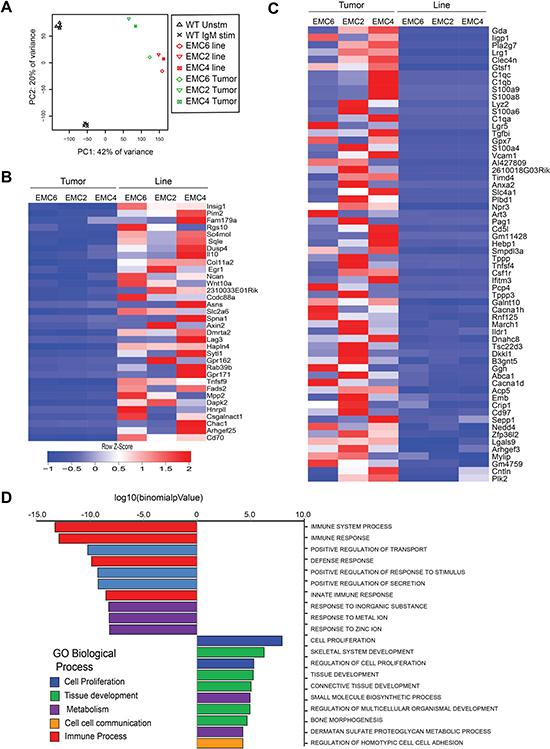
Figure 2: RNA-sequencing reveals limited differences between EMC cell lines and primary leukemias. (A) Principle component analysis comparing genome-wide RNA-Seq profiles in resting (Unstim, n = 4) or a-IgM-stimulated (IgM stim, n = 4) WT splenic B cells, primary tumors (green, n = 3) and EMC cell lines (red, n = 3). (B, C) Heat map showing variation in levels (Z-Score) of 34 upregulated (B) and 62 downregulated genes (C) in the EMC lines compared to primary tumors, ordered by p-value (Supplementary Table 1) (D) Top 20 biological processes enriched among differentially expressed genes in EMC cells and primary tumors (from MSigDB database).
Next, we performed differential gene expression analysis to identify 246 genes that showed more than 2-fold change between primary tumors and EMC cell lines, and from these we subsequently selected genes with FPKMs >1 in at least 2 samples. We identified 34 upregulated and 62 downregulated genes in the EMC cell lines, compared with the primary tumors (Figure 2B, 2C; See Supplementary Table 1A, 1B for expression values). Expression levels were confirmed by QPCR for a number of key genes, including Tnfsf9, Pim2, CD70 and Egr1, which are also highly expressed in human CLL [39–43] (Supplementary Figure 2A, 2B). Interestingly, the glucocorticoid-induced leucine zipper protein (GILZ), encoded by the Tsc22d3 gene, which inhibits the mTORC/AKT signaling pathway [44] was amongst the genes downregulated in the EMC cell lines (Supplementary Figure 2C). We did not find upregulation of anti-apoptotic genes, including Bcl-2, Bcl-XL or Mcl-1 in the EMC cell lines, compared to primary leukemias. However, expression of these anti-apoptotic genes was increased in both primary tumors and EMC cell lines, when compared to control WT splenic B cells (Supplementary Figure 2D).
The top 20 biological processes (Molecular Signatures Database MsigDB) [45] enriched within the differentially expressed genes in the EMC cell lines showed an overrepresentation of cell proliferation, metabolic and tissue development-related pathways (Figure 2D). Moreover, pathway analysis revealed a significant overlap with a gene set upregulated in “CLL expressing naturally phosphorylated CD5” (Insig1, Sqle, Tnfsf9, Asns, Pim2, Wnt-10A, IL-10, CD70, Rab39b) [46]. Other prominent signatures emerging from genes upregulated in the EMC cell lines compared to primary CLL tumors were “mTorc1 signaling” and “TNFα signaling via NFkB” (both with p = ~10–5, FDR<0.05; Supplementary Figure 2C).
In conclusion, the genome-wide expression profiles of the three cell lines closely resembled those of the primary tumors and suggest that mTorc1 signaling contributed to cell line outgrowth.
EMC cell lines express a VH11 BCR recognizing PtC and exhibit constitutive BCR signaling
Next, we determined the rearranged IGHV and IGLV DNA sequence of the EMC cell lines. Even though generated independently from three different mice, all three EMC cell lines expressed VH11.2*01 (HCDR3: CMRYSNYWYFDVW) together with VK14-126*01 (LCDR3: CLQHGESPYTF), which was identical to the corresponding primary tumors. This stereotypic VH11/VK14 BCR is known to be specific for phosphatidylcholine (PtC) [47] and is the prominent BCR found in both Eμ-TCL1 transgenic CLL [21] and in IgH.TEμ transgenic CLL [37, 38]. We could confirm uniform PtC binding of EMC cell lines, yielding similar staining intensities as WT peritoneal cavity B-1 cells (Figure 3A). Hereby, the signal for EMC6 was lower than for EMC2 and EMC4. PtC also induced Ca2+ flux in all three EMC cell lines, indicating that their BCRs did not only bind but also responded to PtC (Figure 3A).
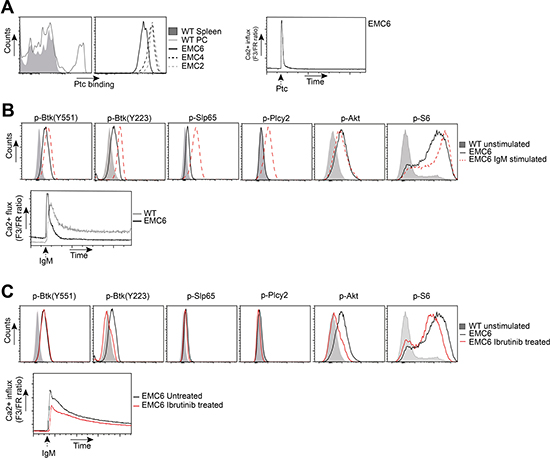
Figure 3: EMC cell lines recognize autoantigens and exhibit constitutive BCR signaling. (A) Left: Flow cytometric analysis of gated wildtype (WT) CD19+ splenocytes and CD19+CD5+ peritoneal cavity (PC) cells, and EMC cell lines stained with phosphatidylcholine (Ptc) liposomes. Right: Ca2+-flux analysis of PtC-stimulated EMC6. (B) Top: PhosFlow analysis of indicated phosphoproteins on gated unstimulated B220+CD3- WT splenocytes and EMC6 cells, and a-IgM-stimulated (20 μg/ml) EMC6 cells. Bottom: Comparison of basal or a-IgM stimulated Ca2+ influx between B220+CD3- WT splenic B cells and EMC6. (C) Top: PhosFlow analysis of indicated phosphoproteins on gated unstimulated B220+CD3- WT splenocytes and EMC6 cells and 1 mM ibrutinib-treated EMC6 cells. Bottom: Comparison of Ca2+-influx between untreated or 1 mM ibrutinib-treated EMC6 cells. For all analyses EMC6 cells are shown as representative of the three cell lines.
Next, we compared the activation status of BCR downstream signaling proteins between the cell lines and WT splenic B cells by intracellular flow cytometry for phosphorylated proteins (Phosflow). In the absence of external stimulation, the EMC cell lines exhibited significant phosphorylation of Btk (Y551;Y223), Slp65(Y84), Akt(S473) and its target S6 (Figure 3B, Supplementary Figure 3D). As phosphorylation of these proteins was not observed in resting B cells, these findings provided evidence for constitutively active BCR/Akt signaling in the EMC cell lines, which was corroborated by increased basal Ca2+ signals (Figure 3B, Supplementary Table 3). Importantly, the constitutive BCR/Akt signaling in the EMC cell lines was stable over 22 weeks of in vitro culture (Supplementary Figure 3E). In line with our previous report [37, 38], constitutively active Btk signaling was not apparent in primary IgH.TEμ CLL cells, but these cells had low but detectable expression of p-Akt and substantial levels of p-S6 (Supplementary Figure 3A). Anti-IgM stimulation of EMC cell lines further increased p-Btk(Y551/Y223), p-Slp65(Y84), induced p-Plcγ2(Y759), but did not further increase p-Akt(S473) expression (Figure 3B). Thus, in the EMC cell lines constitutive Btk activation was suboptimal and did not result in detectable Plcγ2(Y759) phosphorylation, but could be further enhanced by BCR stimulation. In addition, we found that the EMC cell lines had high basal Ca2+ and less sustained Ca2+ elevation in response to a-IgM stimulation, compared with WT B cells (Figure 3B), which represent key features of the anergic phenotype of human CLL B cells [14–17] . Because of the similarities between the EMC cell lines, for most of the experiments described below, we focused on EMC4 and EMC6.
Next, we investigated whether constitutively active BCR signaling in the EMC cell lines was dependent on Btk kinase activity. We found that in the presence of ibrutinib the signals specific for p-Btk(Y223) but not for p-Btk(Y551) were substantially reduced (Figure 3C). Whereas the effect of ibrutinib treatment on lowering basal p-Slp65 was less apparent, it clearly downregulated p-Akt(S473) and pS6. In the presence of ibrutinib, the a-IgM induced Ca2+ influx was also slightly reduced (Figure 3C, Supplementary Figure 3B). Constitutive Btk(Y551) phosphorylation was Syk kinase independent, because addition of the Syk inhibitor R406 did not affect p-Btk(Y551), nor p-Akt(S473) signals (Supplementary Figure 3C). However, R406 did decrease p-Slp65(Y84), p-Plcγ2(Y759) and a-IgM induced Ca2+ influx (Supplementary Figure 3C).
Collectively, these findings show that the EMC cell lines are monoclonal, express a PtC-specific VH11/VK14 BCR and exhibit stable constitutive Btk and Akt activation. Constitutive Btk(Y551) phosphorylation was Syk-independent and Btk(Y223) autophosphorylation was suboptimal. Whereas upon a-IgM stimulation of the EMC cell lines p-Slp65(Y84) and p-Plcγ2(Y759) were induced, Ca2+ influx was limited, congruent with an anergic response to BCR stimulation.
EMC cell lines provide a novel in vitro tool to test therapeutic drugs for CLL
The prolonged stability of the EMC cell lines in culture enabled us to test their sensitivity towards different classes of DNA damaging agents. The cell lines were relatively resistant to Fludarabine (LC50 = 17 μM), a purine analogue widely used in combination regimens in CLL. The cells turned out to be highly resistant to cisplatin (LC50 = 9.73 μM), which is used in combination regimens in chemorefractory patients. These data are compatible with p53 dysfunction in IgH.TEμ mice [37] and lack of induction of the p53 target gene Puma following 24 h of treatment [48]. Interestingly, the EMC cell lines were sensitive to the topoisomerase II inhibitor etoposide (LC50 = 0.24 μM) (Supplementary Figure 4A, 4B), allowing in vitro testing of combination strategies including genotoxic agents.
To investigate the role of constitutively active Btk and Akt on EMC cell viability and proliferation, we performed propidium iodide DNA content analyses following overnight treatment with ibrutinib, idelalisib or vehicle as controls. In the presence of ibrutinib and idelalisib the proportions of apoptotic (sub-G1) and cycling (S/G2/M) cells were significantly increased and decreased, respectively (Figure 4A, 4B). To quantify the effect of combination treatment, we calculated combination index (CI) values [49] and observed synergistic effects (CI value < 1) on viability and proliferation when the two inhibitors were combined. Interestingly, ibrutinib induced a G1 cell-cycle arrest in EMC6 (Figure 4A). Therefore, we evaluated the impact of ibrutinib on different families of apoptosis and proliferation regulators. Ibrutinib treatment alone showed >2 fold downregulation of survivin mRNA expression (Supplementary Figure 4C–4F), which was highly expressed in both primary tumors and EMC cell lines, when compared to control WT splenic B cells (Supplementary Figure 2D). Since survivin has been shown to be downstream of the PI3K/Akt pathway in CLL [50], it further validates the importance of constitutive Akt signaling in the EMC cell lines. Ibrutinib or idelalisib also significantly inhibited integrin-mediated adhesion to fibronectin in vitro, again showing a synergistic effect (CI value < 1) when these inhibitors were combined (Figure 4C, Supplementary Figure 4G).
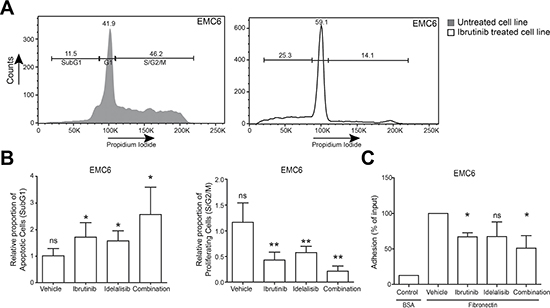
Figure 4: EMC cell lines provide novel in vitro tools to test therapeutic drugs for CLL. (A) Gating strategy for DNA content (Propidium Iodide) analysis of EMC6 cells after 24 h culture in the absence or presence of Ibrutinib. Numbers indicate proportions of cells in the respective gates. (B) Relative proportions of cycling (S/G2-M) and apoptotic (sub-G1) EMC6 cultured (n = 3, in duplicate) in the presence of either ibrutinib (5 nM), idelalisib (100 nM) or in combination. Graphs are presented as normalized mean ± SEM (Untreated EMC6 cells were set to 1). (C) In vitro adhesion to fibronectin. EMC6 cells were pretreated with ibrutinib (10 nM), idelalisib (100 nM) or a combination (n = 3, in triplicate). Graphs are presented as normalized mean ±SD (100%= vehicle-treated EMC6 cells). *P < 0.05, **P < 0.01 (paired one-sample T-test).
Collectively, these results show the importance of constitutively active Btk and Akt signaling for survival, proliferation and adhesion of the EMC cell lines in in vitro cultures.
Engraftment of EMC cell lines into Rag1–/– mice as a tool to study novel CLL therapeutics
To test their tumorigenic potential, we transferred 1–5 × 10⁶ EMC cells into Rag1-/- mice [51] by i.p. injection (Figure 5A). From 2 weeks post-engraftment onwards, a population of CD5+CD43+IgM+CD19+ B cells was detectable; these cells were not only present in peripheral blood, but also in various lymphoid organs, including spleen, bone marrow and mesenteric lymph node (shown for EMC4-engrafted mice, 4 weeks after transfer in Figure 5B).
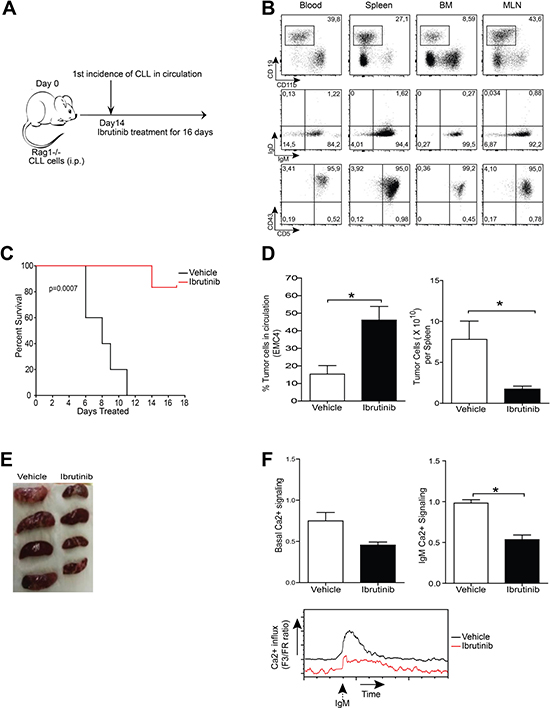
Figure 5: Leukemia induction following EMC cell engraftment as a tool to study therapeutics. (A) Experimental timeline of EMC cell transfer. (B) Flow cytometric analysis of blood, spleen, bone marrow (BM) and mesenteric lymph node (MLN) of Rag1-/- mice after 4 weeks of engraftment of 5x10⁶ EMC4 cells. CD19+CD11b- cells were gated (left column) and analyzed for IgM/IgD and CD5/CD43 in the indicated tissues. Dot plots are representative of successful EMC cell engraftment. (C) Kaplan-Meier survival curve over 16 days of ibrutinib or vehicle treatment of EMC6- engrafted Rag1-/- mice (n = 8 mice/group). (D) Proportions of circulating leukemic cells (left) and absolute number of leukemic cells in spleen (right), 16 days after treatment of EMC4-engrafted mice with vehicle or ibrutinib (n = 4 mice/group). (E) Spleens from EMC4-engrafted mice treated for 16 days with vehicle or ibrutinib. (F) Comparison of basal and a-IgM-stimulated (20 μg/ml) Ca2+-influx ex vivo on splenic tumor cells from EMC4-engrafted mice treated for 16 days with vehicle or ibrutinib. Representative (n = 4) MFI kinetics plot of Ca2+ signaling (bottom) from each group.*P < 0.05 (n = 4 mice/group, Mann-Whitney U test).
To test the effects of ibrutinib in vivo, we compared mouse survival in EMC6-engrafted mice that received either ibrutinib or vehicle. Two weeks after engraftment mice were randomized and ibrutinib or vehicle treatment was initiated and continued for 16 days (Figure 5A). Whereas in the vehicle group mice had to be euthanized as their condition went down rapidly, a major proportion (~80%) of the ibrutinib treatment group was still alive after 16 days of treatment (Figure 5C).
Next, we investigated if ibrutinib treatment affected disease progression. EMC4-engrafted mice were randomized to receive either ibrutinib or vehicle. After 3 and 12 days of treatment, the proportions of circulating CD5+CD43+IgM+CD19+ B-cells were not different between the two groups (Supplementary Figure 5). However, at the end of the 16-day treatment cycle, a major proportion of the control group exhibited lethargy, hunched posture or other disabling symptoms. Therefore, animals from both arms were sacrificed to compare disease progression. The ibrutinib-treated group had a significant increase of circulating tumor cells, compared with the vehicle-treated group (Figure 5D). Vehicle-treated mice had massive splenomegaly, while ibrutinib-treated mice had smaller spleens with significantly lower leukemic CD5+CD43+IgM+CD19+ B cell counts (Figures 5D and 5E). No significant differences were found in the leukemic cell counts in bone marrow and mesenteric lymph nodes in the two groups (data not shown). Interestingly, ibrutinib-treated mice displayed lower basal Ca2+ signaling and significantly reduced Ca2+ influx following a-IgM stimulation, compared with vehicle-treated control mice (Figure 5F).
Thus, our data demonstrate that we have established a novel in vivo CLL engraftment model by adoptive transfer of EMC cell lines into Rag1-/- mice. Importantly, EMC cells remained sensitive to ibrutinib treatment in vivo.
EMC4 Leukemic cells acquire an anergic phenotype when engrafted
Leukemic B cells from the spleens of EMC4-engrafted mice showed only limited induction of Ca2+ flux upon a-IgM stimulation ex vivo (Figure 5F), which was in stark contrast to our previous observation of a substantial a-IgM driven Ca2+ flux in cultured EMC4 cells (Supplementary Figure 3B).
Therefore, we compared a-IgM-induced Ca2+ flux between leukemic cells isolated directly from spleens of EMC4-engrafted mice (ex vivo) with long-term in vitro cultured EMC4 cells. Unlike in vitro cultured EMC4 cells, the ex vivo EMC4 cells from engrafted mice showed limited induction of intracellular Ca2+ flux upon BCR stimulation (Figure 6A). However, when these EMC4 cells isolated from engrafted mice were cultured for 48h, they regained their BCR responsiveness and Ca2+ flux was similar to in vitro cultured EMC4 cells (Figure 6B).
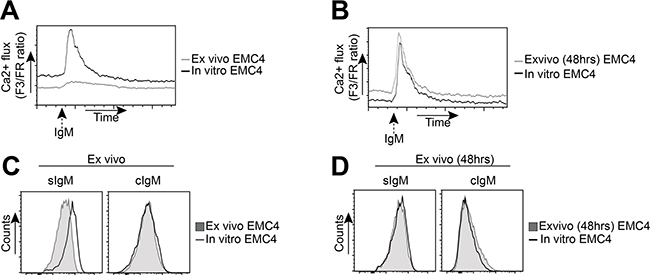
Figure 6: EMC4 cell lines acquire a more anergic phenotype upon engraftment. (A, B) Flow cytometry analysis of a-IgM-stimulated (20 μg/ml) Ca2+-influx between leukemic cells, directly isolated from EMC4-engrafted mice (A, grey line) or after 48 hours of culture (B, grey line), compared with in vitro cultured (non-transferred) EMC4 cells (A,B: solid black line). (C, D) Expression of surface IgM (sIgM) and cytoplasmic IgM (cIgM) between CD5+CD19+CD43+ splenic leukemic cells from EMC4-engrafted mice analyzed directly after isolation (C, shaded area) or after 48 hours of culture (D, shaded area), compared with an in vitro cultured (non-transferred) EMC4 cells (solid black line).
Interestingly, the freshly isolated leukemic cells from EMC4-engrafted mice showed low sIgM expression compared with in vitro cultured EMC4 cells (Figure 6C, left). Upon 48h culturing of the isolated leukemic cells, this difference in sIgM expression with in vitro cultured EMC4 cells was no longer detected (Figure 6D, Left). The sIgM upregulation was already apparent at 24h (data not shown). We did not see any difference in the cytoplasmic IgM (cIgM) expression (Figure 6C, 6D, right). We therefore conclude that EMC4 cells become anergic to BCR stimulation following engraftment in Rag1-/- mice, whereby they downregulate sIgM expression.
DISCUSSION
Proliferation and survival of CLL B-cells are thought to be regulated by intracellular signaling pathways activated by various stimuli from the microenvironment. However, spontaneous apoptosis of CLL cells when cultured in vitro has hampered CLL research. Here, we describe the generation of three monoclonal mouse cell lines (EMC2, EMC4 and EMC6) from the SV40 large T antigen-based IgH.TEμ CLL mouse model. These cell lines can be cultured in vitro for long periods of time and transferred into mice, thus providing a platform to study BCR signaling in CLL and to investigate the efficacy of small molecule inhibitors. The EMC cell lines were remarkably similar to the primary tumors and our analyses indicate that the major pathways associated with their in vitro outgrowth are downstream of the BCR (Btk and Akt), CD5 and TNFa/NFkB. Stereotypic BCRs with specific IGHV usage [5] and reactivity towards common antigens [20, 21] are characteristic features of CLL. It was remarkable that all three EMC cell lines, even though generated from three different mice, express the stereotypic Ig VH11/Vκ14 genes and recognize PtC. Moreover, we did not see outgrowth of other non-VH11 clones in vitro. This may suggest that self-reactivity might drive the selection and outgrowth of these cell lines in in vitro cultures. Recently, the usefulness of the stable human CLL cell lines MEC-1 & MEC-2 to test effects of kinase inhibitors such as ibrutinib was shown [52]. Nevertheless, these cell lines are derived from EBV+ B cells and do not stably express surface CD5 and CD43 [29]. In contrast, EMC cell lines show stable surface expression of CD5 and intact downstream signaling, as several known downstream CD5 targets were upregulated.
Human CLL cells show aberrant BCR signaling, whereby the downstream Btk/Plcγ2/Ca2+ and PI3K/Akt pathways are thought to be constitutively activated, resulting in increased proliferation and survival [8–10]. We show that our EMC cell lines exhibit in vitro - thus in the absence of any stimulatory signals from the microenvironment - constitutive activation of p-Btk(Y551/Y223) and downstream basal Ca2+ signaling, paralleling human CLL. However, constitutive Btk signaling was apparently suboptimal, given the lack of phosphorylation of its main substrate PLCγ2(Y759), and was associated with BCR hyporesponsiveness. BCR anergy was also evident in vivo, because EMC4-engrafted cells downregulated sIgM and lacked a-IgM-induced Ca2+ influx. Additionally, EMC cells exhibited constitutively active Akt/S6 signaling, possibly because of the ability of SV40T protein to induce cell survival via Akt [53]. This is remarkably similar to the most extensively studied CLL mouse model, Eμ-TCL1, in which TCL-1 expression has also been functionally linked to enhanced Akt signaling [34]. However, to the best of our knowledge stable Eμ-TCL1 leukemia-derived cell lines have not been reported to date.
Evidence is emerging that the efficacy of the novel CLL therapeutics ibrutinib and idelalisib is not only based on their effects on BCR-mediated survival and proliferation, but also on cellular adhesion and migration in the context of the CLL microenvironment [12, 27, 28, 54]. We indeed observed that these inhibitors reduced EMC cell line proliferation and viability, as well as adhesion towards fibronectin. The reduced survival of EMC cell lines was due to inhibition of PI3K/Akt/Survivin signaling, as also shown for human CLL [50]. Although we did not find evidence for a role of Bcl-2 family members in the outgrowth of the EMC cell lines, upon treatment with the Bcl-2 inhibitor ABT-199 the EMC cell lines also underwent apoptosis (S.P.S. unpublished results). Thus, next to exhibiting a similar phenotype to human CLL, the EMC cell lines also recapitulate key responses to kinase inhibition therapies in vitro. We conclude that the EMC cell lines are well suited for high-throughput screening for efficacy or studies on the mechanism of action of novel compounds combinations for CLL treatment. Moreover, due to the transferability of EMC cells into Rag1-/- mice in vivo responses can be evaluated as well. The rapid CLL development in these engrafted mice facilitates the evaluation of therapeutic strategies within reasonable time schedules and contrasts with the slow disease development in CLL mouse models [33, 35, 37]. Unfortunately, we have been unsuccessful in establishing EMC cell engraftment in WT mice, which might be related to their mixed C57Bl6x129 background. Nevertheless, ibrutinib treatment of EMC-engrafted Rag1-/- mice resulted in increased circulating CLL cell numbers and concurrently decreased tumor load in the spleen, as well as prolonged survival, thus recapitulating key features of ibrutinib therapy in clinical studies of relapsed/refractory CLL [12].
Patients harboring del(17p13.1) or TP53 mutations represent a difficult to treat CLL subgroup, warranting development of novel targeted agents. Our EMC cell lines likely reflect a CLL subtype with dysfunctional p53 due to interaction with SV40 large T protein [37, 55, 56]. This was further supported by a lack of induction of p53 target gene PUMA upon fludarabine treatment. Therefore, EMC cell lines specifically provide a tool to dissect novel treatment options for CLL with a dysfunctional p53 pathway.
In summary, we have generated stable monoclonal cell lines from a CLL mouse model that exhibits constitutive Btk and Akt signaling, presents several features of human CLL and responds to novel targeted therapies. These EMC cell lines thus provide a novel in vitro and in vivo preclinical platform to study CLL cell biology and to test efficacy of novel targeted therapy combinations.
MATERIALS AND METHODS
EMC cell line culture
Single-cell suspensions (1 × 10⁶ cells/ml) obtained from spleen from IgH.TEμ mice, which were on a mixed C57Bl/6 × sv129 background (EMC6) or on the Aicd-/- (C57Bl/6 × sv129) background [57] (EMC2 and EMC4). These IgH.TEμ mice were diagnosed with leukemia on the basis of a high tumor load (> 90% CD5+CD43+IgM+CD19+ cells) in peripheral blood. Leukemic cells were cultured in medium (RPMI 1640, 10% FCS, 50 ug/ml gentamycin, 50 μM 2-mercapto-ethanol, all components from Life TechnologiesTM), under various conditions, with or without BAFF (25ng/ml, R&D Systems), α-CD40 antibodies (20 ug/ml, R&D Systems), rIL-4 (50 ng/ml, Peprotech) and incubated at 37°C in the presence of 5% CO2. After initial passages, the EMC cell lines continued to expand in the absence of added growth factors and therefore the cell lines were propagated in culture medium only. For optimum growth, the EMC4 and EMC6 cell lines were propagated in dilution of 0.25 × 10⁶ cells/ml and EMC2 cell lines were propagated in dilution of 0.5 × 10⁶ cells/ml. Once growing in culture the doubling time for the EMC6 and EMC4 lines were ~36 hours and for EMC2 ~72 hours. The culture media were refreshed twice a week. The cultures were stopped after 12 weeks of the initial culture and vials were frozen. For subsequent experiments, vials were thawed and expanded. All experiments were performed one day after refreshing medium and expanding cell culture. For all in vitro assays cells were plated in dilution of 1x10⁶ cells/ml.
Adoptive transfer into Rag1-/- mice and ibrutinib treatment
For adoptive transfer, 5 × 10⁶ EMC4 cells or 1 × 10⁶ EMC6 cells were injected intraperitoneally (i.p.) into Rag1-/- mice [51]. Mice were monitored for leukemia development by regular blood screening for the presence of CD5+CD43+IgM+CD19+ leukemic cells: at day 7, 10 and 14 after engraftment subgroups of mice were tested. Mice were euthanized when they developed signs of sickness, such as lethargy, aversion to activity, shallow or labored breathing and other disabling symptoms.
Ibrutinib (Chiralstar, USA) treatment was initiated 2 weeks following engraftment in mice with > 2% leukemic cells in the circulation, as detected by flow cytometry. Mice were randomized into ibrutinib and vehicle treatment group and ibrutinib (25 mg/kg in water/5%mannitol/0.5%gelatin) or vehicle was orally administered to the mice once daily for 16 days. Mice were euthanized when they developed signs of severe disease, as described above, or at the end of the 16-day treatment cycle.
Mice were housed at the Erasmus MC experimental animal care facility under specific pathogen-free conditions. Animal procedures were reviewed and approved by the Erasmus MC Animal Experiments Committee.
Flow cytometry procedures
Preparation of single-cell suspensions of lymphoid organs and lysis of red blood cells were performed according to standard procedures. Cells were directly stained in the appropriate buffer using the following fluorochrome-conjugated monoclonal antibodies: anti-CD19 (1D3, eBioscience), anti-CD5 (53-7.3, eBioscience), anti-CD43 (S7, BD), anti-IgD (11-26, BD), anti-IgM (Il/41, eBioscience), anti-CD3 (17A2, eBioscience), anti-CD11b (M1/70, eBioscience), anti-MHCII (M5/114.15.3, eBioscience), anti-CD86 (GL1, BD), anti-CD69 (H1.2F3, eBioscience), anti-CD25 (PC61.5, eBioscience), anti-CXCR4 (2B11, BD), anti-CXCR5 (2G8, BD), anti-CCR7 (4B12, eBioscience). All flow cytometric measurements were performed on a LSRII flow cytometer (BD Biosciences) and results were analyzed using FlowJo-V10 software (TreeStar).
For intracellular flow cytometry analysis of phosphorylated proteins (Phosflow), cells were starved for 10 min at 37°C in FCS-free “RPMI-plus” medium (RPMI 1640 from Life TechnologiesTM) and subsequently stimulated with 20 μg/ml goat anti-mouse F(ab’)2 anti-IgM fragments (Jackson Immunoresearch) for 5 min (for p-Btk, p-Slp65, p-Plcγ2) or 3 hrs (for p-Akt, p-S6). Unstimulated control cells were treated in parallel without F(ab’)2 α-IgM. Following stimulation, cells were fixed in Cytofix fixation buffer (BD Bioscience) for 10 min at 37°C and permeabilized with Perm Buffer III (BD Biosciences) at –20°C for 30 min. The cells were then stained with either with fluorochrome-conjugated anti-p-Btk(Y551), anti-p-Btk(Y223), anti-p-Slp65/BLNK(Y84), anti-p-Plc-y2 (Y759) antibodies (all from BD Biosciences) or with unconjugated anti-p-Akt(S473), anti-p-S6 (all from Cell Signaling Technology) and PE-conjugated secondary antibody (Jackson ImmunoResearch). WT splenic cell suspensions were stained extracellularly with anti-B220 (RA36B2, eBioscience) and CD3 (145-2c11, BD) before fixation.
Calcium (Ca2+) flux assays
Intracellular Ca2+ flux was measured using the Fluo3-AM and Fura Red-AM fluorogenic probes (Life Technologies), as previously detailed [19]. In brief, mouse splenocytes (5 × 10⁶) were incubated with 5 μM Fluo3-AM and 5 μM Fura Red-AM in loading buffer (HBSS medium supplemented with 10 mM HEPES and 5%FCS) at 37°C for 30 min in the dark. To gate for untouched B cells in WT splenocytes, we added biotinylated Abs to NK1.1 (PK136, BD), CD4 (GK1.5, BD), CD8a (53–6.7, BD), Ter119 (BD), CD11c (N418, ebiosciences), Gr-1 (RB6-8C5, ebiosciences), and FcRεI (MAR-1, ebiosciences) for the final 10 min of incubation. Cells were subsequently washed and stained with fluorochrome-conjugated streptavidin at RT for 10 min as a second step for biotin-conjugated antibodies. Cells were then washed, resuspended in buffer (HBSS medium with 10 mM HEPES, 5%FCS and 1 mM CaCl2), filtered and left for at least 30 min at RT. Cells were warmed to 37°C for 5 min before acquisition of events.
Basal intracellular Ca2+ levels were measured for 60 s, followed by BCR stimulation with either 20 μg/ml goat anti-mouse F(ab’)2 anti-IgM fragments or plain control liposomes (DOPC/CHOL 55:45, Formumax Scientific Inc.) and measured for 5–7 min. At the end of each Ca2+ measurement, cells were stimulated with 4 μg/ml ionomycin (Life Technologies, Carlsbad, California, USA) to measure maximum Ca2+ signaling.
To determine effects of ibrutinib on Ca2+ mobilization, 5 × 10⁶ EMC cells and WT splenocytes were pre-incubated in culture medium with or without ibrutinib (1 μM) at 37°C for 3 h. Staining and Ca2+ mobilization measurements were performed as described above.
Cell cycle and viability assays
To evaluate the effect of ibrutinib on survival and proliferation, 1 × 10⁶ EMC cells were placed in culture medium, with or without the appropriate concentration of ibrutinib at 37°C for 24 h. Following treatment, cells were fixed with ethanol and stained with propidium iodide, according to the instructions of the manufacturer (Life TechnologiesTM). Cell cycle analysis was performed as previously described [58].
For testing sensitivity to chemotherapeutic agents, EMC cell lines were incubated with different concentrations of Etoposide, Cisplatin or Fludarabine from Sigma Chemical (St.Louis, MO) for 24 h. Viability was measured by DiOC6/PI staining as described [59]. Relative viability was defined as [% viable cells treated condition/ % viable cells in medium control] × 100.
Adhesion assay
EMC Cells were treated with either ibrutinib (10 nM) or idelalisib (100 nM) or a combination and allowed to adhere to fibronectin-coated surfaces and adhesion to fibronectin-coated plates was measured as described previously [27].
RNA sequencing from naïve, activated and CLL B cells
Splenic single-cell suspensions were prepared in magnetic-activated cell sorting (MACS) buffer (PBS/2 mM EDTA/0.5%BSA) and naïve splenic B cells from 8–12 week-old WT C57BL/6 mice were purified by MACS, as previously described [60]. Non-B cells, B-1 cells, germinal center B cells and plasma cells were first labeled with biotinylated antibodies (BD Biosciences) to CD5 (53–7.3), CD11b (M1-70), CD43 (S7), CD95 (Jo2), CD138 (281-2), Gr-1 (RB6-8C5) and TER-119 (PK136) and subsequently with streptavidin-conjugated magnetic beads (Miltenyi Biotec). Purity of MACS-sorted naïve B cells was confirmed by flow cytometry (typically > 99% CD19+ cells). To obtain activated B cells, purified naïve B cells were cultured in RPMI culture medium in the presence of 10 μg/ml F(ab’)2 anti-IgM (Jackson Immunoresearch) for 12 h.
RNA was extracted from naive or activated splenic B cells, as well as from purified EMC2, EMC4 and EMC6 primary tumors (using MACS-purification for CD19+ cells) and from the three EMC cell lines from IgH.TEμ mice with Qiagen’s RNeasy Mini and Micro kits according to manufacturer’s instructions followed by DNase treatment. To facilitate comparisons with resting and activated B cells, MACS purified naïve mature splenic B cells from WT mice, either directly or after 12 hours of stimulation with a-IgM were included. The purity of sorted cells (typically > 99% CD19+ cells) was confirmed by flow cytometry.
Total mRNA sequencing was performed on a HiSeq 2500 (Illumina), and raw reads were aligned using Bowtie to murine transcripts (RefSeq) corresponding to the University of California at Santa Cruz (UCSC) mouse genome annotation (NCBI37/mm9) [61]. Statistical analysis of the RNAseq data was performed using HTseq and edgeR. Gene counts were computed using HTseqCount [62]. Differential gene expression analysis was performed using EdgeR with a false discovery rate (FDR) < 0.05 and a log2-fold change cutoff of 1 [61]. Gene counts were converted to logCPM (log counts per million) values for principle component analysis (PCA), which was performed in R, a language for statistical computing (http://www.r-project.org). For generating heatmaps and molecular pathway enrichments the differentially expressed gene list was further filtered for genes with an absolute FPKM value of >1 in at least 2 samples in either group. Molecular pathway enrichments were obtained from the MSigDB [45].
Quantitative real time (RT-) PCR analysis
For quantitative RT-PCR analysis, TaqMan probes were employed. Probe Finder software (Roche Applied Science), the Universal Probe Library (Roche Applied Science) and Ensembl genome browser (http://www.ensembl.org/) were used for primer and probe design. Taqman Universal Master Mix II, was purchased from Thermo Fisher Scientific. For 15 μl RT-PCR reaction, 7.5 μl master mix, 4.15 μl nuclease-free water, 0.6 μl forward and reverse primer (10pmol/ul) and 0.15μl probe was added to the cDNA per reaction. Quantitative RT-PCR was performed by using the 7300 Real Time PCR system (Applied Biosciences) according to manufacturer’s instructions. Gene expression was analyzed with an ABI Prism 7300 Sequence Detector and ABI Prism Sequence Detection Software version 1.4 (Applied Biosystems). Cycle-threshold levels were calculated for each gene and housekeeping gene glyceraldehyde-3-phosphate dehydrogenase (Gapdh) was used for normalization of the values. All primer sequences and probe numbers are listed in Supplementary Table 2.
Statistical analysis
Statistical analysis was performed using GraphPad Prism software (San Diego, California, USA). For calculating levels of significance, for differences between groups of continuous data we used Mann-Whitney U test. To compute synergistic effects of combination treatments we used CompuSyn (version 1.0) software based on Chou and Talalay method [49]. The log rank test was used for calculating the level of significance for survival differences between differently treated mice groups. The one-sample T-test was used to determine the significance of differences between means and normalized values (100%).
Authors’ contributions
SPS designed the research studies, performed experiments, analyzed the data, and wrote the manuscript. SYP, MJWB, ES and AK performed experiments. SYP, OBJC, AM, APK, MS, WvIJ and AWL contributed to the research design. WvIJ, RS and HJH analyzed deep-sequencing data. RWH contributed to the research design and the writing of the manuscript and supervised the study. All co-authors approved the final manuscript.
ACKNOWLEDGMENTS
We thank Laurens Kil, Melanie Lukkes, Mariana Almeida (all Erasmus MC) and Hermann Eibel (University Medical Center, Freiburg) for assistance and advice.
CONFLICTS OF INTEREST
The authors declare no conflicts of interest.
FUNDING
These studies were supported by the Dutch Cancer Society (KWF 2014-6564), the Association for International Cancer Research (10-562) and the Dutch Arthritis Foundation (13-02-301)(to R.W.H) and the Netherlands Organization for Scientific Research (to S.P.S). R.S. was supported by an EMBO Long-term Fellowship (ALTF 1201-2014) and a Marie Curie Individual Fellowship (H2020-MSCA-IF-2014).
REFERENCES
1. Miller KD, Siegel RL, Lin CC, Mariotto AB, Kramer JL, Rowland JH, Stein KD, Alteri R, Jemal A. Cancer treatment and survivorship statistics, 2016. CA Cancer J Clin. 2016; 66:271–289.
2. Chiorazzi N, Rai KR, Ferrarini M. Chronic lymphocytic leukemia. N Engl J Med. 2005; 352:804–815.
3. Damle RN, Wasil T, Fais F, Ghiotto F, Valetto A, Allen SL, Buchbinder A, Budman D, Dittmar K, Kolitz J, Lichtman SM, Schulman P, Vinciguerra VP, et al. Ig V gene mutation status and CD38 expression as novel prognostic indicators in chronic lymphocytic leukemia. Blood. 1999; 94:1840–1847.
4. Hamblin TJ, Davis Z, Gardiner A, Oscier DG, Stevenson FK. Unmutated Ig V(H) genes are associated with a more aggressive form of chronic lymphocytic leukemia. Blood. 1999; 94:1848–1854.
5. Agathangelidis A, Darzentas N, Hadzidimitriou A, Brochet X, Murray F, Yan XJ, Davis Z, van Gastel-Mol EJ, Tresoldi C, Chu CC, Cahill N, Giudicelli V, Tichy B, et al. Stereotyped B-cell receptors in one-third of chronic lymphocytic leukemia: a molecular classification with implications for targeted therapies. Blood. 2012; 119:4467–4475.
6. Contri A, Brunati AM, Trentin L, Cabrelle A, Miorin M, Cesaro L, Pinna LA, Zambello R, Semenzato G, Donella-Deana A. Chronic lymphocytic leukemia B cells contain anomalous Lyn tyrosine kinase, a putative contribution to defective apoptosis. J Clin Invest. 2005; 115:369–378.
7. Buchner M, Fuchs S, Prinz G, Pfeifer D, Bartholome K, Burger M, Chevalier N, Vallat L, Timmer J, Gribben JG, Jumaa H, Veelken H, Dierks C, et al. Spleen tyrosine kinase is overexpressed and represents a potential therapeutic target in chronic lymphocytic leukemia. Cancer Res. 2009; 69:5424–5432.
8. Cheng S, Ma J, Guo A, Lu P, Leonard JP, Coleman M, Liu M, Buggy JJ, Furman RR, Wang YL. BTK inhibition targets in vivo CLL proliferation through its effects on B-cell receptor signaling activity. Leukemia. 2014; 28:649–657.
9. Herman SE, Mustafa RZ, Gyamfi JA, Pittaluga S, Chang S, Chang B, Farooqui M, Wiestner A. Ibrutinib inhibits BCR and NF-kappaB signaling and reduces tumor proliferation in tissue-resident cells of patients with CLL. Blood. 2014; 123:3286–3295.
10. Liao W, Jordaan G, Coriaty N, Sharma S. Amplification of B cell receptor-Erk signaling by Rasgrf-1 overexpression in chronic lymphocytic leukemia. Leuk Lymphoma. 2014; 55:2907–2916.
11. Hendriks RW, Yuvaraj S, Kil LP. Targeting Bruton’s tyrosine kinase in B cell malignancies. Nat Rev Cancer. 2014; 14:219–232.
12. Byrd JC, Furman RR, Coutre SE, Flinn IW, Burger JA, Blum KA, Grant B, Sharman JP, Coleman M, Wierda WG, Jones JA, Zhao W, Heerema NA, et al. Targeting BTK with ibrutinib in relapsed chronic lymphocytic leukemia. N Engl J Med. 2013; 369:32–42.
13. Byrd JC, Harrington B, O’Brien S, Jones JA, Schuh A, Devereux S, Chaves J, Wierda WG, Awan FT, Brown JR, Hillmen P, Stephens DM, Ghia P, et al. Acalabrutinib (ACP-196) in Relapsed Chronic Lymphocytic Leukemia. N Engl J Med. 2016; 374:323–332.
14. Mockridge CI, Potter KN, Wheatley I, Neville LA, Packham G, Stevenson FK. Reversible anergy of sIgM-mediated signaling in the two subsets of CLL defined by VH-gene mutational status. Blood. 2007; 109:4424–4431.
15. Stevenson FK, Forconi F, Packham G. The meaning and relevance of B-cell receptor structure and function in chronic lymphocytic leukemia. Semin Hematol. 2014; 51:158–167.
16. Muzio M, Apollonio B, Scielzo C, Frenquelli M, Vandoni I, Boussiotis V, Caligaris-Cappio F, Ghia P. Constitutive activation of distinct BCR-signaling pathways in a subset of CLL patients: a molecular signature of anergy. Blood. 2008; 112:188–195.
17. Packham G, Krysov S, Allen A, Savelyeva N, Steele AJ, Forconi F, Stevenson FK. The outcome of B-cell receptor signaling in chronic lymphocytic leukemia: proliferation or anergy. Haematologica. 2014; 99:1138–1148.
18. Duhren-von Minden M, Ubelhart R, Schneider D, Wossning T, Bach MP, Buchner M, Hofmann D, Surova E, Follo M, Kohler F, Wardemann H, Zirlik K, Veelken H, et al. Chronic lymphocytic leukaemia is driven by antigen-independent cell-autonomous signalling. Nature. 2012; 489:309–312.
19. Muggen AF, Pillai SY, Kil LP, van Zelm MC, van Dongen JJ, Hendriks RW, Langerak AW. Basal Ca(2+) signaling is particularly increased in mutated chronic lymphocytic leukemia. Leukemia. 2015; 29:321–328.
20. Hoogeboom R, van Kessel KP, Hochstenbach F, Wormhoudt TA, Reinten RJ, Wagner K, Kater AP, Guikema JE, Bende RJ and van Noesel CJ. A mutated B cell chronic lymphocytic leukemia subset that recognizes and responds to fungi. J Exp Med. 2013; 210:59–70.
21. Chen SS, Batliwalla F, Holodick NE, Yan XJ, Yancopoulos S, Croce CM, Rothstein TL, Chiorazzi N. Autoantigen can promote progression to a more aggressive TCL1 leukemia by selecting variants with enhanced B-cell receptor signaling. Proc Natl Acad Sci USA. 2013; 110:E1500–1507.
22. Ramsay AD, Rodriguez-Justo M. Chronic lymphocytic leukaemia--the role of the microenvironment pathogenesis and therapy. Br J Haematol. 2013; 162:15–24.
23. Caligaris-Cappio F, Bertilaccio MT, Scielzo C. How the microenvironment wires the natural history of chronic lymphocytic leukemia. Semin Cancer Biol. 2014; 24:43–48.
24. Burger JA, Gribben JG. The microenvironment in chronic lymphocytic leukemia (CLL) and other B cell malignancies: insight into disease biology and new targeted therapies. Semin Cancer Biol. 2014; 24:71–81.
25. Herishanu Y, Perez-Galan P, Liu D, Biancotto A, Pittaluga S, Vire B, Gibellini F, Njuguna N, Lee E, Stennett L, Raghavachari N, Liu P, McCoy JP, et al. The lymph node microenvironment promotes B-cell receptor signaling, NF-kappaB activation, and tumor proliferation in chronic lymphocytic leukemia. Blood. 2011; 117:563–574.
26. de Gorter DJ, Beuling EA, Kersseboom R, Middendorp S, van Gils JM, Hendriks RW, Pals ST, Spaargaren M. Bruton’s tyrosine kinase and phospholipase Cgamma2 mediate chemokine-controlled B cell migration and homing. Immunity. 2007; 26:93–104.
27. de Rooij MF, Kuil A, Geest CR, Eldering E, Chang BY, Buggy JJ, Pals ST, Spaargaren M. The clinically active BTK inhibitor PCI-32765 targets B-cell receptor- and chemokine-controlled adhesion and migration in chronic lymphocytic leukemia. Blood. 2012; 119:2590–2594.
28. Ponader S, Chen SS, Buggy JJ, Balakrishnan K, Gandhi V, Wierda WG, Keating MJ, O’Brien S, Chiorazzi N, Burger JA. The Bruton tyrosine kinase inhibitor PCI-32765 thwarts chronic lymphocytic leukemia cell survival and tissue homing in vitro and in vivo. Blood. 2012; 119:1182–1189.
29. Stacchini A, Aragno M, Vallario A, Alfarano A, Circosta P, Gottardi D, Faldella A, Rege-Cambrin G, Thunberg U, Nilsson K, Caligaris-Cappio F. MEC1 and MEC2: two new cell lines derived from B-chronic lymphocytic leukaemia in prolymphocytoid transformation. Leuk Res. 1999; 23:127–136.
30. Agathangelidis A, Scarfo L, Barbaglio F, Apollonio B, Bertilaccio MT, Ranghetti P, Ponzoni M, Leone G, De Pascali V, Pecciarini L, Ghia P, Caligaris-Cappio F, Scielzo C. Establishment and Characterization of PCL12, a Novel CD5+ Chronic Lymphocytic Leukaemia Cell Line. PLoS One. 2015; 10:e0130195.
31. Hertlein E, Beckwith KA, Lozanski G, Chen TL, Towns WH, Johnson AJ, Lehman A, Ruppert AS, Bolon B, Andritsos L, Lozanski A, Rassenti L, Zhao W, et al. Characterization of a new chronic lymphocytic leukemia cell line for mechanistic in vitro and in vivo studies relevant to disease. PLoS One. 2013; 8:e76607.
32. Kellner J, Wierda W, Shpall E, Keating M, McNiece I. Isolation of a novel chronic lymphocytic leukemic (CLL) cell line and development of an in vivo mouse model of CLL. Leuk Res. 2016; 40:54–59.
33. Yan XJ, Albesiano E, Zanesi N, Yancopoulos S, Sawyer A, Romano E, Petlickovski A, Efremov DG, Croce CM, Chiorazzi N. B cell receptors in TCL1 transgenic mice resemble those of aggressive, treatment-resistant human chronic lymphocytic leukemia. Proc Natl Acad Sci U S A. 2006; 103:11713–11718.
34. Simonetti G, Bertilaccio MT, Ghia P, Klein U. Mouse models in the study of chronic lymphocytic leukemia pathogenesis and therapy. Blood. 2014; 124:1010–1019.
35. Bichi R, Shinton SA, Martin ES, Koval A, Calin GA, Cesari R, Russo G, Hardy RR, Croce CM. Human chronic lymphocytic leukemia modeled in mouse by targeted TCL1 expression. Proc Natl Acad Sci U S A. 2002; 99:6955–6960.
36. Suljagic M, Longo PG, Bennardo S, Perlas E, Leone G, Laurenti L, Efremov DG. The Syk inhibitor fostamatinib disodium (R788) inhibits tumor growth in the Emu- TCL1 transgenic mouse model of CLL by blocking antigen-dependent B-cell receptor signaling. Blood. 2010; 116:4894–4905.
37. ter Brugge PJ, Ta VB, de Bruijn MJ, Keijzers G, Maas A, van Gent DC, Hendriks RW. A mouse model for chronic lymphocytic leukemia based on expression of the SV40 large T antigen. Blood. 2009; 114:119–127.
38. Kil LP, de Bruijn MJ, van Hulst JA, Langerak AW, Yuvaraj S, Hendriks RW. Bruton’s tyrosine kinase mediated signaling enhances leukemogenesis in a mouse model for chronic lymphocytic leukemia. Am J Blood Res. 2013; 3:71–83.
39. Buechele C, Baessler T, Schmiedel BJ, Schumacher CE, Grosse-Hovest L, Rittig K, Salih HR. 4–1BB ligand modulates direct and Rituximab-induced NK-cell reactivity in chronic lymphocytic leukemia. Eur J Immunol. 2012; 42:737–748.
40. Chen LS, Redkar S, Bearss D, Wierda WG, Gandhi V. Pim kinase inhibitor, SGI-1776, induces apoptosis in chronic lymphocytic leukemia cells. Blood. 2009; 114:4150–4157.
41. Cohen AM, Grinblat B, Bessler H, Kristt D, Kremer A, Schwartz A, Halperin M, Shalom S, Merkel D, Don J. Increased expression of the hPim-2 gene in human chronic lymphocytic leukemia and non-Hodgkin lymphoma. Leuk Lymphoma. 2004; 45:951–955.
42. Ranheim EA, Cantwell MJ, Kipps TJ. Expression of CD27 and its ligand, CD70, on chronic lymphocytic leukemia B cells. Blood. 1995; 85:3556–3565.
43. Stratowa C, Loffler G, Lichter P, Stilgenbauer S, Haberl P, Schweifer N, Dohner H, Wilgenbus KK. CDNA microarray gene expression analysis of B-cell chronic lymphocytic leukemia proposes potential new prognostic markers involved in lymphocyte trafficking. Int J Cancer. 2001; 91:474–480.
44. Joha S, Nugues AL, Hetuin D, Berthon C, Dezitter X, Dauphin V, Mahon FX, Roche-Lestienne C, Preudhomme C, Quesnel B, Idziorek T. GILZ inhibits the mTORC2/AKT pathway in BCR-ABL(+) cells. Oncogene. 2012; 31:1419–1430.
45. Subramanian A, Tamayo P, Mootha VK, Mukherjee S, Ebert BL, Gillette MA, Paulovich A, Pomeroy SL, Golub TR, Lander ES, Mesirov JP. Gene set enrichment analysis: a knowledge-based approach for interpreting genome-wide expression profiles. Proc Natl Acad Sci USA. 2005; 102:15545–15550.
46. Gary-Gouy H, Sainz-Perez A, Marteau JB, Marfaing-Koka A, Delic J, Merle-Beral H, Galanaud P, Dalloul A. Natural phosphorylation of CD5 in chronic lymphocytic leukemia B cells and analysis of CD5-regulated genes in a B cell line suggest a role for CD5 in malignant phenotype. J Immunol. 2007; 179:4335–4344.
47. Arnold LW, McCray SK, Tatu C, Clarke SH. Identification of a precursor to phosphatidyl choline-specific B-1 cells suggesting that B-1 cells differentiate from splenic conventional B cells in vivo: cyclosporin A blocks differentiation to B-1. J Immunol. 2000; 164:2924–2930.
48. Mackus WJ, Kater AP, Grummels A, Evers LM, Hooijbrink B, Kramer MH, Castro JE, Kipps TJ, van Lier RA, van Oers MH, Eldering E. Chronic lymphocytic leukemia cells display p53-dependent drug-induced Puma upregulation. Leukemia. 2005; 19:427–434.
49. Chou TC, Talalay P. Quantitative analysis of dose-effect relationships: the combined effects of multiple drugs or enzyme inhibitors. Adv Enzyme Regul. 1984; 22:27–55.
50. Palacios F, Abreu C, Prieto D, Morande P, Ruiz S, Fernandez-Calero T, Naya H, Libisch G, Robello C, Landoni AI, Gabus R, Dighiero G, Oppezzo P. Activation of the PI3K/AKT pathway by microRNA-22 results in CLL B-cell proliferation. Leukemia. 2015; 29:115–125.
51. Mombaerts P, Iacomini J, Johnson RS, Herrup K, Tonegawa S, Papaioannou VE. RAG-1-deficient mice have no mature B, T lymphocytes. Cell. 1992; 68:869–877.
52. Voltan R, Rimondi E, Melloni E, Rigolin GM, Casciano F, Arcidiacono MV, Celeghini C, Cuneo A, Zauli G, Secchiero P. Ibrutinib synergizes with MDM-2 inhibitors in promoting cytotoxicity in B chronic lymphocytic leukemia. Oncotarget. 2016; 7:70623–70638. doi: 10.18632/oncotarget.12139.
53. Cacciotti P, Barbone D, Porta C, Altomare DA, Testa JR, Mutti L, Gaudino G. SV40-dependent AKT activity drives mesothelial cell transformation after asbestos exposure. Cancer Res. 2005; 65:5256–5262.
54. Chang BY, Francesco M, De Rooij MF, Magadala P, Steggerda SM, Huang MM, Kuil A, Herman SE, Chang S, Pals ST, Wilson W, Wiestner A, Spaargaren M, et al. Egress of CD19(+)CD5(+) cells into peripheral blood following treatment with the Bruton tyrosine kinase inhibitor ibrutinib in mantle cell lymphoma patients. Blood. 2013; 122:2412–2424.
55. White MK, Khalili K. Polyomaviruses and human cancer: molecular mechanisms underlying patterns of tumorigenesis. Virology. 2004; 324:1–16.
56. Ahuja D, Saenz-Robles MT, Pipas JM. SV40 large T antigen targets multiple cellular pathways to elicit cellular transformation. Oncogene. 2005; 24:7729–7745.
57. Muramatsu M, Kinoshita K, Fagarasan S, Yamada S, Shinkai Y, Honjo T. Class switch recombination and hypermutation require activation-induced cytidine deaminase (AID), a potential RNA editing enzyme. Cell. 2000; 102:553–563.
58. Middendorp S, Dingjan GM, Hendriks RW. Impaired precursor B cell differentiation in Bruton’s tyrosine kinase-deficient mice. J Immunol. 2002; 168:2695–2703.
59. Thijssen R, Ter Burg J, Garrick B, van Bochove GG, Brown JR, Fernandes SM, Rodriguez MS, Michot JM, Hallek M, Eichhorst B, Reinhardt HC, Bendell J, Derks IA, et al. Dual TORK/DNA-PK inhibition blocks critical signaling pathways in chronic lymphocytic leukemia. Blood. 2016; 128:574–583.
60. Kil LP, de Bruijn MJ, van Nimwegen M, Corneth OB, van Hamburg JP, Dingjan GM, Thaiss F, Rimmelzwaan GF, Elewaut D, Delsing D, van Loo PF, Hendriks RW. Btk levels set the threshold for B-cell activation and negative selection of autoreactive B cells in mice. Blood. 2012; 119:3744–3756.
61. Robinson MD, McCarthy DJ, Smyth GK. edgeR: a Bioconductor package for differential expression analysis of digital gene expression data. Bioinformatics. 2010; 26:139–140.
62. Anders S, Pyl PT, Huber W. HTSeq--a Python framework to work with high-throughput sequencing data. Bioinformatics. 2015; 31:166–169.