
INTRODUCTION
Multiple myeloma (MM) is an incurable clonal plasma cell disorder. Previous molecular studies have demonstrated that the disease is associated with several chromosomal translocations [1]. The t(4;14) translocation is the second most common type of these translocations, affecting approximately 15% of MM patients with symptomatic disease [2]. Clinical studies showed that MM patients carrying the t(4;14) translocation were resistant to traditional chemotherapy, resulting in short median overall survival [3–7]. An Intergroupe Francophone du Myélome (IFM) 99 study reported that t(4;14) translocation was an independent prognostic factor for survival along with 17p deletion and high β2-microglobulin (β2-MG) [7]. Although recent therapeutic regimens such as bortezomib-based induction improve the outcome of patients with t(4;14), the prognosis is still poor [8, 9]. Studies also suggested that MM patients with t(4;14) may be a heterogeneous group with both “high risk” and “good risk” patients [10].
The t(4;14) translocations in MM divide the strong 3’alpha and mu enhancers of the IgH locus into different derivative chromosomes. These translocations result in the 3’ alpha enhancers expressing fibroblast growth factor receptor 3 (FGFR3), and the mu enhancer increases the expression of multiple myeloma SET domain(MMSET) [11]. Thus, two potential oncogenes, FGFR3 and MMSET, are dysregulated in patients with t(4;14) translocations. FGFR3 expression, which is lost in a subset of t(4;14)pos MM, has been shown not to have a significant impact on patients’ survival [11–14]. The over-expressed MMSET gene of all t(4;14)pos MM patients encodes a histone methyltransferase that is involved in tumor progression and genomic instability [13, 15, 16]. MB4-1, MB4-2, and MB4-3 are three major breakpoints within the 5’coding region of MMSET at 4p16 on chromosome der(4) [11, 16]. Each breakpoint overexpresses a specific IGH/MMSET fusion transcript. The hybrid transcripts from MB4-1 patients encode the full-length MMSET protein, while hybrid transcripts from MB4-2 patients lack the first translated exon of MMSET. MB4-3 patients lack the first and second translated exons of MMSET. The aim of this study was to clarify whether the overexpression of full-length (MB4-1) or truncated forms (MB4-2 and MB4-3) of MMSET influences the prognosis of MM patients with t(4;14).
RESULTS
MB4 breakpoints distribution and FGFR3 expression in t(4;14)pos MM
Fifty-three MM patients with t(4;14) were sub-grouped into 3 different major breakpoint regions (MB4-1, MB4-2 and MB4-3) based on the size of the RT-PCR products (Figure 1B). Of the 53 t(4;14)pos patients, 25 (47.2%), 12(22.6%) and 16(30.2%) had the MB4-1, MB4-2 and MB4-3 breakpoint, respectively. Due to the imbalance in the numbers of the three subgroups, we grouped them into two groups, MB4-1 subgroup (n=25) and the pooled MB4-2/MB4-3 subgroup(n=28), according to their ability to encode a full-length or a truncated MMSET protein. FGFR3 expression was detectable in 43(81.1%) of the 53 MM with t(4;14). For the subgroups, FGFR3 expression was detected in 22(88%) of the MB4-1 subgroup and 21(75%) of the MB4-2/MB4-3 pooled subgroup, with no statistical difference between them (P=0.302).
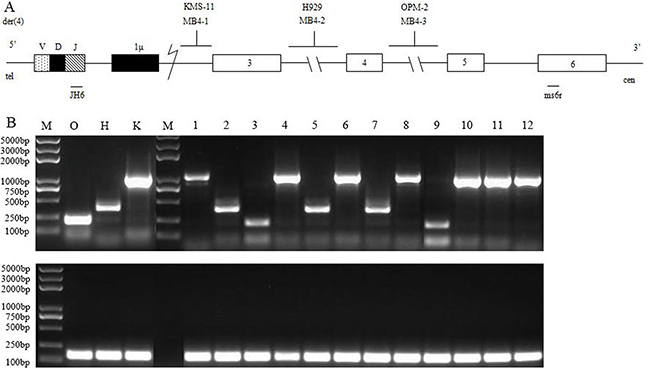
Figure 1: RT-PCR assay of detecting IGH/MMSET hybrid transcripts associated with the t(4;14)(p16.3;q32) translocation in MM. (A) Schematic representation of the t(4;14) junction, der(4), showing the three different types of 4p16.3 breakpoints (see the text): the MMSET exons ( ) and the IGH region (Iμ,
  ; JH,
; JH,  ) were indicated. (B) RT-PCR analysis of the IGH/MMSET hybrid transcripts in the KMS-11 (K), NCI-H929 (H) and OPM-2 (O) cell lines and the patient samples using the JH6 and ms6r primers.
Patient characteristics
The median age of the 53 patients was 60 years old (range 42–85) with the median follow-up time of 18.83 months from the diagnosis. Clinical factors, genetic abnormalities and treatments associated with MB4 breakpoints are shown in Table 1. There was no significant difference in clinical and cytogenetic characteristics and in responses after induction therapy between the two groups.
Table 1: Characteristics of patients with symptomatic MM (N=53), grouped by MB4 breakpoints
Breakpoint |
MB4-1 |
MB4-2/MB4-3 |
P |
|---|---|---|---|
n (%) |
25 (47.2) |
28 (52.8) |
|
Gender (male, %) |
17 (68) |
17 (60.7) |
0.775 |
Median age, years (range) |
59 (42-85) |
60 (49-74) |
>0.05 |
M isotype,n (%) |
|
|
0.305 |
IgA |
11 (44) |
7 (25) |
|
IgG |
11 (44) |
18 (64.3) |
|
IgD |
0 (0) |
1 (3.57) |
|
Light chains, n (%) |
3 (12) |
2 (7.14) |
|
BM plasmacytosis≥50%, n (%) |
7 |
4 |
0.219 |
Albumin (g/L) ≤ 35, n (%) |
13 (52) |
17 (60.7) |
0.586 |
Calcemia ≥2.8 mmol/L, n (%) |
2 (8) |
3 (10.7) |
1 |
Creatinine≥176 μmol/L, n (%) |
5 (20) |
8 (28.6) |
0.536 |
Elevated lactate dehydrogenase, n (%) |
4 (16) |
10 (35.7) |
0.129 |
Involved/uninvolved serum free light ratio≥100, n (%) |
6 (24) |
9 (32.1) |
0.556 |
Anemia (g/L), n (%) |
|
|
0.969 |
>100 |
7 (28) |
8 (28.6) |
|
80~100 |
7 (28) |
7 (25) |
|
<80 |
11 (44) |
13 (46.4) |
|
Number of osteolytic destruction (≥3), n (%) |
19 (76) |
18 (64.3) |
0.387 |
Extramedullary invasion, n (%) |
4 (16) |
8 (28.6) |
0.337 |
DS, n (%) |
|
|
1 |
I+II |
2 (8) |
2 (7.1) |
|
III |
23 (92) |
26 (92.9) |
|
R-ISS, n (%) |
|
|
0.237 |
I+II |
20 (80) |
18 (64.3) |
|
III |
5 (20) |
10 (35.7) |
|
FGFR3 expression, n (%) |
22 (88) |
21 (75) |
0.302 |
Cytogenetic abnormality |
|
|
|
Del(13q) |
17 (68) |
23 (82.1) |
0.339 |
Del(17p) |
5 (20) |
6 (21.4) |
1 |
Amp(1q21) |
13 (52) |
19 (67.9) |
0.272 |
High-risk [(any del(17p) or amp(1q21)] |
14 (56) |
21 (75) |
0.162 |
Induction treatment, n=53 |
|
|
|
Bortezomib-based regimen, n (%) |
19 (76) |
16 (57.1) |
0.148 |
Immunomodulatory drug-based regimen, n (%) |
3 (12) |
8 (28.6) |
0.138 |
Traditional chemotherapy, n (%) |
3 (12) |
4 (14.3) |
1 |
High dose therapy + ASCT, n (%) |
4 (16) |
5 (17.9) |
1 |
Response after 4 cycles induction therapy, n=53 |
|
|
0.54 |
Partial response, n (%) |
4 (16) |
5 (17.9) |
1 |
Very good partial response, n (%) |
10 (40) |
12 (42.9) |
1 |
Complete response, n (%) |
8 (32) |
4 (14.3) |
0.19 |
Stable disease, n (%) |
2 (8) |
3 (10.7) |
1 |
Progressive disease, n (%) |
1 (4) |
4 (14.3) |
0.355 |
Overall response, n (%) |
22 (88) |
21 (75) |
0.302 |
CR after two cycles of induction therapy, n (%) |
5 (20) |
1 (3.6) |
0.089 |
VGPR after two cycles of induction therapy, n (%) |
11 (44) |
11 (39.3) |
0.785 |
R-ISS: Revised International Staging System; Ig: immunoglobulin; BM: bone marrow.
Prognostic value of MB4 breakpoints in newly diagnosed MM patients with t(4;14)
The follow-up data of the 53 patients were analyzed to ascertain the prognostic value of MB4 breakpoints in newly diagnosed MM patients with t(4;14). We found that patients with MB4-1 breakpoint had similar progression free survival (PFS) to the patients in the pooled MB4-2/MB4-3 subgroup (20.5 vs. 17.1 months, P=0.051). However, the patients with MB4-1 breakpoint had significantly longer overall survival (OS) than the patients of the pooled MB4-2/MB4-3 subgroup (NS vs. 39.7 months, P=0.001) (Figure 2A and 2B). Accordingly, survival after the first relapse or progression was reduced in the pooled MB4-2/MB4-3 subgroup (median survival: NS vs 7.9 months, P=0.004) (Figure 2C). We further analyzed the remission rate after the first relapse or progression, and found that 9 out 13 (69.2%) patients in the MB4-1 subgroup and 6 out 20 (30%) patients in the MB4-2/MB4-3 subgroup achieved remission after the first relapse or progression. The remission rate difference was significant (P=0.038) with the MB4-1 subgroup superior to the MB4-2/MB4-3 subgroup. In addition, we also investigated the impact of FGFR3 expression on PFS and OS of the 53 patients. No prognosis significance of the FGFR3 expression was observed in the 53 patients with t(4;14) as a whole (data not shown). Furthermore, the expression of FGFR3 had no prognosis significance in both MB4-1 and MB4-2/MB4-3 subgroups. We further analyzed other risk factors that might affect the prognosis of this cohort of patients (Table 2). The univariate analysis indicated that patients with ISS stage III, lactate dehydrogenase (LDH) higher than 245U/L, creatinine (Cr) higher than 176umol/L, ß2-MG higher than 5.5mg/L, del(17p), amp(1q21) and high-risk genetic abnormality had inferior OS to the corresponding control group. Furthermore, patients with serum calcium higher than 2.8mmol/L, del(17p) and high-risk cytogenetic abnormality had inferior PFS to the corresponding control group. Multivariate analysis of the above mentioned prognostic variables showed that t(4;14) grouped into MB4-1 and MB4-2/MB4-3 subgroups according to the breakpoints remained a powerful independent adverse factor for PFS (HR 2.74, 95% CI: 1.24–6.09, P=0.013) and OS (HR 4.37, 95% CI: 1.17–16.33, P=0.029). Other independent factors for OS were del(17p) (HR 3.65, 95% CI: 1.2–11.14, P=0.023), ISS stage III (HR 3.76, 95% CI: 1.19–11.9, P=0.024) and LDH (HR 2.86, 95% CI: 1–8.19, P=0.05). For PFS, serum calcium was another independent factor (HR 11.54, 95% CI: 3.7–36, P< 0.001) (Table 3).
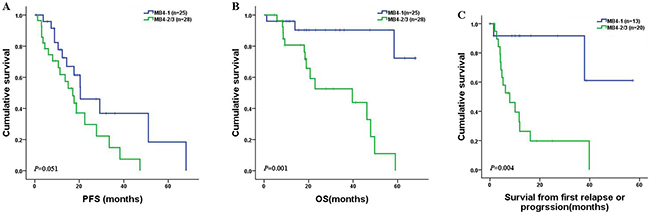
Figure 2: PFS, OS and survival in newly diagnosed MM patients with t(4;14) according to the MB4 breakpoints. The patients with MB4-1 breakpoint had longer OS (P=0.001) (B) and survival (C) from the first relapse or progression (P=0.004) than those in the MB4-2/MB4-3 subgroup. However, the PFS (P=0.051) was similar between the two subgroups (A).
Table 2: Univariate analysis of risk factors for PFS and OS in the 53 newly diagnosed MM patients with t(4;14)
Prognostic parameters |
Median PFS (months) |
P value |
Median OS (months) |
P value |
|---|---|---|---|---|
ISS stage |
|
0.344 |
|
0.001 |
I-II (n=38) |
20.4 |
|
58.4 |
|
III (n=15) |
15.03 |
|
20.7 |
|
LDH(U/L) |
|
0.764 |
|
0.033 |
≥245 (n=15) |
17.1 |
|
18.97 |
|
<245 (n=38) |
20.4 |
|
47.9 |
|
ß2-MG(mg/L) |
|
0.756 |
|
0.039 |
≥5.5 (n=16) |
27.7 |
|
39.7 |
|
<5.5 (n=37) |
18.7 |
|
58.4 |
|
Cr(μmol/L) |
|
0.477 |
|
0.03 |
≥176 (n=13) |
27.7 |
|
39.7 |
|
<176 (n=40) |
18.7 |
|
58.4 |
|
Plasma counts in BM(%) |
|
0.699 |
|
0.256 |
≥50 (n=11) |
12.4 |
|
49.7 |
|
<50 (n=42) |
18.7 |
|
47.9 |
|
Number of osteolytic destruction |
|
0.609 |
|
0.563 |
≥3 (n=37) |
18.7 |
|
47.87 |
|
<3 (n=16) |
38.27 |
|
59 |
|
Extramedullary invasion |
|
0.124 |
|
0.336 |
Positive (n=12) |
11.33 |
|
20.7 |
|
Negative (n=41) |
20.4 |
|
58.4 |
|
Serum calcium(mmol/L) |
|
< 0.001 |
|
0.148 |
≥2.8 (n=5) |
3.07 |
|
NS |
|
<2.8 (n=48) |
20.5 |
|
49.67 |
|
sFLC ratio (involved/uninvolved) |
|
0.756 |
|
0.374 |
≥100 (n=15) |
33.5 |
|
47.9 |
|
<100 (n=38) |
18.7 |
|
58.4 |
|
T(4;14)/MB4 breakpoint |
|
0.051 |
|
0.001 |
MB4-1 (n=25) |
20.5 |
|
NS |
|
MB4-2/MB4-3 (n=28) |
17.1 |
|
39.7 |
|
Del(13q) |
|
0.728 |
|
0.77 |
Positive (n=40) |
20.4 |
|
47.9 |
|
Negative (n=13) |
15.03 |
|
NS |
|
Del(17p) |
|
0.001 |
|
0.013 |
Positive (n=11) |
10.6 |
|
20.7 |
|
Negative (n=42) |
22.5 |
|
58.4 |
|
Amp(1q21) |
|
0.144 |
|
0.028 |
Positive (n=32) |
18.7 |
|
46.2 |
|
Negative (n=21) |
68 |
|
NS |
|
High-risk [(any del(17p) or Amp(1q21)] |
|
0.028 |
|
0.003 |
Positive (n=35) |
17.1 |
|
46 |
|
Negative (n=18) |
68 |
|
NS |
|
Table 3: Multivariate analysis of risk factors for PFS and OS in the 53 newly diagnosed MM patients with t(4;14)
Prognostic parameter |
HR for PFS (95% CI) |
P value |
HR for OS (95% CI) |
P value |
|---|---|---|---|---|
MB4-2/MB4-3 (n=28) |
2.74(1.24-6.09) |
0.013 |
4.37(1.17-16.33) |
0.029 |
ISS stage III (n=15) |
- |
0.717 |
3.76(1.19-11.9) |
0.024 |
Del(17p) (n=11) |
- |
0.128 |
3.65(1.2-11.14) |
0.023 |
LDH (n=15) |
- |
0.795 |
2.86(1-8.19) |
0.05 |
Serum calcium (n=5) |
11.54(3.7-36) |
< 0.001 |
- |
0.955 |
Impact of MMSET breakpoints on the outcome of t(4;14)pos patients and other cytogenetic high-risk factors
Deletion of chromosome 17 at p13 [del(17p)] and amplification of chromosome 1 at q21[amp(1q21)], which are associated with high-risk MM, were analyzed by fluorescence in situ hybridization(FISH) at diagnosis of the 53 cases. Overall, del(17p) was detected in 11 cases (20.8%). Amp(1q21) was found in 32 cases(60.4%). First, we analyzed PFS and OS of the 53 patients according to the MB4 breakpoints and del(17p). Interestingly, MB4-1 without del(17p) subgroup had longer PFS than the other three subgroups (P=0.002, 0.036, 0.002, respectively) (Figure 3A). MB4-1 without del(17p) subgroup had longer OS than MB4-2/MB4-3 with/without del(17p) (P<0.001 and P=0.002, respectively). However, MB4-1 without del(17p) subgroup had similar OS to MB4-1 with del(17p) subgroup (P=0.259) (Figure 3B). We also analyzed the PFS and OS of the 53 patients according to the MB4 breakpoints and amp(1q21). As shown in Figure 3C, MB4-2/MB4-3 with amp(1q21) subgroup had shorter PFS than MB4-1 without amp(1q21) (P=0.047), but similar to the other two subgroups (P=0.281 and 0.84, respectively). MB4-2/MB4-3 with amp(1q21) subgroup had shorter OS than MB4-1 with or without amp(1q21) (P=0.024 and 0.002, respectively), but similar to MB4-2/MB4-3 without amp(1q21) subgroup (P=0.61) (Figure 3D). MB4-1 without del(17p) subgroup may be a subset of t(4;14)pos MM with superior prognosis. However, one should note that these comparisons have small sample sizes.
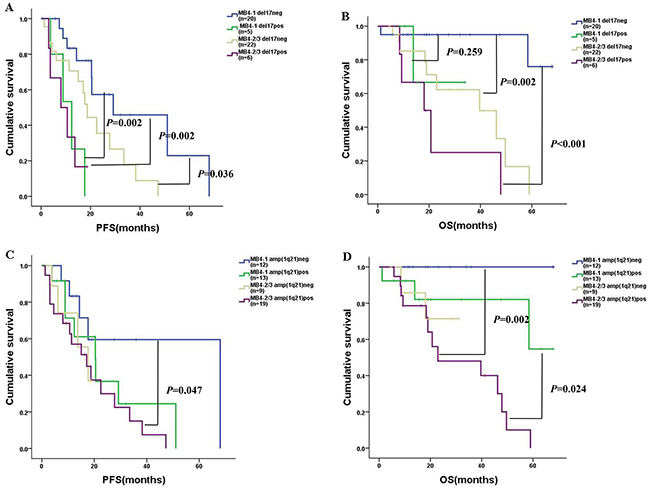
Figure 3: PFS and OS of the 53 patients according to the MB4 breakpoints and del(17p) /amp(1q21). (A)-(B): MB4-1 without del(17p) (n=20): blue curve; MB4-1 with del(17p) (n=5): green curve; MB4-2/MB4-3 without del(17p) (n=22): brown curve; MB4-2/MB4-3 with del(17p) (n=6): purple curve. The MB4-1 without del(17p) subgroup had longer PFS than the other three subgroups (P=0.002, 0.036 and 0.002, respectively). MB4-1 without del(17p) subgroup had longer OS than MB4-2/MB4-3 with/without del(17p) (P<0.001 and P=0.002), however, the MB4-1 without del(17p) subgroup had similar OS compared to the MB4-1 with del(17p) subgroup (P=0.259). (C)-(D): MB4-1 without amp(1q21) (n=12): blue curve; MB4-1 with amp(1q21) (n=13): green curve; MB4-2/MB4-3 without amp(1q21) (n=9): brown curve; MB4-2/MB4-3 with amp(1q21) (n=19): purple curve. The MB4-2/MB4-3 with amp(1q21) subgroup had shorter PFS than MB4-1 without amp(1q21) (P=0.047), but similar PFS compared to the other two subgroups (P=0.281 and 0.84). The MB4-2/MB4-3 with amp(1q21) subgroup had shorter OS than MB4-1 with or without amp(1q21) (P=0.024 and 0.002), but similar OS compared to the MB4-2/MB4-3 without amp(1q21) subgroup (P=0.61).
Bortezomib significantly improved the survival of MB4-1 patients
In this study, the majority of the patients received a bortezomib-based induction regimen (Table 1). The overall response rate (ORR) of the patients in the MB4-1 subgroup was superior to that in the MB4-2/MB4-3 subgroup after being treated with the bortezomib-based induction therapy (P=0.035) (Table 4). In the bortezomib-based chemotherapy group, the median PFS and OS of patients with MB4-2/MB4-3 breakpoints were 13.67 vs. 29.2months (P=0.004) and 22.9 vs. NS (P=0.00), respectively, when compared to the patients with MB4-1 breakpoint (Figure 4A and 4B). In addition, in the patients with MB4-1 breakpoint, the median PFS and OS of the patients treated with bortezomib-based chemotherapy were 29.2 vs. 12.37months (P=0.03) and not reached vs. 41.73 months (P=0.048), respectively, when compared to the patients treated with other chemotherapies (Figure 4C and 4D). However, for patients with the MB4-2/MB4-3 breakpoints, no statistically significant difference between bortezomib-based and other chemotherapy groups was observed (PFS: P=0.074; OS: P=0.266) (Figure 4E and 4F). This suggested that bortezomib significantly improved the survival of the patients with MB4-1 but could not overcome the negative effect of the MB4-2/MB4-3 breakpoints.
Table 4: Response rate of patients with different MB4 breakpoints treated with bortezomib-based induction therapy
Breakpoint |
ORR |
PR |
VGPR |
CR |
SD |
PD |
≥VGPR |
SD+PD |
|---|---|---|---|---|---|---|---|---|
MB4-1 (n=19) |
100% (19/19) |
15.8% (3/19) |
47.4% (9/19) |
36.8% (7/19) |
0 (0/19) |
0 (0/19) |
84.2% (16/19) |
0 (0/19) |
MB4-2/MB4-3 (n=16) |
75% (12/16) |
18.8% (3/16) |
37.5% (6/16) |
18.8% (3/16) |
6.3% (1/16) |
18.8% (3/16) |
56.3% (9/16) |
25% (4/16) |
P value |
0.035 |
1 |
0.734 |
0.285 |
0.457 |
0.086 |
0.132 |
0.035 |
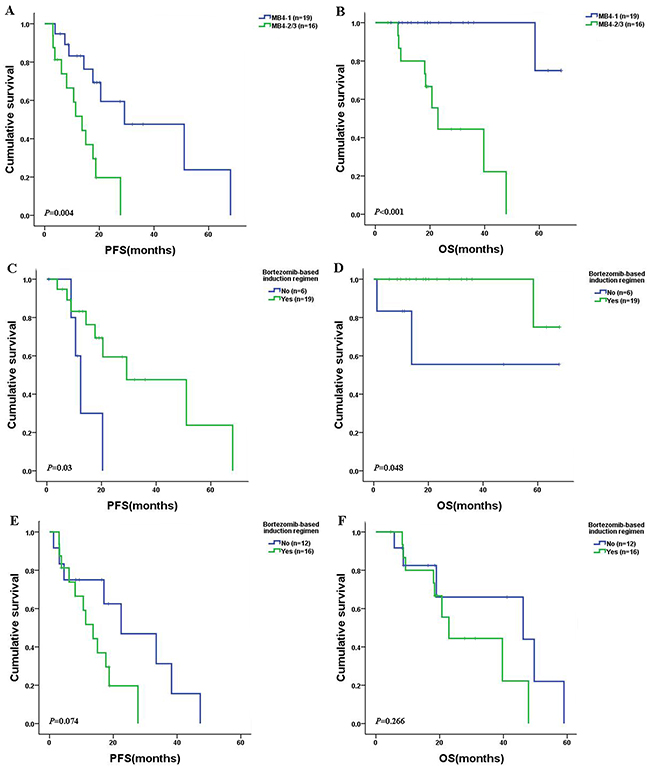
Figure 4: PFS and OS in newly diagnosed MM patients with t(4;14) after receiving bortezomib-based or other chemotherapies. (A)-(B): The MB4-1 patients had longer PFS (P=0.004) and OS (P< 0.001) than that of MB4-2/MB4-3 subgroup. (C)-(D): The MB4-1 patients treated with bortezomib-based chemotherapy had longer PFS (P=0.03) and OS (P=0.048) than those treated with other chemotherapies. (E)-(F): The MB4-2/MB4-3 patients had similar PFS and OS between bortezomib-based and other chemotherapies groups (PFS: P=0.074; OS: P=0.266).
DISCUSSION
T(4;14) translocation affects approximately 15% of MM patients with symptomatic disease. The 53 patients in this retrospective study were identified from nearly 400 symptomatic MM patients diagnosed between June 2011 and August 2016 in two hospitals in China. Our study revealed that FGFR3 expression was detectable in 81.1% of the 53 MM patients with t(4;14). No prognostic significance of FGFR3 expression was observed in the present study. This finding is consistent with previous reports [16, 17]. We found that of the 53 t(4;14)pos MM patients, 47.2% had the breakpoint of MB4-1, while 22.6% and 30.2% of them had the MB4-2 and MB4-3 breakpoints, respectively. These results were different from those of a previous study by Lazareth et al. (2015), who found that MB4-1, MB4-2 and MB4-3 transcripts were expressed in 62%, 21% and 17% of their 256 symptomatic MM patients in France [17]. There was no doubt that the MB4-1 breakpoint cluster was the most common type of t(4;14)pos MM patients. The distribution difference of the three MB4 breakpoints among patients in different studies might be due to the smaller sample size of the current study and/or different genetic background (e.g. race) of the studied patients.
In the current study, we found that the patients of MB4-1 and MB4-2/MB4-3 subgroups had a similar PFS but the post relapse survival of the later subgroup was shorter leading to a shorter OS. This result agrees with Lazareth et al. [17] where they found the similar result that MB4-2 was an independent prognostic factor for OS. The remission rate after the first relapse or progression of the MB4-1 subgroup was better than that of the MB4-2/MB4-3 subgroup in the current study. We supposed that symptomatic t(4;14)pos MM patients with the MB4-2/MB4-3 breakpoints might be as sensitive as those with the MB4-1 breakpoint to the first-line therapy, but developed chemo-resistant relapse quickly resulting in poorer outcome. Lazareth et al. (2015) found that patients with del(17p) and the MB4-2 breakpoint formed a distinctive subset of high risk patients with the very poor prognosis [17]. However, Keats et al. (2005) found similar OS between MB4-1 (n=30) and MB4-2/MB4-3 (n=13) subgroups with a small number of patients [16]. Our current study also had a limited number of cases (53). We failed to further distinguish the prognosis between MB4-2 and MB4-3 subgroups.
For the first time, we verified that bortezomib-based therapy significantly improved the survival of patients with MB4-1, but could not overcome the negative effect of the MB4-2/MB4-3 breakpoints, with unclear mechanism. The study by Chng WJ et al. [18] indicated an interaction between MMSET and the nuclear factor-κB and they both bound to the interferon regulatory factor 4 (IRF4) promoter region which is critical for MM cell survival. Furthermore, they found that bortezomib could reduce the expression of MMSET and IRF4. This might be one reason that bortezomib-based therapy significantly improved the survival of patients with full-length MMSET (MB4-1 subgroup) rather than that of truncated forms (MB4-2 and MB4-3 subgroup). Further studies are needed to clarify the difference between MB4-1 and MB4-2/MB4-3’s responses to bortezomib and survival. Currently, all the results suggested that the MB4-2/MB4-3 subgroup was at “high risk”, while MB4-1 subgroup was at “good risk” in MM patients with t(4;14). In our study, all the patients with del(17p) using 20% as cut-off level had more than 50% of 17p deletion cells among clonal plasma cells [19]. We did not find MB4-2/MB4-3 patients with del(17p) or amp(1q21) having higher risk with very poor prognosis, probably due to the limited number of cases.
The molecular basis for the particularly poor prognosis associated with the MB4-2 and MB4-3 breakpoints is not clear. Knockdown studies have demonstrated that MMSET upregulation contributes to cellular adhesion, clonogenic growth and tumorigenicity [13–16, 20, 21]. However, MMSET overexpression is not the only factor as t(4;14)pos patients have genomic breakpoints that separate the first, or first and second, translated exons from the remaining translated exons. Keats et al. (2005) [16] showed that the full-length MMSET proteins (MB4-1) concentrated at the nucleus, whereas the MB4-2 and MB4-3 proteins concentrated in nucleoli. The domain for controlling MMSET localization exists in the N-terminus encoded by exons 3 and 4, which are lost in the MB4-2 and MB4-3 variants. Cloning and localization studies of the Exon 4a/MMSET III splice variant (absent from the MB4-2 variant) identified a novel protein domain that prevented nucleolar localization. Protein location difference may cause functional divergence. MB4-1 expressed MMSET proteins have a complete structure with the N-terminal region that limits the protein entering of cell nucleus. The MB4-2 and MB4-3 breakpoints truncate the N-terminal region, and thus lack the control of MMSET proteins entering the nucleus. Therefore, it is reasonable to assume that the poor prognosis of MM patients with MB4-2 and MB4-3 breakpoints is due to the accumulation of fusion proteins in the cell nucleus with stronger cancer causing force. More recently, Debra L. Evans [22] reported that during cell-cycle progression, MMSET interacted with proliferating cell nuclear antigen (PCNA, a sliding clamp for DNA synthesis) through its N terminus and was degraded during synthesis (S) phase in a PCNA-dependent manner. N terminus of MMSET was absent in MB4-2 and MB4-3 breakpoints. This would be one reason for the poor prognosis of MM patients with MB4-2 and MB4-3 breakpoints.
MMSET has also been implicated in the H4K20 histone methyltransferase activity associated with the cellular response to DNA damage [15]. This function takes effect through the phosphorylation of serine 102 (Ser102) by the ATM protein, which promotes the binding of MMSET at DNA double-strand breaks and recruits p53-binding protein 1 (53BP1) [15]. 53BP1 is known to be an important mediator of the DNA damage response [15]. Therefore, the absence of Ser102 in truncated MMSET isoforms might result in genomic instability and the emergence of resistant clones [17]. These could likely account for the different clinical outcomes observed for MB4-1 and MB4-2/MB4-3 breakpoints. Future studies will be needed to explain the apparent discrepancy in prognosis of the MB4-1 and MB4-2/MB4-3 breakpoints.
In conclusion, our results indicated that patients with the MB4-2/MB4-3 breakpoints had more adverse prognosis and higher resistance to bortezomib-based therapy compared to those with the MB4-1 breakpoint. Thus, the breakpoints on the MMSET locus may partially explain the prognostic heterogeneity of t(4;14)pos MM with unclear mechanism. Based on the results, a systemic identification of the MB4 breakpoints may be useful in the management of MM patients with t(4;14) for more accurate therapy and improved outcome.
MATERIALS AND METHODS
Patients and samples
The study involved 53 newly diagnosed symptomatic MM patients at Changzheng Hospital of Shanghai or Jinling Hospital of Nanjing, China, between June 2011 and August 2016. All patients were detected as t(4;14) positive by FISH at diagnosis. Bone marrow (BM) aspirates were obtained from these patients after informed consent. Mononuclear cells were separated from patients’ BM by gradient density centrifugation (Ficoll-Hypaque; Eurobio, Les Ulis, France). Plasma cells were then purified using CD138-coated magnetic beads according to the manufacturer’s instructions (Miltenyi Biotec, Germany) to ensure greater than 90% plasma cell purity. At least 1×10⁶ plasma cells were frozen in Trizol at -80°C for the extraction of mRNA. The remaining CD138+ plasma cells were detected by FISH. This study was approved by the Ethics Committee of Changzheng Hospital.
The last follow-up date was December 31, 2016. The median follow-up time was 18.83 months from the diagnosis. Median cycles of induction and consolidation chemotherapy were 6 and 8 for MB4-1 subgroup and MB4-2/MB4-3 subgroup, respectively. Nineteen MB4-1 patients received at least 4 cycles of bortezomib-based induction therapy with nine cases of CBD (bortezomib, cyclophosphamide and dexamethasone), one case of VD (bortezomib and dexamethasone), eight cases of PAD (bortezomib, adriamycin and dexamethasone), and one case of VTD (bortezomib, thalidomide and dexamethasone). Three MB4-1 patients received at least 4 cycles of the induction therapy of immunomodulatory drug-based regimen with one case of RCD (lenalidomide, cyclophosphamide and dexamethasone), and two cases of CTD (cyclophosphamide, thalidomide and dexamethasone). The remaining three MB4-1 patients received at least 4 cycles of the traditional VAD chemotherapy (vindesine, doxorubicin or pegylated doxorubicin and dexamethasone). Sixteen MB4-2/MB4-3 patients received at least 4 cycles of bortezomib-based induction therapy with six cases of CBD, one case of VD, eight cases of PAD and one case of VTD. Eight MB4-2/MB4-3 patients received at least 4 cycles of immunomodulatory drug-based induction therapies with three cases of TAD (thalidomide, doxorubicin and dexamethasone), two cases of BiCTD (clarithromycin plus CTD), one case of CTD, one case of RD (lenalidomide and dexamethasone) and one case of RAD (lenalidomide, doxorubicin and dexamethasone). The remaining four MB4-2/MB4-3 patients received at least 4 cycles of VAD.
The treatment responses were evaluated according to the IMWG criteria [23] for complete response (CR), very good partial response (VGPR), partial response (PR) and stable disease (SD). Treatment effect was evaluated by ORR, which is the combination of CR, PR and VGPR. OS and PFS were also defined according to the IMWG criteria. OS is defined as the time from diagnosis to death. PFS is defined as the duration from treatment commencement to disease progression or death (regardless of the cause of death), whichever comes first.
Cell lines
Three cell lines, MM-derived KMS-11, NCI-H929 and OPM-2, represent the following three 4p16.3 breakpoint patterns of the MMSET gene described thus far: (a) 5’to exon 3 (KMS-11); (b) within intron3 (NCI-H929); or (c) within intron 4 (OPM-2) (see the scheme in Figure 1A). For simplicity, MB4-1, MB4-2 and MB4-3 were used for these breakpoints, respectively. The cell lines were kindly provided to us by Dr. XinLiang Mao, Soochow University, Suzhou, China.
Fluorescence in situ hybridization
The purified CD138+ plasma cells were assessed using DNA probes specific for the following chromosomal aberrations: del(13q14), del(17p) and amp(1q21). The probes were purchased commercially (Beijing Jinpujia Medical Treatment Science Co. Lt.). For each probe, 200 plasma cells were scored and the cut-off level was at 20% for both deletion and amplification according to the recommendation of the European Myeloma Network (EMN) [24]. An epifluorescence microscope equipped with CCD camera and appropriate filters was used to capture fluorescent images.
RNA extraction and RT-PCR analysis
The mRNAs from KMS-11, OPM-2 and NCI-H929 cell lines and the purified CD138+ BM plasma cells of the studied patients were extracted using the Trizol reagent (Life Technologies, Inc., Grand Island, NY). First-strand cDNA was synthesized using the PrimeScript™ 1stStrand cDNA Synthesis Kit (TaKaRa, Dalian, China). The PCR amplification reactions consisted of 5ml of the first-strand cDNA from each case mixed with 25ml PCR mixture containing specific primers (20pmol/L), MgCl2 (1mM), deoxynucleotide triphosphates (200mM) and Taq DNA polymerase (TaKaRa, Dalian, China) as described previously [25]. The primers for IgH/MMSET were as follows: JH6, ACCACGGTCACCGTCTCCTCA (sense primer); ms6r, CCTCAATTTCCCTGAAATTGGTT (antisense primer). The primers for FGFR3 used in the study were as follows: FGFR3-F, GCGGGCAATTCTATTGGGT (sense primer) and FGFR3-R, GGGAGATCTTGTGCACGGTG (antisense primer). The primers for ß-actin, a housekeeping gene, were as follows: ß-actin-F, TTAGCTGTGCTCGCGCTACTCTCTC (sense primer); and ß-actin-R, GTCGGATTGATGAAACCCAGACACA (antisense primer). Thirty-five amplification cycles were performed at 94°C for 30 s, 55°C for 30 s and 72°C for 1 min.
Statistical analysis
SPSS version 20.0 software was used for statistical analysis of the data. Categorical variable comparisons were performed using Fisher’s exact test or chi-square and non-parametric tests. Survival curves were obtained using the Kaplan-Meier method and significant differences between the curves were tested using the log-rank test. Multivariate analysis of the Cox Proportional-Hazard model was performed to identify variables associated with PFS and OS. A statistically significant difference was considered at P≤0.05.
Abbreviations
MM: multiple myeloma; MMSET: multiple myeloma SET domain; FGFR3: fibroblast growth factor receptor 3; FISH: fluorescence in situ hybridization; RT-PCR: reverse transcription polymerase chain reaction; PFS: progression free survival; OS: overall survival; ISS: International Staging System; R-ISS: Revised International Staging System; LDH: lactate dehydrogenase; β2-MG: β2-microglobulin; Cr: creatinine; del(17p): deletion of chromosome 17 at p13; amp(1q21): amplification of chromosome 1 at q21; pos: positive; der: derivation; Ser: Serine; BM: bone marrow; CBD: bortezomib, cyclophosphamide and dexamethasone; VD: bortezomib and dexamethasone; PAD: bortezomib, adriamycin and dexamethasone; VTD: bortezomib, thalidomide and dexamethasone; RCD: lenalidomide, cyclophosphamide and dexamethasone; CTD: cyclophosphamide, thalidomide and dexamethasone; VAD: vindesine, doxorubicin or pegylated doxorubicin and dexamethasone; TAD: thalidomide, doxorubicin and dexamethasone; BiCTD: clarithromycin plus CTD; RD: lenalidomide and dexamethasone; RAD: lenalidomide, doxorubicin and dexamethasone; ORR: overall response rate; CR: complete response; VGPR: very good partial response; PR: partial response; SD: stable disease; IMWG: International Myeloma Working Group; EMN: European Myeloma Network.
Author contributions
Feng Li designed and conducted the experiments, and wrote the manuscript. Feng Li, Yong-ping Zhai, Ting Lai, Hui Zhang and Yu-mei Tang carried out the collection of samples and the clinical data. Feng Li and Qian Zhao conducted the analysis of the clinical data. Jian Hou contributed to the experimental design, the review and revision of the manuscript, and the final approval of the manuscript.
ACKNOWLEDGMENTS
We would like to acknowledge colleagues at Changzheng and Jinling Hospitals for the detailed scientific discussion.
CONFLICTS OF INTEREST
The authors declare that no conflicts of interest exist.
FUNDING
This work was supported by grants from Jinling Hospital of Nanjing (Grant No 2014012) and the Six Talent Peak Project in Jiangsu Province (Grant No 2015-WSN-011).
REFERENCES
1. Demchenko Y, Roschke A, Chen WD, Asmann Y, Bergsagel PL, Kuehl WM. Frequent occurrence of large duplications at reciprocal genomic rearrangement breakpoints in multiple myeloma and other tumors. Nucleic Acids Res. 2016; 44:8189-8198.
2. Keats JJ, Reiman T, Belch AR, Pilarski LM. Ten years and counting: so what do we know about t(4;14)(p16;q32) multiple myeloma. Leuk Lymphoma. 2006; 47:2289-2300.
3. Pollett JB, Trudel S, Stern D, Li ZH, Stewart AK. Overexpression of the myeloma-associated oncogene fibroblast growth factor receptor 3 confers dexamethasone resistance. Blood. 2002; 100:3819-3821.
4. Fonseca R, Blood E, Rue M, Harrington D, Oken MM, Kyle RA, Dewald GW, Van Ness B, Van Wier SA, Henderson KJ, Bailey RJ, Greipp PR. Clinical and biologic implications of recurrent genomic aberrations in myeloma. Blood. 2003; 101:4569-4575.
5. Jaksic W, Trudel S, Chang H, Trieu Y, Qi X, Mikhael J, Reece D, Chen C, Stewart AK. Clinical outcomes in t(4;14) multiple myeloma: a chemotherapy-sensitive disease characterized by rapid relapse and alkylating agent resistance. J Clin Oncol. 2005; 23:7069-7073.
6. Moreau P, Facon T, Leleu X, Morineau N, Huyghe P, Harousseau JL, Bataille R, Avet-Loiseau H. Recurrent 14q32 translocations determine the prognosis of multiple myeloma, especially in patients receiving intensive chemotherapy. Blood. 2002; 100:1579-1583.
7. Chang H, Sloan S, Li D, Zhuang L, Yi QL, Chen CI, Reece D, Chun K, Keith Stewart A. The t(4;14) is associated with poor prognosis in myeloma patients undergoing autologous stem cell transplant. Br J Haematol. 2004; 125:64-68.
8. Avet-Loiseau H, Leleu X, Roussel M, Moreau P, Guerin-Charbonnel C, Caillot D, Marit G, Benboubker L, Voillat L, Mathiot C, Kolb B, Macro M, Campion L, et al. Bortezomib plus dexamethasone induction improves outcome of patients with t(4;14) myeloma but not outcome of patients with del(17p). J Clin Oncol. 2010; 28:4630-4634.
9. San Miguel JF, Schlag R, Khuageva NK, Dimopoulos MA, Shpilberg O, Kropff M, Spicka I, Petrucci MT, Palumbo A, Samoilova OS, Dmoszynska A, Abdulkadyrov KM, Schots R, et al. Bortezomib plus melphalan and prednisone for initial treatment of multiple myeloma. N Engl J Med. 2008; 359:906-917.
10. Moreau P, Attal M, Garban F, Hulin C, Facon T, Marit G, Michallet M, Doyen C, Leyvraz S, Mohty M. Heterogeneity of t(4;14) in multiple myeloma. Long-term follow-up of 100 cases treated with tandem transplantation in IFM99 trials. Leukemia. 2007; 21:2020-2024.
11. Chesi M, Nardini E, Lim RS, Smith KD, Kuehl WM, Bergsagel PL. The t(4; 14) translocation in myeloma dysregulates both FGFR3 and a novel gene, MMSET, resulting in IgH/MMSET hybrid transcripts. Blood. 1998; 92:3025-3034.
12. Keats JJ, Reiman T, Maxwell CA, Taylor BJ, Larratt LM, Mant MJ, Belch AR, Pilarski LM. In multiple myeloma, t(4; 14)(p16; q32) is an adverse prognostic factor irrespective of FGFR3 expression. Blood. 2003; 101:1520-1529.
13. Marango J, Shimoyama M, Nishio H, Meyer JA, Min DJ, Sirulnik A, Martinez MY, Chesi M, Bergsagel PL, Zhou MM, Waxman S, Leibovitch BA, Walsh MJ, et al. The MMSET protein is a histone methyltransferase with characteristics of a transcriptional corepressor. Blood. 2008; 111:3145-3154.
14. Kuo AJ, Cheung P, Chen K, Zee BM, Kioi M, Lauring J, Xi YX, Park BH, Shi XB, Garcia BA, Li W, Gozani O. NSD2 links dimethylation of histone H3 at lysine 36 to oncogenic programming. Mol cell. 2011; 44: 609-620.
15. Pei H, Zhang L, Luo K, Qin Y, Chesi M, Fei F, Bergsagel PL, Wang L, You Z, Lou Z. MMSET regulates histone H4K20 methylation and 53BP1 accumulation at DNA damage sites. Nature. 2011; 470:124-128.
16. Keats JJ, Maxwell CA, Taylor BJ, Hendzel MJ, Chesi M, Bergsagel PL, Larratt LM, Mant MJ, Reiman T, Belch AR, Pilarski LM. Overexpression of transcripts originating from the MMSET locus characterizes all t(4;14)(p16;q32)-positive multiple myeloma patients. Blood. 2005; 105:4060-4069.
17. Lazareth A, Song XY, Coquin A, Harel S, Karlin L, Belhadj K, Roos-Weil D, Frenzel L, Tamburini J, Macro M, Chevret S, Loiseau HA, Minvielle S, et al. MB4-2 breakpoint in MMSET combined with del(17p) defines a subset of t(4;14) multiple myeloma with very poor prognosis. Haematologica. 2015; 100:e471-e474.
18. Xie Z, Bi C, Chooi JY, Chan ZL, Mustafa N, Chng WJ. MMSET regulates expression of IRF4 in t(4;14) myeloma and its silencing potentiates the effect of bortezomib. Leukemia. 2015; 29:2347-2354.
19. An G, Li Z, Tai YT, Acharya C, Li Q, Qin X, Yi S, Xu Y, Feng X, Li C, Zhao J, Shi L, Zang M, et al. The impact of clone size on the prognostic value of chromosome aberrations by fluorescence in situ hybridization in multiple myeloma. Clin Cancer Res. 2015; 21:2148-2156.
20. Lauring J, Abukhdeir AM, Konishi H, Garay JP, Gustin JP, Wang Q, Arceci RJ, Matsui W, Park BH. The multiple myeloma–associated MMSET gene contributes to cellular adhesion, clonogenic growth, and tumorigenicity. Blood. 2008; 111:856-864.
21. Martinez-Garcia E, Popovic R, Min DJ, Sweet SM, Thomas PM, Zamdborg L, Heffner A, Will C, Lamy L, Staudt LM. The MMSET histone methyl transferase switches global histone methylation and alters gene expression in t(4; 14) multiple myeloma cells. Blood. 2011; 117:211-220.
22. Evans DL, Zhang H, Ham H, Pei H, Lee S, Kim J, Billadeau DD, Lou Z. MMSET is dynamically regulated during cell-cycle progression and promotes normal DNA replication. Cell Cycle. 2016;15:95-105.
23. Rajkumar SV, Harousseau JL, Durie B, Anderson KC, Dimopoulos M, Kyle R, Blade J, Richardson P, Orlowski R, Siegel D, Jagannath S, Facon T, Avet-Loiseau H, et al. Consensus recommendations for the uniform reporting of clinical trials: report of the International Myeloma Workshop Consensus Panel 1. Blood. 2011; 117:4691-4695.
24. Ross FM, Avet-Loiseau H, Ameye G, Gutiérrez NC, Liebisch P, O’Connor S, Dalva K, Fabris S, Testi AM, Jarosova M, Hodkinson C, Collin A, Kerndrup G, et al. Report from the European Myeloma Network on interphase FISH in multiple myeloma and related disorders. Haematologica. 2012; 97:1272-1277.
25. Malgeri U, Baldini L, Perfetti V, Fabris S, Vignarelli MC, Colombo G, Lotti V, Compasso S, Bogni S, Lombardi L. Detection of t (4; 14)(p16. 3; q32) chromosomal translocation in multiple myeloma by reverse transcription-polymerase chain reaction analysis of IGH-MMSET fusion transcripts. Cancer Res. 2000; 60:4058-4061.