
INTRODUCTION
Gallbladder cancer (GBC) is the fifth most highly diagnosed type of gastrointestinal tract malignancy and the most common bile duct malignancy [1, 2]. GBC is highly aggressive and spreads to regional lymph nodes at early stage [3]. In addition, it has a high rate of recurrence and chemo-resistance. Patients with GBC generally have a poor prognosis: the overall 5-year survival is less than 5%, the mean survival is 4-6 months [4]. Although massive efforts have been made to develop the effective therapy for GBC, however, little success has been achieved in reducing the mortality rates [5]. Therefore, improved insight into the precise molecular mechanisms of GBC progression is urgent to figure out the way to the diagnosis and treatment for GBC.
Long non-coding RNAs (lncRNAs) are a class of non-coding transcripts longer than 200 nucleotides. LncRNAs could regulate the expression of target genes via various mechanisms, like functioning as competing endogenous RNAs, serving as scaffolds or recruiting chromatin-modifying enzymes to target genes [6–8]. Mounting evidence revealed that the dysregulation of lncRNAs might be associated to the misbehavior of cancer progression. In our previous studies, lncRNAs GCASPC, MINCR, CCAT1 and LINC00152 play multi-roles including oncogenes or tumor suppressors in GBC [6, 9–12]. Urothelial carcinoma associated 1 (UCA1), an lncRNA that maps to chromosome 19p13.12, was initially identified in human bladder transitional cell carcinoma [13]. The ‘sponge’ role of UCA1 in cytoplasm had been investigated more than once. Through binding to microRNAs (miRNAs) response elements that could directly suppress their target protein expression, UCA1 has an oncogenic function on various human cancers, such as bladder cancer [14], non-small cell lung cancer [15], hepatocellular carcinoma [16] and etc. Hu et al. [17] also reported that UCA1 was physically associated with enhancer of zeste homolog 2 (EZH2), which suppressed p27 (Kip) through histone methylation (H3K27me3) on p27 (Kip) promoter in nucleus. However, little was known about the expression level of UCA1 and its underlying molecular mechanisms in cell proliferation and metastasis in GBC.
In the present study, we demonstrated the novel role of UCA1 in GBC and figured out that: a) UCA1 was upregulated in GBC; b) the upregulation of UCA1 was related to the tumor size, lymph node metastasis, TNM stage and overall survival of GBC patients; c) UCA1 promoted GBC cell proliferation and metastasis; d) UCA1 promoted tumorigenicity in nude mice; e) UCA1 played a pivotal role in GBC cell proliferation and metastasis through epigenetically regulating the expression of p21 and E-cadherin by interacting with EZH2.
RESULTS
High expression of UCA1 was associated with tumor size, lymph node metastasis, TNM stage and short survival time in GBC patients
To explore whether the expression of UCA1 was elevated in GBC progression, we first detected UCA1 expression levels in forty-five pairs of GBC tissues and neighboring noncancerous tissues by qRT-PCR. As shown in Figure 1A and 1B, the transcript levels of UCA1 were significantly higher in GBC tissues compared with neighboring noncancerous tissues from the same patient. Then, we detected UCA1 expression levels in four human GBC cell lines and human non-tumorigenic biliary epithelial cell line H69. The transcript levels of UCA1 were generally higher in GBC cell lines compared with H69 (Figure 1C). These results suggested that UCA1 was a high expression lncRNA in GBC.
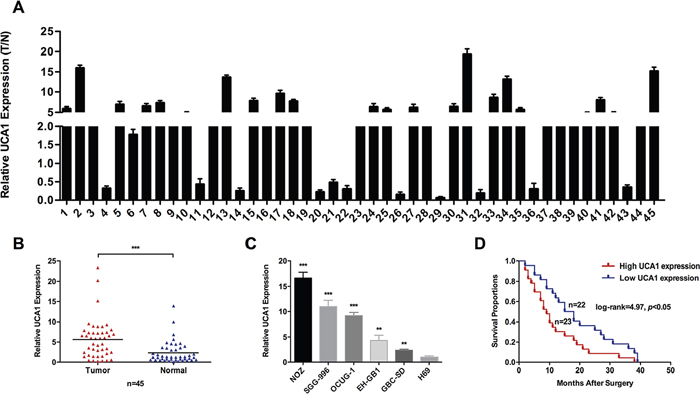
Figure 1: Relative expression of UCA1 in GBC and its clinical significance. (A and B) Relative expression of UCA1 in GBC tissues and neighboring noncancerous tissues was detected by qRT-PCR (n = 45). Relative expression of UCA1 was normalized to GAPDH. (C) Relative expression of UCA1 in GBC cell lines (EH-GB1, GBC-SD, NOZ, OCUG-1 and SGC-996) and human gallbladder epithelium cell line H69 was detected by qRT-PCR. (D) Kaplan–Meier method with the log-rank test was used to analyze the overall survival curves of patients in high and low UCA1 expression groups (log-rank=4.97, p<0.05). The mean ± SD of triplicate experiments were plotted, **p<0.01, ***p<0.001.
To further explore the correlation between the transcript levels of UCA1 and GBC patients’ clinical and pathologic characteristics, we divided forty-five GBC patients into high UCA1 expression group (n=23, UCA1 expression ratio ≥ median ratio) and low UCA1 expression group (n=22, UCA1 expression ratio ≤ median ratio). Statistical analysis indicated that UCA1 expression was significantly associated with tumor size, lymph node metastasis, and TNM stage (Table 1). However, UCA1 expression was not associated with gender, age, local invasion or histological grade. Furthermore, Kaplan-Meier analysis indicated that patients with higher UCA1 expression levels might have a shorter survival time than those with lower levels (Figure 1D).
Table 1: The association of UCA1 expression in 45 GBC patients with clinicopathologic charateristics
Characteristics |
Case number |
UCA1 expression |
p-Value |
|
|---|---|---|---|---|
Low (n=22) |
High (n=23) |
|||
Gender |
|
|
|
0.445 |
Male |
12 |
7 |
5 |
|
Female |
33 |
15 |
18 |
|
Age |
|
|
|
0.436 |
≤ 60 |
26 |
14 |
12 |
|
> 60 |
19 |
8 |
11 |
|
Tumor size |
|
|
|
0.047* |
≤ 5cm |
26 |
16 |
10 |
|
> 5cm |
19 |
6 |
13 |
|
Local invasion |
|
|
|
0.256 |
Yes |
29 |
16 |
13 |
|
No |
16 |
6 |
10 |
|
Lymph node metastasis |
|
|
|
0.035* |
Yes |
30 |
18 |
12 |
|
No |
15 |
4 |
11 |
|
Histological grade |
|
|
|
0.586 |
well and morderately |
31 |
16 |
15 |
|
Poorly and others |
14 |
6 |
8 |
|
TNM stage |
|
|
|
0.042* |
I-II |
14 |
10 |
4 |
|
III-IV |
31 |
12 |
19 |
|
*P<0.05.
UCA1 promoted GBC cell proliferation in vitro and in vivo
To explore whether UCA1 was functionally involved in GBC cell proliferation, we designed two different UCA1 siRNAs to transfect NOZ cells that presented relatively high expression level of UCA1. Then we selected si-UCA1-2 for the subsequent experiments for its higher efficiency (Figure 2A). While, we also established stable UCA1-overexpression GBC-SD cell line that presented relatively low expression level of UCA1 by transfecting pcDNA-UCA1 (Figure 2A). Cell Counting Kit-8 (CCK8) and colony formation assays were performed to evaluate whether UCA1 indeed participated in GBC cell proliferation in vitro. As shown in Figure 2B and 2C, UCA1 knockdown significantly inhibited NOZ cells proliferation, while UCA1 overexpression significantly promoted GBC-SD cells proliferation. Furthermore, EdU retention assay confirmed the inhibitory effect of UCA1 knockdown in NOZ cells proliferation (Figure 2D).
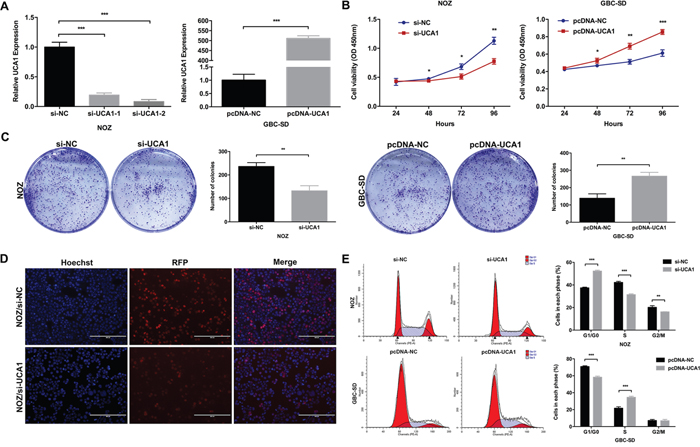
Figure 2: Effect of UCA1 on GBC cell growth in vitro. (A) Relative expression of UCA1 in si-UCA1-transfected NOZ cells, or pcDNA-UCA1-transfected GBC-SD cells was detected by qRT-PCR. (B) The cell viability of si-UCA1-transfected NOZ cells, or pcDNA-UCA1-transfected GBC-SD cells was determined by CCK8 assays. (C) The coloning ability of si-UCA1-transfected NOZ cells, or pcDNA-UCA1-transfected GBC-SD cells was determined by colony formation assays. (D) The cell viability of si-UCA1-transfected NOZ cells was determined by EdU retention assay. (E) Flow cytometric analyses were performed to determine the cell cycle progression in si-UCA1-transfected NOZ cells, or pcDNA-UCA1-transfected GBC-SD cells. The mean ± SD of triplicate experiments were plotted, *p<0.05, **p<0.01, ***p<0.001.
To investigate whether the promotion of UCA1 on GBC cell proliferation in vitro was due to its regulation on cell cycle or apoptosis, we performed the flow cytometric analysis and found that UCA1 knockdown led to a significant G1-phase arrest of NOZ cells and UCA1 overexpression promoted GBC-SD cells cycle progression (Figure 2E). These results suggested that UCA1 was functionally involved in the regulation of G1/S cell-cycle transition in GBC cells. However, we did not observe any difference in the apoptotic rate between different groups (data not shown).
To confirm the results from the in vitro studies, we then compared the tumorigenesis of GBC cell in vivo. GBC-SD cells, transfected with either LV-NC or LV-UCA1, were subcutaneously injected into nude mice. In comparison, tumor developed obviously faster in LV-UCA1 group than that in LV-NC group (Figure 3A). Meanwhile, the tumor weight was significantly heavier in LV-UCA1 group than that in LV-NC group (Figure 3B). In addition, we performed qRT-PCR in mouse tumor tissues and confirmed the significance of UCA1 overexpression in LV-UCA1 group (Figure 3C). Moreover, immunohistochemical staining showed that increased proliferative index Ki-67 expression in LV-UCA1 infected tumor tissues (Figure 3D). These results together suggested that UCA1 could promote GBC cell proliferation in vitro and in vivo.
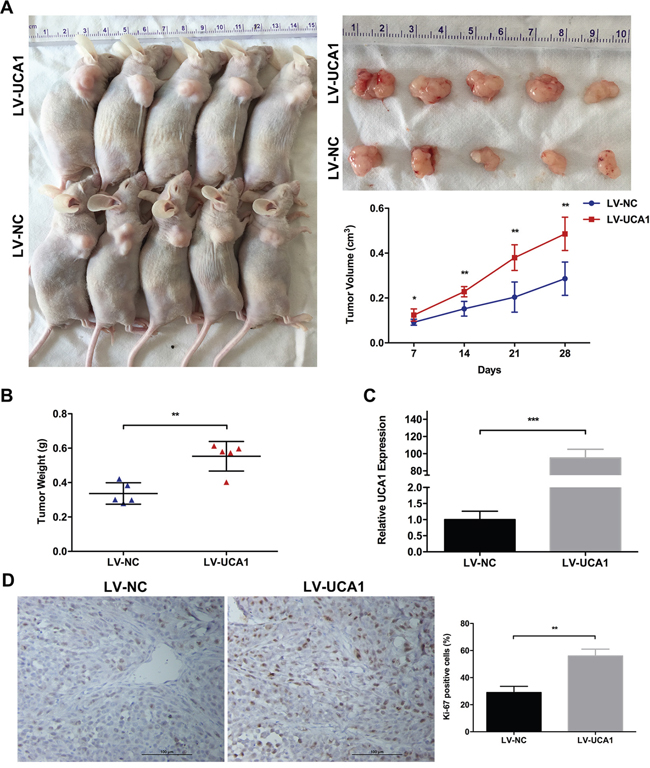
Figure 3: Effect of UCA1 overexpression on tumor growth in vivo. (A) The nude mice carrying tumors from GBC-SD/LV-UCA1 and GBC-SD/LV-NC groups were shown. Tumor growth curves were calculated per week. (B) Tumor weight from GBC-SD/LV-UCA1 and GBC-SD/LV-NC groups was shown. (C) Relative expression of UCA1 in tumors from GBC-SD/LV-UCA1 and GBC-SD/LV-NC groups was detected by qRT-PCR. (D) The Ki-67 expression and positive cell numbers was determined by immunohistochemical staining. The mean ± SD of triplicate experiments were plotted, *p<0.05, **p<0.01, ***p<0.001.
UCA1 promotes GBC cell metastasis and epithelial-mesenchymal transition (EMT) progression
To determine the molecular function of UCA1 in GBC cell metastasis, wound healing and transwell invasion assays were performed to evaluate the ability of GBC cell migration and invasion. Compared with the control, UCA1 knockdown significantly inhibited NOZ cells migration and invasion, while UCA1 overexpression significantly promoted GBC-SD cells migration and invasion (Figure 4A). Accumulating evidence had validated that EMT, a process endowing epithelial cells with mesenchymal properties, plays an important role in GBC [12, 18–20]. Next, we performed immunofluorescence and western blot assays and revealed that UCA1 knockdown increased the epithelial marker E-cadherin expression and decreased the mesenchymal marker Vimentin expression in NOZ cells (Figure 4B and 4C). While, the opposite phenomenon was observed after UCA1 was overexpressed in GBC-SD cells (Figure 4B and 4C). Considered that we had successfully established EMT model in NOZ and GBC-SD cell lines by TGF-β1 [18], we performed qRT-PCR to detect the expression of UCA1 after TGF-β1 treatment. Interestingly, the results showed that UCA1 was both significantly upregulated by TGF-β1 in the two cell lines (Figure 4D). Together, these results suggested that UCA1 could promote GBC cell metastasis and potentiate the epithelial cells to transdifferentiate into mesenchymal cells in vitro.
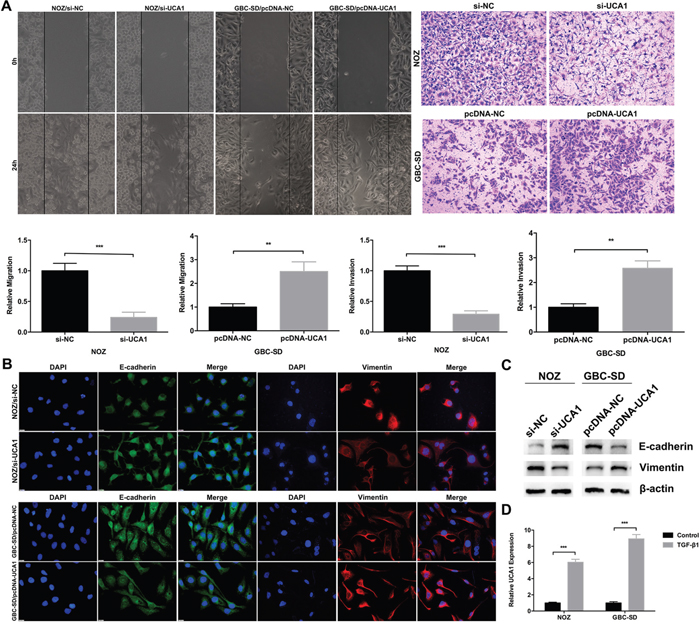
Figure 4: Effect of UCA1 on GBC cell metastasis and EMT in vitro. (A) The cell migration and invasion ability of si-UCA1-transfected NOZ cells, or pcDNA-UCA1-transfected GBC-SD cells were determined by wound healing and transwell invasion assays, respectively. (B and C) The protein levels of E-cadherin and Vimentin in si-UCA1-transfected NOZ cells, or pcDNA-UCA1-transfected GBC-SD cells were determined by immunofluorescenceand western blot assays. (D) Relative expression of UCA1 in TGF-β1 treated NOZ and GBC-SD cells was detected by qRT-PCR. The mean ± SD of triplicate experiments were plotted, **p<0.01, ***p<0.001.
UCA1 epigenetically repressed p21 and E-cadherin transcription via binding with EZH2 in GBC
To explore the molecular mechanism of UCA1 in GBC, we first detected the distribution of UCA1 in two GBC cell lines (NOZ and GBC-SD). As shown in Figure 5A, UCA1 was both present in cytoplasm and nucleus of NOZ and GBC-SD cells. Since the “sponge” role of UCA1 in cytoplasm had been widely reported, in the present study, we aimed to explore whether UCA1 was physically associated with EZH2 that regulated targets at transcriptional level in nucleus. Next, RIP assay in NOZ and GBC-SD cells revealed that UCA1 was significantly enriched in the EZH2 antibody compared to the IgG (Figure 5B). To further confirm the direct binding between UCA1 and EZH2, we performed RNA pull down assay as well. There are three isoforms of UCA1 including 1.4, 2.2 and 2.7kb. Since the most abundant distribution of the 1.4kb isoform of UCA1, we focused on its functional significance in this study. The RNA pull down assay showed that biotin-labeled UCA1 could harbor EZH2 but not β-actin, which suggested that UCA1 could specially bind with EZH2 (Figure 5C).
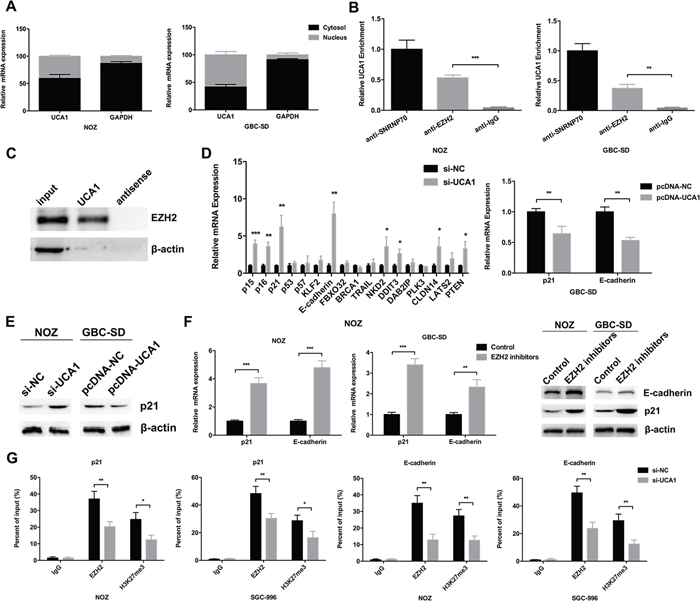
Figure 5: UCA1 bound with EZH2 to epigenetically repress p21 and E-cadherin transcription. (A) Relative expression of UCA1 in cell cytoplasm or nucleus of NOZ and GBC-SD cells was detected by qRT-PCR. (B) Amount of UCA1 bound to SNRNP70 (a positive control), EZH2 or IgG (a negative control) was detected by qRT-PCR after RIP in NOZ and GBC-SD cells. (C) RNA pull-down assay was conducted using biotin-labeled UCA1 probe and detected the EZH2 expression by western blot assay. Antisense of the UCA1 probe was used as negative control. (D) Relative expression of p15, p16, p21, p53, p57, KLF2, E-cadherin, FBXO32, BRCA1, TRAIL, NKD2, DDIT3, DAB2IP, PLK3, CLDN14, LATS2 and PTEN mRNA in si-UCA1-transfected NOZ cells, relative expression of p21 and E-cadherin mRNA in pcDNA-UCA1-transfected GBC-SD cells was determined by qRT-PCR. (E) The protein levels of p21 in si-UCA1-transfected NOZ cells, or pcDNA-UCA1-transfected GBC-SD cells were determined by western blot assay. (F) Relative expression of p21 and E-cadherin mRNA, protein levels of p21 and E-cadherin in EZH2 inhibitors treated NOZ and GBC-SD cells were determined by qRT-PCR and western blot assay. (G) ChIP-qRT-PCR analysis of EZH2 occupancy, H3K27me3 binding to the p21 or E-cadherin promoter regions in NOZ and SGC-996 cells, and IgG as a negative control. The mean ± SD of triplicate experiments were plotted, *p<0.05, **p<0.01, ***p<0.001.
Then we selected several EZH2 potential targets (p15, p16, p21, p53, p57, KLF2, E-cadherin, FBXO32, BRCA1, TRAIL, NKD2, DDIT3, DAB2IP, PLK3, CLDN14, LATS2, PTEN) with tumor-suppressor function that had been reported before, and postulated that they might be related to the contributions of UCA1 to GBC progression. The qRT-PCR results showed that the transcript levels of E-cadherin and p21 were increased most in UCA1 knockdown NOZ cells (Figure 5D). And the decreased transcript levels of E-cadherin and p21 could be observed in UCA1 overexpression GBC-SD cells (Figure 5D). Furthermore, the western blot assays confirmed these results in the protein level (Figure 5E). In addition, qRT-PCR and western blot results both showed that EZH2 specific inhibitors (EZP005687) led to increased p21 and E-cadherin expression in NOZ and GBC-SD cells (Figure 5F).
To validate whether UCA1 suppressed p21 and E-cadherin transcription through recruiting EZH2 to p21 and E-cadherin promoters, we performed ChIP assays in NOZ and SGC-996 cells and showed that EZH2 could directly bind to the promoters of p21 and E-cadherin and induce H3K27me3 trimethylation (Figure 5G). Moreover, UCA1 knockdown significantly reduced EZH2 binding and H3K27me3 trimethylation in NOZ and SGC-996 cells (Figure 5G). These results indicated that UCA1 contributes to GBC cell proliferation and metastasis, at least partly, through repressing p21 and E-cadherin expression.
Repression of p21 is potentially involved in the oncogenic function of UCA1
Although the inhibitory effect of p21 on cell proliferation had been validated in other cancers, however, the role of p21 in GBC remained unclear. Then we designed two different p21 siRNAs and transfected them into NOZ cells. As shown in Figure 6A, the expression of p21 was more effectively knocked down by si-p21-1. The results of CCK8 and colony formation assays indicated that knockdown of p21 could significantly promote the NOZ cells proliferation (Figure 6B and 6C). The results of flow cytometric analysis indicated that knockdown of p21 could decrease NOZ cells G1-phase arrest (Figure 6D). These data indicated the functional role of p21 in GBC cell proliferation. Moreover, we performed rescue experiments to investigate the role of UCA1/EZH2/p21 axis in GBC cell proliferation. We co-transfected NOZ cells with UCA1 siRNAs and p21 siRNAs and found that the co-transfection could rescue the cell proliferation inhibition by the knockdown of UCA1 in NOZ cells (Figure 7A, 7B and 7C). While, the E-cadherin protein reduction and metastasis promotion by the overexpression of UCA1 in GBC-SD cells were rescued by the treatment of EZH2 inhibitors (Figure 7D and 7E).
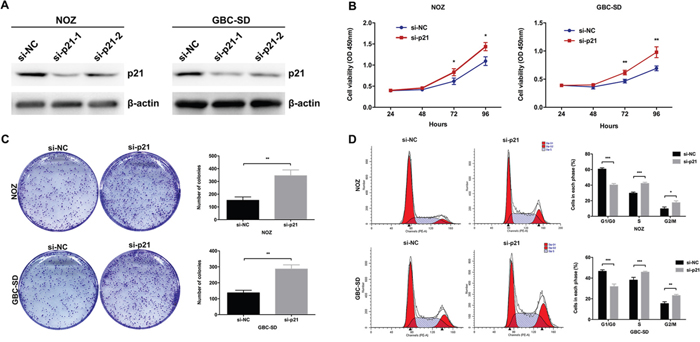
Figure 6: Effect of p21 on GBC cell growth in vitro. (A) The protein levels of p21 in si-p21-transfected NOZ and GBC-SD cells were determined by western blot assay. (B) The cell viability of si-p21-transfected NOZ and GBC-SD cells was determined by CCK8 assays. (C) The coloning ability of si-p21-transfected NOZ and GBC-SD cells was determined by colony formation assays. (D) Flow cytometric analyses were performed to determine the cell cycle progression in si-p21-transfected NOZ and GBC-SD cells. The mean ± SD of triplicate experiments were plotted, *p<0.05, **p<0.01, ***p<0.001.
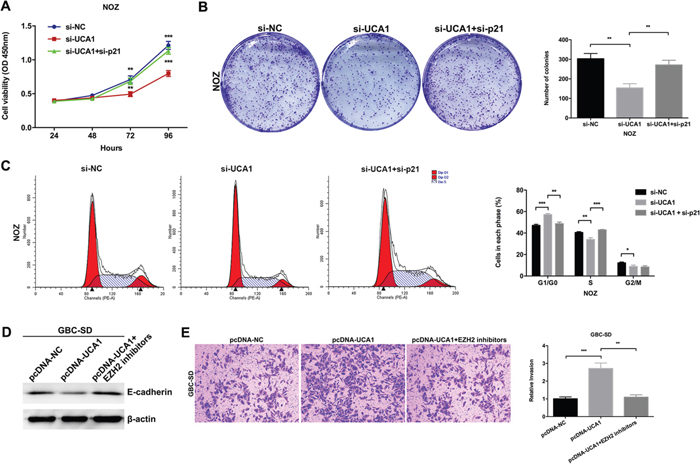
Figure 7: Effect of UCA1/EZH2/p21 and UCA1/EZH2/E-cadherin axes on GBC progression. (A) The cell viability of si-NC-, si-UCA1- or si-UCA1 and si-p21-co-transfected NOZ cells was determined by CCK8 assays. (B) The coloning ability of si-NC-, si-UCA1- or si-UCA1 and si-p21-co-transfected NOZ cells was determined by colony formation assays. (C) Flow cytometric analyses were performed to determine the cell cycle progression in si-NC-, si-UCA1- or si-UCA1 and si-p21-co-transfected NOZ cells. (D) The protein levels of E-cadherin in pcDNA-NC-, pcDNA-UCA1- or EZH2 inhibitors treated and pcDNA-UCA1-transfected GBC-SD cells were determined by western blot assay. (E) The cell invasion ability in pcDNA-NC-, pcDNA-UCA1- or EZH2 inhibitors treated and pcDNA-UCA1-transfected GBC-SD cells was determined by transwell invasion assay. The mean ± SD of triplicate experiments were plotted, *p<0.05, **p<0.01, ***p<0.001.
DISCUSSION
In the present study, we put the spotlight on the role of lncRNA UCA1 in GBC progression and demonstrated its significant upregulation in GBC patient tissues. Statistical analysis in clinical and pathologic characteristics suggested that the high expression level of UCA1 was significantly associated with GBC patients’ tumor size, lymph node metastasis, TNM stage and overall survival. Functionally, knocking down UCA1 in GBC cell inhibited cell proliferation, metastasis and EMT. By amplifying UCA1 in GBC cell, we observed the opposite phenomenon. Furthermore, the tumor xenograft experiment confirmed that UCA1 amplification could promote tumor growth in vivo. These results above indicated the oncogenic role of UCA1 in GBC. However, the corresponding mechanisms that contributed to this were remained unclear.
Through interacting with specific RNA-binding proteins, lncRNAs could activate the oncogenes or inactivate the tumor suppressors and then contribute to the proliferation or metastasis phenotype of cancer cells [7, 11]. EZH2, the crucial catalytic subunit of PRC2, is a histone methyltransferase that is specifically responsible for H3K27me3 trimethylation of target genes and represses their expression [21]. As reported, approximately 20% of all human lncRNAs identified are physically associated with EZH2 [22, 23]. To explore the relationship between UCA1 and EZH2 in GBC, in this study, we performed RIP and RNA pull-down assays and demonstrated the direct interaction between UCA1 and EZH2. ChIP assay showed that EZH2 could bind to the promoter regions of p21 and E-cadherin, which was also confirmed by Xie’ study and Sun’ study [23, 24]. Additionally, after knocking down the expression of UCA1, we found that the binding of EZH2 to p21 and E-cadherin was decreased. After comprehensive consideration, we put forward for the first time that UCA1 might exert oncogenic effects on GBC progression by recruiting EZH2, which binds to the promoter of p21 and E-cadherin to repress their transcript.
As is well known, cell proliferation is closely related to the cell cycle, and loss of cell cycle control partly contributed to tumorigenesis, including GBC. The mammalian cell cycle progression is manipulated by the regulatory subunits cyclins and cyclin-dependent kinases (CDKs) [25]. P21 (p21waf1/cip1 or p21/CDKN1A), an important CDKs inhibitor family member, can arrest the cell cycle progression in G1/S transition by disrupting the interaction between CDKs and cyclins [26, 27]. Li et al. [28] performed immunohistochemistry in GBC tissues and demonstrated that the expression of p21 was frequently decreased and reduced p21 was significantly associated with shortened disease-free and overall survival for patients with stages II to IV GBC patients. However, in the present study, we first confirmed the function of p21 in GBC cell proliferation in vitro and the rescue experiments showed that UCA1-mediated tumor promoting effects on GBC cell was partly dependent on the epigenetic silencing of p21 expression. While, we also found a similar regulatory manner of UCA1 on the major epithelial marker E-cadherin. E-cadherin, a tumor suppressor in cancer development, is regulated by multiple enzymes involving epigenetic modifications [29]. The loss of E-cadherin increases tumor cell migration and invasion, and leads to tumor dissemination [30]. Some identified EMT-inducing transcription factors (Snail, Slug, ZEB1, ZEB2, Twist1, Twist2, etc.) could silence the transcription of E-cadherin by directly binding to the E-box motifs of E-cadherin promoter and recruiting multiple corepressors to this region [31–33]. Additionally, TGF-β1 is an acknowledged EMT inducer that changes fibroblast growth characteristics. Zuo et al. reported that UCA1 promoted gastric cancer invasion and metastasis under TGF-β1 induction [34]. Our present study found a similar phenomenon in GBC and partly explained the mechanism by which UCA1 promoted GBC cell EMT and then influenced the metastasis.
Collectively, we identified that lncRNA UCA1 promoted GBC progression by recruiting EZH2 to the promoters of tumor suppressors p21 and E-cadherin, and consequently decelerated their transcript. Our findings not only highlighted the role of UCA1 in GBC progression, but also revealed a new axis by which UCA1 promoted GBC cell proliferation and metastasis. Along with further research, UCA1 might be a prognostic indicator as well as a therapeutic target for GBC.
MATERIALS AND METHODS
Patients and tissue samples
This study was approved by the Human Ethics Committee of Xinhua Hospital (Shanghai JiaoTong University School of Medicine, Shanghai, China). A cohort of forty-five GBC tissues and neighboring noncancerous tissues were obtained from patients who underwent liver resection from November 2009 to October 2012 in Xinhua Hospital (Shanghai JiaoTong University School of Medicine, Shanghai, China) and Eastern Hepatobiliary Surgery Hospital (Second Military Medical University, Shanghai, China). Informed consent was obtained from all patients. All patients were diagnosed with GBC according to two independent pathologists’ evaluation. There was no any pre-operative treatment conducted in the recruited patients.
Cell culture, qRT-PCR, western blot, cell transfection, cell invasion assay, cell proliferation assay, flow cytometric analysis, chromatin immunoprecipitation (ChIP) assay and immunohistochemical staining
Cell culture, qRT-PCR, western blot, cell transfection, cell invasion assay, cell proliferation assay, flow cytometric analysis, ChIP assay and immunohistochemical staining were performed as described previously [9]. The antibodies for western blot were anti-p21 (1:2000, Proteintech, China), anti-E-cadherin (1:5000, Proteintech, China), anti-Vimentin (1:5000, Proteintech, China) and anti-β-actin (1:5000, Proteintech, China). The antibodies for ChIP were anti-EZH2 (1:100, Cell Signaling Technology, USA) and anti-H3K27me3 (1:50, Cell Signaling Technology, USA). The antibody for immunohistochemical staining was anti-Ki-67 (1:200, Cell Signaling Technology, USA). Vectors pcDNA-UCA1 and LV-GFP-UCA1 were brought from Genechem (Shanghai, China). Primers for qRT-PCR, siRNAs sequence and ChIP are shown in Supplementary Table 1.
Wound healing assay, RNA-binding protein immunoprecipitation assay (RIP) and immunofluorescence analysis
Wound healing assay, RNA-binding protein immunoprecipitation assay (RIP) and immunofluorescence analysis were performed as described previously [6]. The antibodies for RIP were anti-EZH2 (1:50, Cell Signaling Technology, USA). The antibodies for immunofluorescence analysis were anti-E-cadherin (1:200, Proteintech, China), anti-Vimentin (1:200, Proteintech, China). Primers for RIP are shown in Supplementary Table 1.
Colony formation assay
Approximately 1000 transfected NOZ or GBC-SD cells were seeded into each well of 6-well plates and cultured in media with 10% fetal bovine serum. After two weeks, cells were treated with methanol and stained with 0.1% crystal violet. The number of visible colonies was counted.
Ethynyldeoxyuridine (EdU) retention assay
The EdU labeling/detection kit (Ribobio, China) was used according to the manufacturer’s instructions to evaluate cell proliferation. Forty-eight hours after transfection, approximately 5000 transfected NOZ cells were seeded into each well of 96-well plates, 50 μM EdU labeling media was added and incubated for 2 hours at 37°C under 5% CO2. Then cells were treated with 4% paraformaldehyde, 0.5% Triton X-100 and anti-EdU working solution successively. The percentage of EdU-positive cells was calculated using fluorescent microscopy.
Subcellular fractionation
To determine the cellular localization of UCA1, cytoplasm and nuclear fractions were isolated and collected with RNeasy Midi Kit (Qiagen, Germany) according to the manufacturer’s instructions. RNAs extracted from each of the fractions were subjected to following qRT-PCR analysis of the levels of GAPDH and UCA1.
RNA pull-down assay
RNA pull-down assay was performed using Magnetic RNA-Protein Pull-Down Kit (Pierce, USA) according to the manufacturer’s instructions. First, the full length of UCA1 was synthesized using RiboMAX™ Large Scale RNA Production Systems (Promega, USA). After biotin labeling, UCA1 was bound to the beads for protein binding. Cell protein lysate was added with RNA-bound beads for immunoprecipitation. Beads were washed three times and boiled in SDS buffer, and the retrieved protein was detected by western blot analysis. The antibody for RNA pull-down assay was anti-EZH2 (1:1000, Cell Signaling Technology, USA).
Tumor xenograft experiment
Each 4-week-old male nude mouse (five mice per group) was subcutaneously injected with GBC-SD cells (100μl, 1 × 10⁶) that stably expressing LV-UCA1 or LV-NC. Tumor volumes were calculated as 0.5 × length × width2 on a weekly basis. After four weeks, mice were sacrificed, and tumors were excised, weighed and subjected to immunofluorescence analysis for Ki-67 expression. All animal experiments were performed in animal laboratory center of Xinhua Hospital (Shanghai JiaoTong University School of Medicine, Shanghai, China). The study protocol was approved by the Animal Care and Use committee of Xinhua Hospital.
Statistical analysis
Statistical analysis was performed using SPSS 20.0 (SPSS, USA). Data were presented as mean ± standard deviation (SD). Paired samples t-test was used to analyze the expression differences of UCA1 between GBC tissues and neighboring noncancerous tissues. Independent samples t-test was used to analyze the differences between groups. Kaplan-Meier method was used to analyze the survival, and log-rank test was used to determine the significance. Pearson’s correlation coefficient was applied for expression correlation assay. P values were two-side and a p value less than 0.05 was considered to be statistically significant.
Abbreviations
LncRNAs: long non-coding RNAs; UCA1: urothelial carcinoma associated 1; GBC: gallbladder cancer; qRT-PCR: quantitative real-time polymerase chain reaction; CCK8: cell counting kit-8; EdU: ethynyldeoxyuridine; RIP: RNA-binding protein immunoprecipitation; ChIP: chromatin immunoprecipitation; EZH2: enhancer of zeste homolog 2; miRNAs: microRNAs; H3K27me3: histone H3 at lysine 27 trimethylation; SD: standard deviation; EMT: epithelial-mesenchymal transition; PRC2: polycomb repressive complex 2.
Author contributions
QC and LYJ carried out the molecular lab work, participated in data analysis, carried out sequence alignments, participated in the design of the study and drafted the manuscript; SHW and DZ carried out the statistical analyses; JDW and ZHT collected field data; ZWQ conceived of the study, designed the study, coordinated the study and helped draft the manuscript.
ACKNOWLEDGMENTS
We sincerely acknowledge the Eastern Hepatobiliary Surgical Hospital and Institute, The Second Military University, Shanghai, for the generous help.
CONFLICTS OF INTEREST
All authors declare no conflicts of interest.
FUNDING
This study is supported by the National Natural Science Foundation of China (81572297).
REFERENCES
1. Zhu AX, Hong TS, Hezel AF, Kooby DA. Current management of gallbladder carcinoma. Oncologist. 2010; 15:168-81. doi: 10.1634/theoncologist.2009-0302.
2. Wistuba II, Gazdar AF. Gallbladder cancer: lessons from a rare tumour. Nat Rev Cancer. 2004; 4:695-706. doi: 10.1038/nrc1429.
3. Lazcano-Ponce EC, Miquel JF, Munoz N, Herrero R, Ferrecio C, Wistuba II, Alonso de Ruiz P, Aristi Urista G, Nervi F. Epidemiology and molecular pathology of gallbladder cancer. CA Cancer J Clin. 2001; 51:349-64. doi:
4. Rakic M, Patrlj L, Kopljar M, Klicek R, Kolovrat M, Loncar B, Busic Z. Gallbladder cancer. Hepatobiliary Surg Nutr. 2014; 3:221-6. doi: 10.3978/j.issn.2304-3881.2014.09.03.
5. Gold DG, Miller RC, Haddock MG, Gunderson LL, Quevedo F, Donohue JH, Bhatia S, Nagorney DM. Adjuvant therapy for gallbladder carcinoma: the Mayo Clinic Experience. Int J Radiat Oncol Biol Phys. 2009; 75:150-5. doi: 10.1016/j.ijrobp.2008.10.052.
6. Cai Q, Wang Z, Wang S, Weng M, Zhou D, Li C, Wang J, Chen E, Quan Z. Long non-coding RNA LINC00152 promotes gallbladder cancer metastasis and epithelial-mesenchymal transition by regulating HIF-1alpha via miR-138. Open Biol. 2017; 7:160247. doi: 10.1098/rsob.160247.
7. Li D, Liu X, Zhou J, Hu J, Zhang D, Liu J, Qiao Y, Zhan Q. LncRNA HULC modulates the phosphorylation of YB-1 through serving as a scaffold of ERK and YB-1 to enhance hepatocarcinogenesis. Hepatology. 2016; 65:1612-27. doi: 10.1002/hep.29010.
8. Yang F, Zhang L, Huo XS, Yuan JH, Xu D, Yuan SX, Zhu N, Zhou WP, Yang GS, Wang YZ, Shang JL, Gao CF, Zhang FR, et al. Long noncoding RNA high expression in hepatocellular carcinoma facilitates tumor growth through enhancer of zeste homolog 2 in humans. Hepatology. 2011; 54:1679-89. doi: 10.1002/hep.24563.
9. Cai Q, Wang ZQ, Wang SH, Li C, Zhu ZG, Quan ZW, Zhang WJ. Upregulation of long non-coding RNA LINC00152 by SP1 contributes to gallbladder cancer cell growth and tumor metastasis via PI3K/AKT pathway. Am J Transl Res. 2016; 8:4068-81.
10. Ma MZ, Chu BF, Zhang Y, Weng MZ, Qin YY, Gong W, Quan ZW. Long non-coding RNA CCAT1 promotes gallbladder cancer development via negative modulation of miRNA-218-5p. Cell Death Dis. 2015; 6:e1583. doi: 10.1038/cddis.2014.541.
11. Ma MZ, Zhang Y, Weng MZ, Wang SH, Hu Y, Hou ZY, Qin YY, Gong W, Zhang YJ, Kong X, Wang JD, Quan ZW. Long noncoding RNA GCASPC, a target of miR-17-3p, negatively regulates pyruvate carboxylase-dependent cell proliferation in gallbladder cancer. Cancer Res. 2016; 76:5361-71. doi: 10.1158/0008-5472.can-15-3047.
12. Wang SH, Yang Y, Wu XC, Zhang MD, Weng MZ, Zhou D, Wang JD, Quan ZW. Long non-coding RNA MINCR promotes gallbladder cancer progression through stimulating EZH2 expression. Cancer Lett. 2016; 380:122-33. doi: 10.1016/j.canlet.2016.06.019.
13. Wang XS, Zhang Z, Wang HC, Cai JL, Xu QW, Li MQ, Chen YC, Qian XP, Lu TJ, Yu LZ, Zhang Y, Xin DQ, Na YQ, et al. Rapid identification of UCA1 as a very sensitive and specific unique marker for human bladder carcinoma. Clin Cancer Res. 2006; 12:4851-8. doi: 10.1158/1078-0432.ccr-06-0134.
14. Li Z, Li X, Wu S, Xue M, Chen W. Long non-coding RNA UCA1 promotes glycolysis by upregulating hexokinase 2 through the mTOR-STAT3/microRNA143 pathway. Cancer Sci. 2014; 105:951-5. doi: 10.1111/cas.12461.
15. Nie W, Ge HJ, Yang XQ, Sun X, Huang H, Tao X, Chen WS, Li B. LncRNA-UCA1 exerts oncogenic functions in non-small cell lung cancer by targeting miR-193a-3p. Cancer Lett. 2015; 371:99-106. doi: 10.1016/j.canlet.2015.11.024.
16. Wang F, Ying HQ, He BS, Pan YQ, Deng QW, Sun HL, Chen J, Liu X, Wang SK. Upregulated lncRNA-UCA1 contributes to progression of hepatocellular carcinoma through inhibition of miR-216b and activation of FGFR1/ERK signaling pathway. Oncotarget. 2015; 6:7899-917. doi: 10.18632/oncotarget.3219.
17. Hu JJ, Song W, Zhang SD, Shen XH, Qiu XM, Wu HZ, Gong PH, Lu S, Zhao ZJ, He ML, Fan H. HBx-upregulated lncRNA UCA1 promotes cell growth and tumorigenesis by recruiting EZH2 and repressing p27Kip1/CDK2 signaling. Sci Rep. 2016; 6:23521. doi: 10.1038/srep23521.
18. Wang SH, Wu XC, Zhang MD, Weng MZ, Zhou D, Quan ZW. Upregulation of H19 indicates a poor prognosis in gallbladder carcinoma and promotes epithelial-mesenchymal transition. Am J Cancer Res. 2016; 6:15-26.
19. He J, Shen S, Lu W, Zhou Y, Hou Y, Zhang Y, Jiang Y, Liu H, Shao Y. HDAC1 promoted migration and invasion binding with TCF12 by promoting EMT progress in gallbladder cancer. Oncotarget. 2016; 7:32754-64. doi: 10.18632/oncotarget.8740.
20. Lian S, Shao Y, Liu H, He J, Lu W, Zhang Y, Jiang Y, Zhu J. PDK1 induces JunB, EMT, cell migration and invasion in human gallbladder cancer. Oncotarget. 2015; 6:29076-86. doi: 10.18632/oncotarget.4931.
21. Chang CJ, Hung MC. The role of EZH2 in tumour progression. Br J Cancer. 2012; 106:243-7. doi: 10.1038/bjc.2011.551.
22. Khalil AM, Guttman M, Huarte M, Garber M, Raj A, Rivea Morales D, Thomas K, Presser A, Bernstein BE, van Oudenaarden A, Regev A, Lander ES, Rinn JL. Many human large intergenic noncoding RNAs associate with chromatin-modifying complexes and affect gene expression. Proc Natl Acad Sci U S A. 2009; 106:11667-72. doi: 10.1073/pnas.0904715106.
23. Sun NX, Ye C, Zhao Q, Zhang Q, Xu C, Wang SB, Jin ZJ, Sun SH, Wang F, Li W. Long noncoding RNA-EBIC promotes tumor cell invasion by binding to EZH2 and repressing E-cadherin in cervical cancer. PLoS One. 2014; 9:e100340. doi: 10.1371/journal.pone.0100340.
24. Xie M, Sun M, Zhu YN, Xia R, Liu YW, Ding J, Ma HW, He XZ, Zhang ZH, Liu ZJ, Liu XH, De W. Long noncoding RNA HOXA-AS2 promotes gastric cancer proliferation by epigenetically silencing P21/PLK3/DDIT3 expression. Oncotarget. 2015; 6:33587-601. doi: 10.18632/oncotarget.5599.
25. Sherr CJ. Mammalian G1 cyclins. Cell. 1993; 73:1059-65.
26. Abbas T, Dutta A. p21 in cancer: intricate networks and multiple activities. Nat Rev Cancer. 2009; 9:400-14. doi: 10.1038/nrc2657.
27. Bertoli C, Skotheim JM, de Bruin RA. Control of cell cycle transcription during G1 and S phases. Nat Rev Mol Cell Biol. 2013; 14:518-28. doi: 10.1038/nrm3629.
28. Li X, Hui AM, Shi YZ, Takayama T, Makuuchi M. Reduced p21(WAF1/CIP1) expression is an early event in gallbladder carcinogenesis and is of prognostic significance for patients with carcinomas of the gallbladder. Hum Pathol. 2001; 32:771-7. doi: 10.1053/hupa.2001.26474.
29. De Craene B, Berx G. Regulatory networks defining EMT during cancer initiation and progression. Nat Rev Cancer. 2013; 13:97-110. doi: 10.1038/nrc3447.
30. Ye X, Weinberg RA. Epithelial-mesenchymal plasticity: a central regulator of cancer progression. Trends Cell Biol. 2015; 25:675-86. doi: 10.1016/j.tcb.2015.07.012.
31. Hajra KM, Chen DY, Fearon ER. The SLUG zinc-finger protein represses E-cadherin in breast cancer. Cancer Res. 2002; 62:1613-8.
32. Yang J, Mani SA, Donaher JL, Ramaswamy S, Itzykson RA, Come C, Savagner P, Gitelman I, Richardson A, Weinberg RA. Twist, a master regulator of morphogenesis, plays an essential role in tumor metastasis. Cell. 2004; 117:927-39. doi: 10.1016/j.cell.2004.06.006.
33. Comijn J, Berx G, Vermassen P, Verschueren K, van Grunsven L, Bruyneel E, Mareel M, Huylebroeck D, van Roy F. The two-handed E box binding zinc finger protein SIP1 downregulates E-cadherin and induces invasion. Mol Cell. 2001; 7:1267-78.
34. Zuo ZK, Gong Y, Chen XH, Ye F, Yin ZM, Gong QN, Huang JS. TGFbeta1-induced LncRNA UCA1 upregulation promotes gastric cancer invasion and migration. DNA Cell Biol. 2017; 36:159-67. doi: 10.1089/dna.2016.3553.