
INTRODUCTION
Pancreatic cancer is one of the most lethal diseases among all cancer types, leading to about 79,400 deaths in China [1] and 330,400 deaths worldwide [2]. The five-year survival rate is only 2–7% [3, 4]. This poor outcome could be largely due to the late diagnosis. The mechanism underlying its progression is still unclear. The expression profiles of pancreatic cancer had been widely studied, revealing several molecular factors affecting various aspects of pancreatic cancer [5]. Terris et al. found four genes — caveolin 1, glypican 1, growth arrest-specific 6 protein, cysteine-rich angiogenic inducer 61 were associated with the pathogenesis of pancreatic cancer and possible early stage pancreatic cancer indicators [6]. For some patients, PCK1, SFRP2 were identified as potential metastasis markers in a study comparing the expression profiles primary and metastasis pancreatic cancer [7]. GSTT1, TOP2A, CASP3 and ABCC2 had been found to possess gemcitabine sensitivity predictive properties [8]. These studies usually adopted differentially expressed genes (DEG) methods. This means the studies considered the relevance between expression levels and certain phenotype separately, ignoring the relationships between the genes. These methods would bring redundancies to the findings, mixing the most representative genes into the bulk results.
Feature selection often means the process of maximizing the classification accuracy with the combination of the selected features integrating into a classification model. To that end, people select the features passing certain relevance threshold. Relevance is usually characterized in terms of correlation or mutual information. But many genes work closely as a functional module. The interactions among them may contribute to class distinctions. However, combinations of individually good features are not necessarily a good gene set representing the whole picture underlying the biological processes [9]. Minimum-redundancy-maximum-relevance (mRMR) had been widely used in several biological fields such as predicting lysine ubiquitination [10], protein-protein interactions [11] and HIV Progression-Related Genes [12]. This method considers the associations between the features and the target phenotype, together with the inner relationships among the features. Comparing with the other methods, mRMR showed better classification accuracy [13].
The proteins work together to form functional modules. Investigating the disease candidate genes should consider these interactions for better understanding how the candidates function. Among the interaction databases, STRING (Search Tool for the Retrieval of Interacting Genes) [14] is most frequently used because of its millions interactions and the high quality scoring system. With this powerful data source, we can restore the overall functional impact of the genes of our interest.
In this study, we performed a Minimum-redundancy-maximum-relevance (mRMR) based transcriptome study. The objective was to find a set of genes which best classifying these two types of samples, explaining some mechanisms of the pathogenesis of pancreatic cancer. Based on graphic analysis [15] on STRING PPIs network we further identified pancreatic cancer association genes and functional modules worthy for further experimental studies.
RESULTS
Gene probes identified by mRMR-IFS
We retrieved 45 pancreatic cancer and 45 non-tumor samples’ gene expression profiles from GEO (GSE28735) consisting 28,869 probes. We used mRMR-IFS method to do feature selection and used K-nearest-neighbor model to do phenotype classification (see Methods). We adopted K-nearest-neighbor model and jackknife validation, and calculated the classification accuracy of 1 to 500 probes (Figure 1). We found a set of 10 probes with the accuracy of 0.88, which is close to the highest accuracy of 0.89 with 80 probes. The 10 gene probes set would be more representative than 80 gene probes set, so we choose 10 gene probes (Table 1). The differential expression of LAMC2, S100P, KPNA7, AMIGO2 and KCNN4 had also been reported in other studies [16–20] (Figure 2). Some genes had been reported to be related to PDAC, such as LAMC2, S100P and KPNA7 [18, 21, 22]. We also identified novel pancreatic cancer genes, such as SCML2, COL17A1, AMIGO2, PTPRR, suggesting our method might be able to predict novel PDAC-related genes.
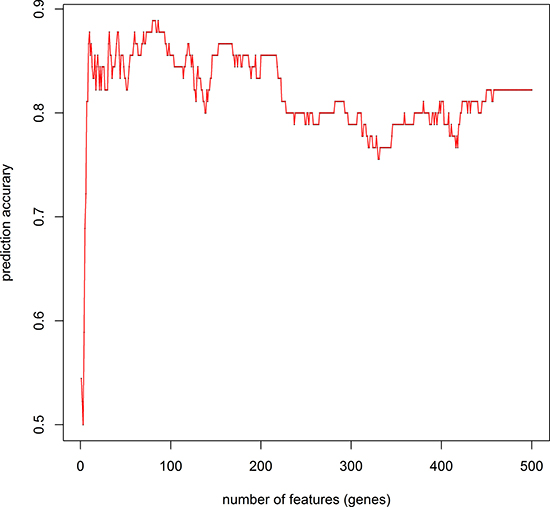
Figure 1: IFS curve to determine the number of features used in prediction. We used an IFS curve to determine the number of features finally used in the mRMR feature selection. Prediction accuracy reached its second maximum value at 10 gene probes. The x-axis indicates the number of probes used for classification, and the y-axis is the prediction accuracy.
Table 1: Top 10 of the genes by betweenness in the shortest paths
Probe ID |
seqname |
STRAND |
START |
STOP |
Gene Symbol |
mRMR score |
|---|---|---|---|---|---|---|
8166266 |
chrX |
+ |
17393543 |
17754114 |
NHS |
0.26468 |
8171561 |
chrX |
− |
18257433 |
18372847 |
SCML2 |
0.262552 |
7908072 |
chr1 |
+ |
1.83E+08 |
1.83E+08 |
LAMC2 |
0.280165 |
8093950 |
chr4 |
+ |
6694796 |
6698897 |
S100P |
0.300541 |
8017098 |
chr17 |
− |
56736510 |
56736657 |
0.270637 |
|
7936144 |
chr10 |
− |
1.06E+08 |
1.06E+08 |
COL17A1 |
0.28748 |
7962579 |
chr12 |
− |
47469490 |
47473734 |
AMIGO2 |
0.270462 |
7964907 |
chr12 |
− |
71031853 |
71314586 |
PTPRR |
0.232587 |
8141263 |
chr7 |
− |
98775543 |
98805089 |
KPNA7 |
0.188924 |
8037408 |
chr19 |
− |
44270685 |
44285409 |
KCNN4 |
0.817682 |
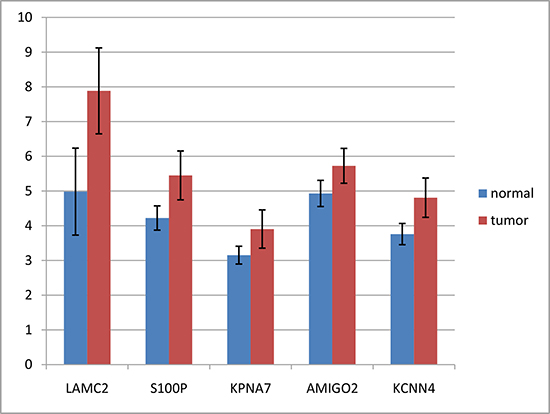
Figure 2: Expression differences of LAMC2, S100P, KPNA7, AMIGO2 and KCNN4 between tumors and non-tumors. Format: PNG This figure shows the expression differences of LAMC2, S100P, KPNA7 and AMIGO2 between tumors and non-tumors, separately. Error bars indicate standard errors.
A PPI sub-network of the genes
We further built up an undirected network using PPIs from STRING [14]. The protein pairs with PPI score greater than 0.8 were used to form high confidence network. From the 10 gene probes identified by mRMR-IFS, we found 9 genes corresponding to 27 proteins in STRING. 8 proteins were in the high confidence network. We computed the shortest path of every pairs of proteins using the Dijkstra’s algorithm [15]. The shortest paths were integrated into a sub-network (Figure 3), and the sub-network contains 51 protein-protein interactions involving 40 proteins. We conducted a permutation test to evaluate the significance of betweenness of the proteins against background network. 30 proteins passing the test were selected and ranked according to their betweenesses (Supplementary Table 1). Among the betweenesses, MAPK1’s had the largest, which was 14, indicating there were at least 7 shortest paths going through this gene.
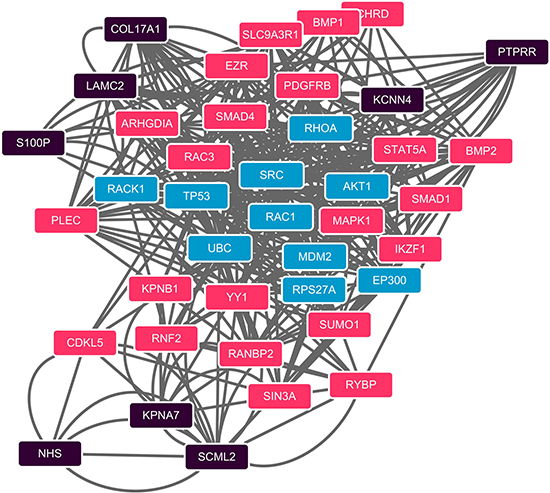
Figure 3: PPI network of shortest paths among 40 computational method identified proteins. Shortest paths between each pair of the 8 proteins (black) which from the 40 computational method selected proteins were identified in the STRING PPI network. Proteins in black are the 8 identified genes using the computational method which also present in the STRING PPI network; red ones are shortest paths proteins passed the permutation test; blue are not passed ones.
Functional enrichment analysis of the genes
Using DAVID, we implemented GO functional enrichment analysis and KEGG pathway analysis with the 10 probes. Results showed that these genes were significantly enriched in the cell adhesion in organelle (Supplementary Table 2). Only one KEGG pathway was significantly enriched (hsa04974: Protein digestion and absorption) (p-value = 0.038, Supplementary Table 3).
We also performed KEGG pathway and GO functional enrichment with the 30 hub genes on the shortest paths. The GO results showed that many genes were significantly enriched in the modules of negative regulation of transcription from RNA polymerase II promoter (Supplementary Table 4). And the KEGG pathway results showed that these genes were significantly enriched in the TGF-beta signaling pathway (hsa05212: Pancreatic cancer, p-value=3.08E-05, Supplementary Table 5).
DISCUSSION
In a previous study, Zhang et al. identified 277 genes to be differentially expressed with this set of data [23]. By our approach, a more compact set of features was identified (Supplementary Table 4) with high classification accuracy.
Among the more than 20,000 probes in the transcriptome data, we selected 10 probes corresponding to 9 genes as the most optimized predictors. They are NHS, SCML2, LAMC2, S100P, COL17A1, AMIGO2, PTPRR, KPNA7 and KCNN4. Some of them had been proved to be associated with pancreatic cancer.
LAMC2 (Laminin subunit gamma-2) Laminins are extracellular matrix glycoproteins. Studies showed that they are involved in many biological processes including cell adhesion, differentiation, and metastasis [24–26]. The overexpression of LAMC2 had been shown to be a predictive marker of pancreatic cancer [21]. Another microarray study also found it overexpressed in PDAC tumor epithelia. Moreover, its expression level negatively correlated with survival [27]. Nerve invasion is a prominent feature of pancreatic cancer. In a study with cell line, mouse model and patients’ surgical tissues, overexpression of LAMC2 was observed to be positively associated with nerve invasion distance [28].
S100P (S100 calcium binding protein P) is a member of S100 family of proteins. S100 regulates cell cycle progression and differentiation [29]. Microarray study had shown it specifically expressed in the neoplastic epithelium of pancreatic cancer [22]. The expression level of S100P is correlated with the rates of cell proliferation, survival, migration and invasion, which makes S100P protein a major promoting factor in the pathogenesis of pancreatic cancer [30]. The abnormal expression might be because of hypomethylation [31]. Overexpression of S100P is an early marker of pancreatic cancer, which down-regulates the levels of cytoskeletal proteins, which disrupts the actin cytoskeleton network and changes in the phosphorylation status of cofilin. S100P also un-regulates expression of two cellular invasion factors S100A6 and aspartic protease cathepsin [32].
AMIGO2 (Adhesion Molecule With Ig Like Domain 2) also named as DEGA (Differentially expressed in gastric adenocarcinomas). As its name DEGA, it may induce several deterious alterations including aneuploidy and abnormal adhesion in gastric cancers [33, 34]. Antibodies against AMIGO2 had been proved to be effective to pancreatic cancer in xenograft models [17].
KPNA7 (karyopherin subunit alpha 7) is a member of importin α family. In vitro experiments had demonstrated that KPNA7 was up-regulated in pancreatic cancer. Silencing KPNA7 could increase the level of p21, promote G1 arrest, and increase autophagy [18]. It is an important factor promoting the malignant of pancreatic cancer.
KCNN4 (potassium calcium-activated channel subfamily N member 4) consists Ca2+ activated voltage-independent K+ channel [35]. Ca2+-activated K+ channels are involved in anion and K+ transport in stimulated pancreatic cells [36]. In vitro study had shown that blocking the channels could inhibit the growth of pancreatic cancer, which suggested the important role of them in the proliferation of pancreatic cancer [16].
MATERIALS AND METHODS
Dataset
The microarray gene expression profiling dataset was downloaded from NCBI Gene Expression Omnibus (accession no.: GSE28735). The dataset contains 45 tumor and 45 non-tumor patients with pancreatic ductal adenocarcinoma (PDAC) [23].
Feature selection
To rank the importance of the features that best distinguish pancreatic ductal adenocarcinoma tumor from normal adjacent tissues, we applied mRMR method, which ranks the features according to their relevance to the target phenotypes minus the redundancy between the features [37]. In our study, we used R package mRMRe to implement mRMR [38]. In mRMRe, both relevance and redundancy are quantified by mutual information (MI):
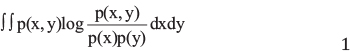
Where x and y are two variables to be tested, p(x) and p(y) are the marginal probabilistic densities, and p(x, y) is their joint probabilistic density, and I(x, y) represents the MI.
Let X = {x1,.....,xn} denote the set of gene probes (input features), and let y denote the phenotype (input target). Given the feature with highest MI between the phenotype xi, the set of ranked features S is initialized with xi. Next, the best balance between maximal relevance and minimum redundancy in the remaining feature xj is added to S. It is selected by maximizing the score q according to the following equation:
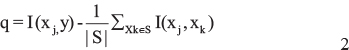
The selection step is repeated until a desirable number of ranked features N, which was 500 in our study.
To determine an appropriate subset of the ranked feature list, we chose incremental feature selection (IFS) to determine the most suitable number of the genes in the feature subset si [39]:

For example, N is 500, then the first feature subset is s1 = {f1}, the second feature subset is s2 = {f1, f2}, and the last feature subset is SN = {f1, f1,...f500}. The feature subset with the best prediction accuracy is selected.
Prediction engine
We used k-nearest neighbor method to predict the phenotype of each individual. In our study, the distance between two individuals was defined according to Chou and coworkers [40, 41]:
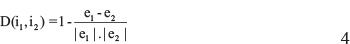
Where i1 and i2 represent two individuals, D refers to the distance between the two individuals, and e1 and e1 are vectors of selected feature sets (expression levels of selected genes) of the two individuals.
Validation method
Independent dataset test, subsampling test, and jackknife test are three validation methods that are often used in statistical model validation. Comparing to other two validation methods jackknife test is better at avoiding the arbitrariness that exists in the independent dataset and subsampling test [40, 42, 43]. In jackknife test, both the training dataset and testing dataset are open. Each sample will be in turn moved between the training dataset and testing dataset.
The prediction accuracy was formulated as:

Where TP represents the number of true positives, TN represents the number of true negatives, FP represents the number of false positives, and FN represents the number of false negatives.
Graphics approach and shortest paths tracing
The initial weighted PPIs network was retrieved from STRING(version 10) [14], and used to constructed a graph G(V,E) . The database contains known and predicted protein interactions, which provides intuitive insights and overall structure properties to study complex biological systems. Based on the PPIs network, we used Dijkstra’s algorithm [15] to identify the shortest path between any pair of proteins that were identified by mRMR-IFS. The visualization of subnetwork with the shortest paths was done by Cytoscape [44].
Permutation test
To test whether the 40 shortest path genes were hubs in the background network, we conducted a permutation test. Occurrences of the 40 proteins were counted up in the shortest paths between randomly selected 8 proteins when they had higher betweenness than that of shortest path genes. This process was repeated 1000 times. The p-value was calculated as the proportion of the occurrence times of the 40 proteins in 1000 permutations. Shortest path genes with a p-value below 0.05 were considered as significant pancreatic cancer related in this study.
Pathway enrichment analysis
We used the functional annotation tool DAVID [45] for KEGG pathway enrichment and GO functional enrichment analysis. Significant functional modules were selected with a corrected p-value < 0.05.
CONCLUSIONS
In this study, we implemented a minimum-redundancy-maximum-relevance (mRMR) based transcriptional profile study to present a comprehensive view of the features in pancreatic cancer. We identified NHS, SCML2, LAMC2, S100P, COL17A1, AMIGO2, PTPRR, KPNA7 and KCNN4 as closely related genes to the disease. Some of them had been validated in vitro and/or in vivo. From the functional analysis of PPIs network, RNA polymerase II and growth factor function showed importance to this disease. In conclusion, our method provided solid and novel insights to this mortal disease, suggesting several genes and functions that worth further investigations.
Authors’ contributions
Shuhua Shen, Tuantuan Gui contributed equally to this paper.
ACKNOWLEDGMENTS
Thanks for Dr. Chao Li and Dr. Xiao Dong for helpful discussions.
CONFLICTS OF INTEREST
The authors declare no conflicts of interest with the contents of this article.
GRANT SUPPORT
This research was supported by National Natural Science Foundation of China (81503527), Postdoctoral Science Foundation (2016M601981) and Item of Zhejiang Provincial TCM Sci-tech Plan (2017ZA045)
REFERENCES
1. Chen W, Zheng R, Baade PD, Zhang S, Zeng H, Bray F, Jemal A, Yu XQ, He J. Cancer statistics in China, 2015. CA Cancer J Clin. 2016; 66:115–132.
2. Torre LA, Bray F, Siegel RL, Ferlay J, Lortet-Tieulent J, Jemal A. Global cancer statistics, 2012. CA Cancer J Clin. 2015; 65:87–108.
3. EUCAN. Pancreatic cancer. 2012.
4. UK CR. Pancreatic cancer survival statistics. 2015.
5. Lópezcasas PP, Lópezfernández LA. Gene-expression profiling in pancreatic cancer. Expert Rev Mol Diagn. 2010; 10:591–601.
6. Terris B, Blaveri E, Crnogoracjurcevic T, Jones M, Missiaglia E, Ruszniewski P, Sauvanet A, Lemoine NR. Characterization of gene expression profiles in intraductal papillary-mucinous tumors of the pancreas. Am J Pathol. 2002; 160:1745–1754.
7. Campagna D, Cope L, Lakkur SS, Henderson C, Laheru D, Iacobuzio-Donahue CA. Gene expression profiles associated with advanced pancreatic cancer. Int J Clin Exp Pathol. 2008; 1:32–43.
8. Bai J, Sata N, Nagai H. Gene expression analysis for predicting gemcitabine sensitivity in pancreatic cancer patients. HPB. 2006; 9:150.
9. Zhang Y, Ding C, Li T. Gene selection algorithm by combining reliefF and mRMR. BMC Genomics. 2008; 9:S27.
10. Cai Y, Huang T, Hu L, Shi X, Xie L, Li Y. Prediction of lysine ubiquitination with mRMR feature selection and analysis. Amino Acids. 2012; 42:1387.
11. Li BQ, Feng KY, Chen L, Huang T, Cai YD. Prediction of Protein-Protein Interaction Sites by Random Forest Algorithm with mRMR, IFS. PloS one. 2012; 7:e43927.
12. Ma C, Dong X, Li R, Liu L. A Computational Study Identifies HIV Progression-Related Genes Using mRMR and Shortest Path Tracing. PloS one. 2013; 8:e78057.
13. Peng H, Long F, Ding C. Feature selection based on mutual information: criteria of max-dependency, max-relevance, and min-redundancy. IEEE Trans Pattern Anal Mach Intell. 2005; 27:1226–1238.
14. Franceschini A, Szklarczyk D, Frankild S, Kuhn M, Simonovic M, Roth A, Lin J, Minguez P, Bork P, Von MC. STRING v9.1: protein-protein interaction networks, with increased coverage and integration. Nucleic Acids Res. 2012; 41:808–815.
15. Dijkstra EW. A Note on Two Problems in Connection with Graphs. Numerische Mathematics. 1959; 1:269--271.
16. Jäger H, Dreker T, Buck A, Giehl K, Gress T, Grissmer S. Blockage of intermediate-conductance Ca2+-activated K+ channels inhibit human pancreatic cancer cell growth in vitro. Mol Pharmacol. 2004; 65:630–638.
17. Kohno I, Katsumi K, Mori Y, Zhang L, Sakamoto A, Satoh H, Aburatani H. Functional antibodies targeting AMIGO-2 demonstrate in vivo efficacy in human pancreatic carcinoma xenograft models. Cancer Research. 2008; 68.
18. Laurila E, Vuorinen E, Savinainen K, Rauhala H, Kallioniemi A. KPNA7, a nuclear transport receptor, promotes malignant properties of pancreatic cancer cells in vitro. Experimental Cell Research. 2014; 322:159–167.
19. Mitsunaga S, Fujii S, Ishii G, Kinoshita T, Hasebe T, Aoyagi K, Sasaki H, Ochiai A. Nerve invasion distance is dependent on laminin γ2 in tumors of pancreatic cancer. Int J Cancer. 2010; 127:805–819.
20. Ohuchida K, Mizumoto K, Egami T, Yamaguchi H, Fujii K, Konomi H, Nagai E, Yamaguchi K, Tsuneyoshi M, Tanaka M. S100P is an early developmental marker of pancreatic carcinogenesis. Clin Cancer Res. 2006; 12:5411–5416.
21. Kosanam H, Prassas I, Chrystoja CC, Soleas I, Chan A, Dimitromanolakis A, Blasutig IM, Rückert F, Gruetzmann R, Pilarsky C. Laminin, gamma 2 (LAMC2): a promising new putative pancreatic cancer biomarker identified by proteomic analysis of pancreatic adenocarcinoma tissues. Mol Cell Proteomics. 2013; 12:2820–2832.
22. Logsdon CD, Simeone DM, Binkley C, Arumugam T, Greenson JK, Giordano TJ, Misek DE, Kuick R, Hanash S. Molecular profiling of pancreatic adenocarcinoma and chronic pancreatitis identifies multiple genes differentially regulated in pancreatic cancer. Cancer Research. 2003; 63:2649.
23. Geng Z, Schetter A, He P, Funamizu N, Gaedcke J, Ghadimi BM, Ried T, Hassan R, Yfantis HG, Dong HL. DPEP1 Inhibits Tumor Cell Invasiveness, Enhances Chemosensitivity and Predicts Clinical Outcome in Pancreatic Ductal Adenocarcinoma. PloS one. 2012; 7:e31507.
24. Patarroyo M, Tryggvason K, Virtanen I. Laminin isoforms in tumor invasion, angiogenesis and metastasis. Semin Cancer Biol. 2002; 12:197–207.
25. Graf J, Ogle RC, Robey FA, Sasaki M, Martin GR, Yamada Y, Kleinman HK. A pentapeptide from the laminin B1 chain mediates cell adhesion and binds the 67,000 laminin receptor. Biochemistry. 1987; 26:6896–6900.
26. Kubota Y, Kleinman HK, Martin GR, Lawley TJ. Role of laminin and basement membrane in the morphological differentiation of human endothelial cells into capillary-like structures. J Cell Biol. 1988; 107:1589–1598.
27. Takahashi S, Hasebe T, Oda T, Sasaki S, Kinoshita T, Konishi M, Ochiai T, Ochiai A. Cytoplasmic expression of laminin γ 2 chain correlates with postoperative hepatic metastasis and poor prognosis in patients with pancreatic ductal adenocarcinoma. Cancer 94: 1894–1901. Cancer. 2002; 94:1894–1901.
28. Douine B, Sirois F, Leveque J, Berger K, Bonnard C, Hoang T, Mezani S. Nerve invasion distance is dependent on laminin gamma2 in tumors of pancreatic cancer. Int J Cancer. 2010; 127:805–819.
29. Kligman D, Hilt DC. The S100 protein family. Trends Biochem Sci. 1988; 13:437–443.
30. Arumugam T, Simeone DM, Van GK, Logsdon CD. S100P promotes pancreatic cancer growth, survival, and invasion. CA Cancer J Clin. 2005; 11:5356–5364.
31. Sato N, Fukushima N, Matsubayashi H, Goggins M. Identification of maspin and S100P as novel hypomethylation targets in pancreatic cancer using global gene expression profiling. Oncogene. 2004; 23:1531.
32. Whiteman HJ, Weeks ME, Dowen SE, Barry S, Timms JF, Lemoine NR, Crnogorac-Jurcevic T. The role of S100P in the invasion of pancreatic cancer cells is mediated through cytoskeletal changes and regulation of cathepsin D. Cancer Res. 2007; 67:8633–8642.
33. UniProt. UniProtKB - Q86SJ2 (AMGO2_HUMAN). 2016.
34. Rabenau KE, O’Toole JM, Bassi R, Kotanides H, Witte L, Ludwig DL, Pereira DS. DEGA/AMIGO-2, a leucine-rich repeat family member, differentially expressed in human gastric adenocarcinoma: effects on ploidy, chromosomal stability, cell adhesion|[sol]|migration and tumorigenicity. 2004; 23:5056–5067.
35. Refseq. Homo sapiens potassium calcium-activated channel subfamily N member 4 (KCNN4), mRNA.
36. Hayashi M, Wang J, Hede SE, Novak I. An intermediate-conductance Ca2+-activated K+ channel is important for secretion in pancreatic duct cells. Am J Physiol Cell Physiol. 2012; 303:C151.
37. Ding C, Peng H. Minimum Redundancy Feature Selection from Microarray Gene Expression Data. Journal of Bioinformatics and Computational Biology. 2005; 3:185–205.
38. De JN, Papillon-Cavanagh S, Olsen C, El-Hachem N, Bontempi G, Haibe-Kains B. mRMRe: an R package for parallelized mRMR ensemble feature selection. Bioinformatics. 2013; 29:2365–2368.
39. Tao H, Cui WR, Hu LL, Feng KY, Li YX, Cai YD. Prediction of Pharmacological and Xenobiotic Responses to Drugs Based on Time Course Gene Expression Profiles. PloS one. 2009; 4:e8126.
40. Chou KC. Some remarks on protein attribute prediction and pseudo amino acid composition. J Theor Biol. 2011; 273:236–247.
41. Chou KC, Shen HB. Predicting Eukaryotic Protein Subcellular Location by Fusing Optimized Evidence-Theoretic K-Nearest Neighbor Classifiers. J Proteome Res. 2006; 5:1888–1897.
42. Chou KC, Zhang CT. Prediction of Protein Structural Classes. Crit Rev Biochem Mol Biol. 1995; 30:275–349.
43. Chou KC, Shen HB. Cell-PLoc: a package of Web servers for predicting subcellular localization of proteins in various organisms. Nat Protoc. 2008; 3:153–162.
44. Smoot ME, Ono K, Ruscheinski J, Wang PL, Ideker T. Cytoscape 2.8: new features for data integration and network visualization. Bioinformatics. 2011; 27:431–432.
45. Huang DW, Sherman BT, Lempicki RA. Bioinformatics enrichment tools: paths toward the comprehensive functional analysis of large gene lists. Nucleic Acids Res. 2009; 37:1–13.