
INTRODUCTION
Pancreatic ductal adenocarcinoma (PDAC) is an extremely lethal malignancy with a devastated prognosis whose five-year survival rate is less than 7% [1]. Most patients are diagnosed in late stage and resectable rate of the tumors is only 20%. This situation makes it almost impossible to observe the whole process of tumor genesis and development in clinical work, and therefore understanding of its pathological mechanism mainly depended on animal models. In past decades, scientists have exerted great efforts to establish various animal models for PDAC, which can be served as a cornerstone for establishing favorable platforms for the clinical diagnosis and therapy of PDAC patients [2, 3].
Among animal models, transplantation models, including subcutaneous xenograft (SX) and orthotopic xenograft (OX) models, are most widely used to investigate pathology, diagnosis and therapy for cancers. As highly advocated by researchers, OX models of carcinoma can simulate the growing environment and enable them to maintain the features of the primary tumor, thus being more patient-like models [4]. Furthermore, in some specific tumors like gallbladder cancer, the ascites generation, lymph node and liver metastasis can only be observed in OX models but not in SX models [5], indicating that OX models is superior to SX models. However, SX models are still widely used in scientific researches especially for pharmaceutical trails due to more facilitation of their establishing, monitoring and operating than OX models. Nowadays, in the face of the popularity of system biological studies including genomics, transcriptomics, proteomics especially metabonomics, there is an increasing demand to compare applicability of these two models at molecular level. Therefore, considering that most of previous researches focus on the differences of tumorous biological behaviors while the metabonomic differences generated by the methodological diversity of modeling are still unknown, we tried to evaluate the pros and cons of these two models in PDAC and get their metabonomic difference between OX and SX models by using NMR-based metabonomics methods, and further serve scientific researches like pathological and pharmaceutical experiments.
RESULTS
Metabolic profiles of serum and tissues from mice with PDAC
1H NMR spectra of serum and tissue provide the corresponding metabolic profiles of the mice. The characteristic metabonomic profiles of serum and tissue from SX and OX models induced by BxPC-3 and Panc-1 cells were demonstrated in the corresponding NMR spectra (Figure 1). The resonance assignments were performed based on the published articles [6, 7, 8], public [9] and in-house developed databases, and the corresponding metabolites were marked in NMR spectra in the form of serial numbers, which can be viewed in Table 1 for details. All xenograft models demonstrated the similar metabolic profiles in serum metabonomes especially those induced by the same pancreatic cancer cell line although some characterized metabolites could be identified from the controls such as the higher LDL and pyruvate concentrations and the lower glycerophosphorylcholine (GPC) concentrations in xenograft models than in controls (Top panel in Figure 1). Tissue metabonomes of the xenograft models showed the obviously different metabolic profiles from those of the controls (Bottom panel in Figure 1). Furthermore, orthotopic xenograft demonstrated distinct metabonomic variations from subcutaneous xenograft, and Panc-1 cell strain induced more obvious metabolic differences than BxPC-3 between OX and SX groups. However, the visual comparison cannot provide the detailed biological information for assessment of similarities and differences between SX and OX models, thus, multivariate statistical analysis could be helpful for such specific bio-information.
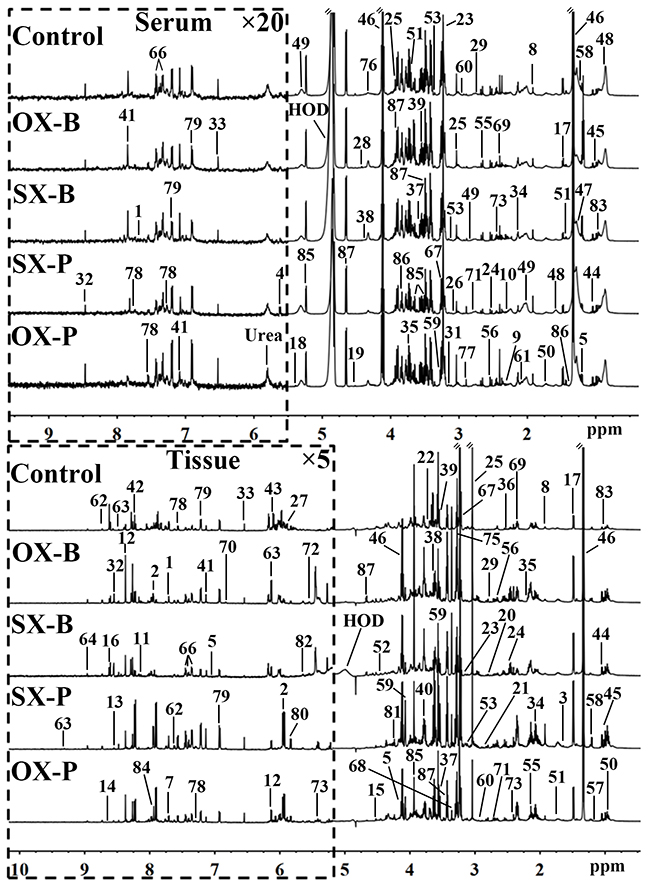
Figure 1: Representative 600 MHz 1H NMR spectra of the serum (top panel) and tissue (bottom panel) samples from control, orthotopic and subcutaneous xenograft (OX and SX) mouse models induced by Panc-1 (-P) and BxPC-3 (-B) cell strains. The spectral regions in the dashed boxes were magnified 20 (for serum) and 5 (for tissue) times for the purpose of clarity. Keys for the assignments of peaks were showed in Table 1.
Table 1: List of metabolites identified from NMR spectra of serum and tissue and the corresponding assignments
No. |
Abbr. |
Metabolites |
1H chemical shift |
Sample |
|---|---|---|---|---|
1 |
1-MH |
1-Methylhistidine |
7.08(sa), 7.69(s) |
S/Tb |
2 |
DU |
2-Deoxyuridine |
5.95(d), 7.87(d) |
T |
3 |
2-HB |
2-Hydroxybutyrate |
0.90(t), 1.70(m) |
T |
4 |
MBC |
2-Methylbutyroylcarnitine |
5.61(dd) |
S |
5 |
3-HB |
3-Hydroxybutyrate |
1.20(d), 2.31(dd), 2.41(dd), 4.16(m) |
S/T |
6 |
3-MH |
3-Methylhistinine |
7.03(s), 7.90(s) |
T |
7 |
MC |
5-Methylcytidine |
7.69(d) |
T |
8 |
Ace |
Acetate |
1.92(s) |
S/T |
9 |
AA |
Acetoacetate |
2.28(s) |
S |
10 |
Act |
Acetone |
2.23(s) |
S |
11 |
Ad |
Adenine |
8.11(s), 8.12(s) |
T |
12 |
Ade |
Adenosine |
4.29(dd), 4.44(dd), 6.11(d), 8.37(s) |
T |
13 |
ADP |
Adenosine diphosphate |
8.55(s) |
T |
14 |
PAP |
Adenosine 3′,5′-diphosphate |
8.59(s) |
T |
15 |
AMP |
Adenosine monophosphate |
4.52(d), 6.15(d), 8.27(s), 8.61(s) |
T |
16 |
ATP |
Adenosine triphosphate |
8.53(s) |
T |
17 |
Ala |
Alanine |
1.48(d) |
S/T |
18 |
All |
Allantoin |
5.39(s) |
S |
19 |
Asc |
Ascorbate |
4.52(d) |
S |
20 |
Asn |
Asparagine |
2.88(dd), 2.95(dd), 3.99(dd) |
T |
21 |
Asp |
Aspartate |
2.70(dd), 2.81(dd), 3.94(dd) |
T |
22 |
Bet |
Betaine |
3.27(s), 3.91(s) |
T |
23 |
Cho |
Choline |
3.21(s) |
S/T |
24 |
Ci |
Citrate |
2.53(d), 2.67(d), |
S/T |
25 |
Cr |
Creatine |
3.04(s), 3.93(s) |
S/T |
26 |
Cn |
Creatinine |
3.05(s), 4.06(s) |
S |
27 |
Cyd |
Cytidine |
5.87(d), 7.81(d) |
T |
28 |
DHA |
Dihydroxyacetone |
4.42(s) |
S |
29 |
DMA |
Dimethylamine |
2.72(s) |
S/T |
30 |
Eth |
Ethanol |
1.18(t), 3.61(q) |
S |
31 |
EA |
Ethanolamine |
3.15(t), 3.86(t) |
S/T |
32 |
For |
Formate |
8.46(s) |
S/T |
33 |
Fum |
Fumarate |
6.52(s) |
S/T |
34 |
Glu |
Glutamate |
2.08(m), 2.12(m), 2.35(m), 3.78(t) |
S/T |
35 |
Gln |
Glutamine |
2.14(m), 2.45(m), 3.78(t) |
S/T |
36 |
GSH |
Glutathione |
2.56(m), 2.99(m) |
T |
37 |
G |
Glycerol |
3.56(dd), 3.66(dd), 3.80(m) |
S/T |
38 |
GPC |
Glycerophosphorylcholine |
3.23(s), 3.68(m), 4.33(m) |
S/T |
39 |
Gly |
Glycine |
3.57(s) |
S/T |
40 |
GA |
Guanidoacetate |
3.80(s) |
T |
41 |
His |
Histidine |
7.05(s), 7.82(s) |
S/T |
42 |
HX |
Hypoxanthine |
8.20(s), 8.22(s) |
T |
43 |
Ino |
Inosine |
4.26(dd), 6.08(d), 8.25(s), 8.34(s) |
T |
44 |
IB |
Isobutyrate |
1.07(d) |
S/T |
45 |
Ile |
Isoleucine |
0.94(t), 1.01(d), 1.26(m) |
S/T |
46 |
Lac |
Lactate |
1.33(d), 4.11(q) |
S/T |
47 |
LDL |
Low density lipoprotein |
0.86(br), 1.28(br) |
S |
48 |
VLDL |
Very low density lipoprotein |
0.89(br), 1.30(br), 1.58(br) |
S |
49 |
L |
Lipid |
2.01(br), 2.23(br), 2.78(br), 5.31(br) |
S |
50 |
Leu |
Leucine |
0.96(t),1.70(m) |
S/T |
51 |
Lys |
Lysine |
1.46(m), 1.73(m), 1.91(m), 3.01(m), 3.76(t) |
S/T |
52 |
Mal |
Malate |
4.31(dd) |
T |
53 |
M |
Malonate |
3.12(s) |
S/T |
54 |
Mol |
Methanol |
3.36(s) |
S |
55 |
Met |
Methionine |
2.14(s), 2.65(t) |
S/T |
56 |
MA |
Methylamine |
2.61(s) |
S/T |
57 |
MIB |
Methylisobutyrate |
1.18(d) |
T |
58 |
MM |
Methylmalonate |
1.22(d), 3.12(q) |
S/T |
59 |
m-I |
myo-Inositol |
3.27(t), 3.56(dd), 3.62(t), 4.07(t) |
S |
60 |
DMG |
N,N-Dimethylglycine |
2.93(s) |
S/T |
61 |
NAG |
N-Acetyl-glycoprotein signals |
2.04(s) |
S |
62 |
NA |
Nicotinamide |
7.60(dd), 8.25(dd), 8.72(dd), 8.94(d) |
T |
63 |
NAD |
Nicotinamide adenine dinucleotide |
4.37(m), 4.42(m), 4.49(m), 4.51(m), 6.04(d), |
T |
64 |
NMA |
N-Methylnicotinamide |
4.49(s), 8.90(d), 8.98(d), 9.30(s) |
T |
65 |
Pan |
Pantothenate |
0.84(s), 0.90(s) |
T |
66 |
Phe |
Phenylalanine |
4.00(m), 7.33(d), 7.37(t), 7.43(m) |
S/T |
67 |
PC |
Phosphocholine |
3.22(s), 4.18(m) |
S/T |
68 |
Pro |
Proline |
3.33(m) |
T |
69 |
Py |
Pyruvate |
2.39(s) |
S/T |
70 |
Qu |
Quinone |
6.81(s) |
T |
71 |
Sar |
Sarcosine |
2.72(s), 3.60(s) |
S/T |
72 |
Sph |
Sphignosine |
5.52(dd), 5.56(dd), 5.74(dd) |
T |
73 |
Sur |
Surcose |
5.43(s) |
T |
74 |
Suc |
Succinate |
2.41(s) |
S/T |
75 |
Tau |
Taurine |
3.27(t), 3.43(t) |
T |
76 |
Thr |
Threonine |
1.33(d), 3.59(dd), 4.26(m) |
S |
77 |
TMA |
Trimethylamine |
2.89(s) |
S |
78 |
Trp |
Tryptophan |
7.28(m), 7.30(s), 7.53(d), 7.73(d) |
S/T |
79 |
Tyr |
Tyrosine |
6.91(d), 7.20(d) |
S/T |
80 |
Ura |
Uracil |
5.80(d), 7.55(d) |
T |
81 |
Ud |
Uridine |
4.24(t), 4.36(t), 5.91(d), 7.89(d) |
T |
82 |
UDG |
Uridinediphosphate glucose |
5.61(dd), 5.97(m), 7.96(d) |
T |
83 |
Val |
Valine |
0.99(d), 1.04(d), 2.28(m) |
S/T |
84 |
Xan |
Xanthine |
7.91(s) |
T |
85 |
α-Glc |
α-Glucose |
3.42(t), 3.54(dd), 3.71(t), 3.73(t), 3.84(m), 5.24(d) |
S/T |
86 |
HIV |
α-Hydroxyisovalerate |
1.36(s) |
S |
87 |
β-Glc |
β-Glucose |
3.25(dd), 3.41(t), 3.46(dd), 3.49(t), 3.90(dd), 4.65(d) |
S/T |
aMultiplicity: s: singlet; d: doublet; t: triplet; q: quartet; dd: doublet of doublets; m: multiplet; br: broad resonance
bS: serum; T: tissue.
Metabolic characteristics of SX and OX models in serum metabonomes
To investigate the metabonomic difference between SX and OX mouse models of PDAC and identify their metabolic characteristics from the controls, PCA and PLS-DA were performed to give an overview on the NMR data of serum from PDAC groups induced by BxPC-3 and Panc-1 cells and the control mice (Figure 2A1 and 2A2). PCA scores plot displayed the metabolic differences between control and BxPC-3 and Panc-1 cell induced PDAC groups but obvious overlapping between SX and OX groups (Figure 2A1), indicating that the serum metabonomes of SX and OX models were quite similar and difficult to be distinguished. PLS-DA highlighted the distinctive separations between controls and xenograft groups but the evident overlapping between SX and OX groups was still kept, which implied the similar metabolic phenotype between SX and OX groups in serum. The metabonomic similarity in serum between the two models may be due to the fact that serum metabonomes are also the comprehensive reflection from other organs in the body besides the specific tumor-bearing organ (pancreas in this study), that is, the metabolic characteristics of the tumor tissues could be demonstrated in the animal serum wherever the tumor locates. Judging from this aspect, subcutaneous xenograft and orthotopic xenograft models are metabolically equivalent.
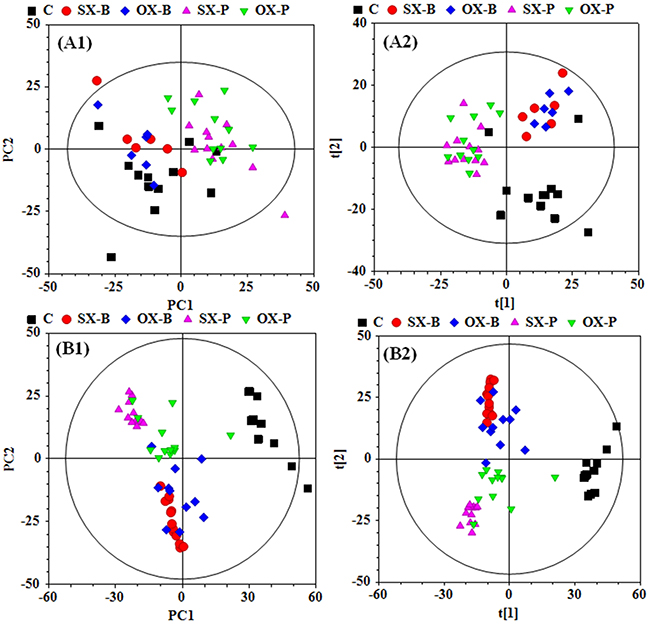
Figure 2: PCA (A1 and B1) and PLS-DA (A2 and B2) scores plots based on the 1H NMR data of the serum (A) and tissue (B) samples from the corresponding mouse groups. C: control groups; -B: BxPC-3 cell induced; -P: Panc-1 cell induced; SX: subcutaneous xenograft group; OX: orthotopic xenograft group.
In order to identify the metabolic similarity between SX and OX models in serum metabonomes, the pair-comparisons were conducted in the subgroups in both BxPC-3 and Panc-1 groups by using OPLS-DA (Supplementary Figure 1 in the supplemental materials). The undesirable fit and prediction parameters (R2 and Q2) in the OPLS-DA models demonstrated insignificant differences between SX and OX groups induced by both BxPC-3 and Panc-1 cells, and permutation test of models and the corresponding probability (p-values) via CV-ANOVA also confirmed the metabolic similarity of serum between these two modeling methods.
To understand the metabonomic characteristics of SX and OX models and identify the dominantly differential metabolites of the xenograft groups from the controls, the pair-comparisons by using OPLS-DA incorporating Student’s t test were conducted on the NMR data of serum from in BxPC-3 and Panc-1 groups. And the results were visually displayed in volcano plots (Figure 3, where the threshold was defined as p-value of t- test less than 0.05 and a certain correlation coefficient |r|>0.755 for BxPC-3 groups and 0.602 for other comparisons), and the corresponding information was listed in Table 2. We noticed that SX and OX models both in BxPC-3 and Panc-1 cell groups demonstrated similar metabonomic characteristics in serum, where the differential metabolites from SX and OX share the same variation trends and no one showed contrary variation trend (Table 2). Based on KEGG analysis, the metabolic pathways involving the dominant metabolites from BxPC-3 and Panc-1 cell induced PDAC groups were similar and most of pathways could be closely associated with the specific mechanism of tumorigenesis and tumor development (Figure 4). The PDAC mainly involved in the abnormal pathway in central carbon metabolism in cancer, metabolism and biosynthesis of amino acids and carboxylic acids, and protein digestion and absorption. As may be expected, no obvious metabonomic difference could be identified in the serum between SX and OX models by comparing the significantly differential metabolites and corresponding pathways. However, the non-significant metabonomic difference in serum may also be due to the limited amount of samples in present study and the specific bioinformation of metabonomic difference should be further investigated to get a deep insight.
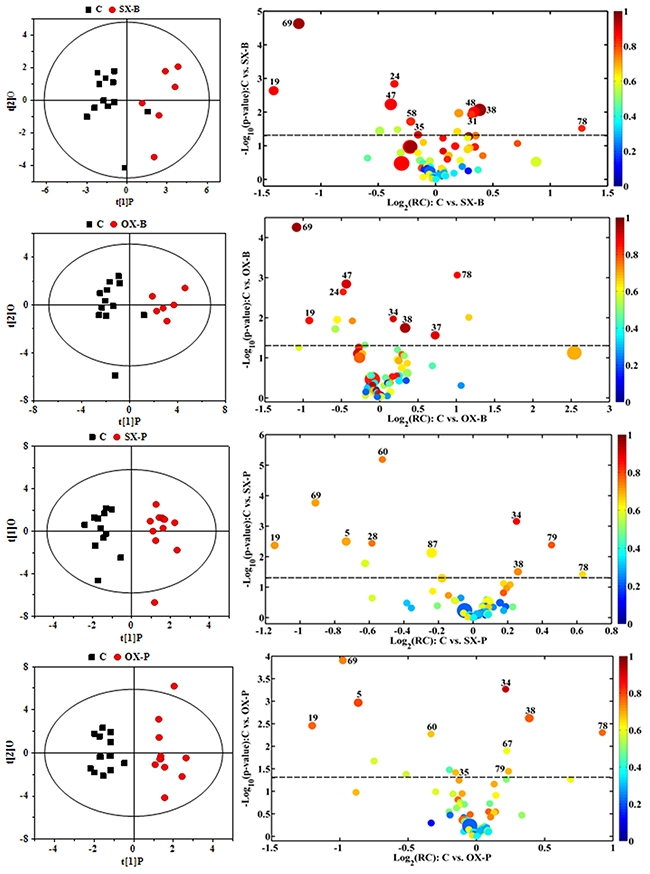
Figure 3: OPLS-DA scores plots (left panels) and the corresponding volcano plots (right panels) derived from 1H NMR data of the serum from xenograft groups and their controls. C: control groups; B: BxPC-3 cell induced; P: Panc-1 cell induced; SX: subcutaneous xenograft group; OX: orthotopic xenograft group. The marked circles in the color volcano plots represent the metabolites with statistically significant difference. Metabolite numbering is accordance with that as listed in Table 1.
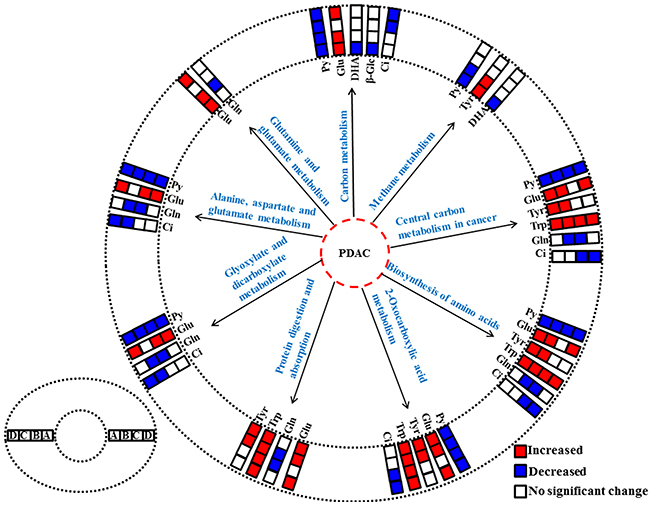
Figure 4: The abnormal metabolic pathways involved in pancreatic ductal adenocarcinoma based on characteristic metabolites in serum metabonomes. (A), Panc-1 cell induced subcutaneous xenograft model; (B), Panc-1 cell induced orthotopic xenograft model; (C), BxPC-3 cell induced subcutaneous xenograft model; (D), BxPC-3 cell induced orthotopic xenograft model. Abbreviations for the metabolites are listed in Table 1.
Table 2: The significantly differential metabolites in serum between xenograft groups and their controls
Metabolites |
C-SX-Pa |
C-OX-P |
C-SX-B |
C-OX-B |
||||
|---|---|---|---|---|---|---|---|---|
R2X= 32.6% |
38.9% |
37.6% |
38.1% |
|||||
RCb |
Rc |
RC |
R |
RC |
R |
RC |
R |
|
Tryptophan |
0.029 |
0.656 |
0.050 |
0.768 |
0.45 |
0.835 |
0.29 |
0.874 |
Tyrosine |
0.062 |
0.784 |
0.032 |
0.692 |
/ |
/ |
/ |
/ |
N,N-Dimethylglycine |
-0.071 |
-0.747 |
-0.047 |
-0.677 |
/ |
/ |
/ |
/ |
Dihydroxyacetone |
-0.091 |
-0.757 |
/ |
/ |
/ |
/ |
/ |
/ |
Glutamate |
0.33 |
0.885 |
0.27 |
0.926 |
/ |
/ |
1.35 |
0.906 |
Ascorbate |
-0.82 |
-0.720 |
-0.80 |
-0.769 |
-5.92 |
-0.880 |
-4.22 |
-0.862 |
Pyruvate |
-1.08 |
-0.711 |
-1.13 |
-0.744 |
-10.47 |
-0.962 |
-8.80 |
-0.961 |
Glycerophosphorylcholine |
1.40 |
0.735 |
2.23 |
0.778 |
15.37 |
0.966 |
12.35 |
0.952 |
3-Hydroxybutyrate |
-2.08 |
-0.709 |
-2.20 |
-0.803 |
/ |
/ |
/ |
/ |
β-Glucose |
-3.87 |
-0.633 |
/ |
/ |
/ |
/ |
/ |
/ |
Phosphocholine |
/ |
/ |
0.45 |
0.609 |
/ |
/ |
/ |
/ |
Methylmalonate |
/ |
/ |
/ |
/ |
-3.37 |
-0.826 |
/ |
/ |
Citrate |
/ |
/ |
/ |
/ |
-1.13 |
-0.862 |
-1.20 |
-0.843 |
Glutamine |
/ |
/ |
-0.21 |
-0.684 |
-1.94 |
-0.904 |
/ |
/ |
Glycerol |
/ |
/ |
/ |
/ |
/ |
/ |
8.48 |
0.904 |
LDL |
/ |
/ |
/ |
/ |
-12.23 |
-0.879 |
-11.89 |
-0.912 |
Ethanolamine |
/ |
/ |
/ |
/ |
1.66 |
0.825 |
/ |
/ |
VLDL |
/ |
/ |
/ |
/ |
9.45 |
0.881 |
/ |
/ |
aC: control groups; SX-B and OX-B: BxPC-3 cell induced subcutaneous and orthotopic xenograft groups; SX-P and OX-P: Panc-1 cell induced subcutaneous and orthotopic xenograft groups.
bRC: relative concentration according to quantified NMR spectroscopy. Positive and negative indicate the metabolites that are more abundant in the xenograft groups or in the control groups, respectively.
cR: correlation coefficients. Positive and negative indicate the metabolites that are more abundant in the xenograft groups or in the control groups, respectively. “/” means no significant difference.
Metabolic characteristics of SX and OX models in tissue metabonomes
To comprehensively assess the metabonomic difference between SX and OX models, PCA and PLS-DA were also performed on the NMR data derived from aqueous extract of BxPC-3 and Panc-1 tissues. Unlike the results in serum, obvious metabonomic distinctions were demonstrated in tissues not only between BxPC-3, Panc-1 and the control groups but also between SX and OX groups in their PCA scores plot (Figure 2B1), and PLS-DA highlighted their distinctive separations (Figure 2B2). Furthermore, the obvious metabonomic differences were also observed between BxPC-3 and Panc-1 groups in the tissue metabonomes. It indicated that the model (SX and OX)- and cell strain (BxPC-3 and Panc-1)-specific metabonomic characteristics were induced in tissue.
In order to understand the detailed metabolic differences between SX and OX models and identify the differential metabolites in tumor tissues, OPLS-DA was performed on their NMR data from both BxPC-3 and Panc-1 cells induced PDAC groups (Figure 5). With the favorable model parameters R2 and Q2 (Table 3), the pattern recognition models can distinguish the tumor tissue from SX and OX model with considerable validity and efficiency, and the permutation plots (Supplementary Figure 2) and p-values via CV-ANOVA also confirmed the obvious metabolic differences between SX and OX groups. The metabolites, which had statistically significant difference in t-test (p<0.01) and correlation coefficients more than 0.735, were considered to be most valuable components for further investigation (Table 3). Based on the comparison of SX and OX in BxPC-3 groups, the higher levels of nicotinamide, uracil, uridine, lysine, adenosine, hypoxanthine, ethanolamine, choline and lower levels of adenosine monophosphate in OX tissues dominantly contributed to the metabonomic difference between them. Meanwhile, in Panc-1 groups, the lower levels of asparagine, tyrosine, lysine, valine, isoleucine, leucine, 2-hydroxybutyrate, acetate, proline and alanine accompanied by the higher levels of uridine diphosphate glucose, surcose, adenosine, 1-methylhistidine, β-glucose, α-glucose, malate and GPC in OX tissues were also identified as the dominantly differential metabolites. In terms of pathways (Figure 6), in the BxPC-3 groups, ABC-transporter, glycerophospholipid and purine metabolism were identified as discriminatory cancer-associated metabolic pathway between SX and OX models while more pathways, including central carbon metabolism in cancer, biosynthesis of aminoacyl-tRNA and amino acids, 2-oxocarboxylic acid metabolism and protein digestion and absorption, were identified in Panc-1 groups. According to these discriminatory metabolites and metabolic pathways, the metabolic discrimination between SX and OX models concentrated on lipid and nucleotide metabolisms in Bxpc-3 group, and energy, lipid, nucleotide and amino acid metabolisms in Panc-1 group.
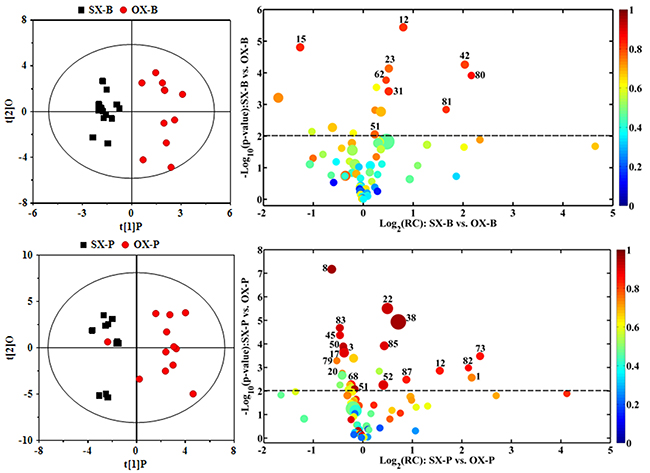
Figure 5: OPLS-DA scores plots (left panels) and the corresponding volcano plots (right panels) derived from 1H NMR data of the tissue samples from BxPC-3 (-B) and Panc-1 (-P) cell induced subcutaneous(SX-) and orthotopic (OX-)xenograft groups. The marked circles in the color volcano plots represent the metabolites with statistically significant difference. Metabolite numbering is accordance with that as listed in Table 1.
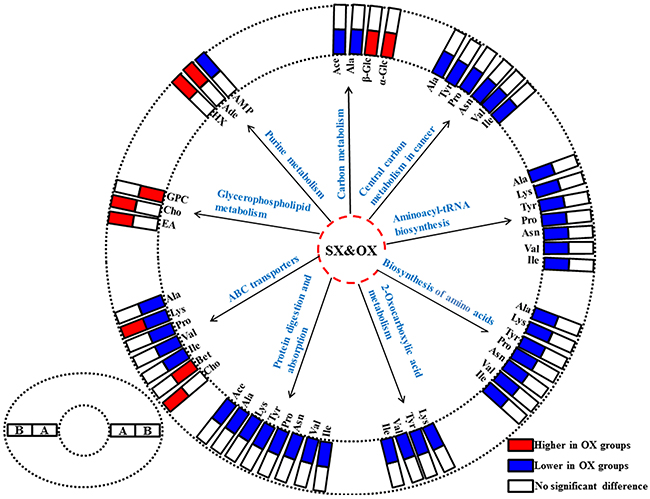
Figure 6: The differentiated metabolic pathways between subcutaneous and orthotopic xenograft groups based on the dominant metabolites in tissue metabonomes. The pair-comparisons: (A), subcutaneous and orthotopic xenograft groups induced by Panc-1 cell; (B), subcutaneous and orthotopic xenograft groups induced by BxPC-3 cell. Abbreviations for the metabolites are listed in Table 1.
Table 3: The significantly differential metabolites in tissues between subcutaneous and orthotopic xenograft groups
Metabolites |
SX-P&OX-Pa |
SX-B&OX-Ba |
||
|---|---|---|---|---|
R2X=55.9%, R2Y=0.749, Q2=0.632, p=5.21×10⁻⁴ |
R2X=32.6%, R2Y=0.902, Q2=0.643, p=3.96×10⁻⁴ |
|||
RCb |
Rc |
RC |
R |
|
Nicotinamide |
/ |
/ |
0.36 |
0.807 |
Uracil |
/ |
/ |
1.46 |
0.863 |
Uridine |
/ |
/ |
1.80 |
0.823 |
Lysine |
-0.50 |
-0.953 |
2.55 |
0.774 |
Adenosine |
0.74 |
0.848 |
2.59 |
0.822 |
Hypoxanthine |
/ |
/ |
3.34 |
0.804 |
Adenosine monophosphate |
/ |
/ |
-4.08 |
-0.833 |
Ethanolamine |
/ |
/ |
4.64 |
0.825 |
Choline |
/ |
/ |
5.24 |
0.766 |
Uridinediphosphate glucose |
0.19 |
0.868 |
/ |
/ |
Asparagine |
-0.26 |
-0.745 |
/ |
/ |
Tyrosine |
-0.28 |
-0.749 |
/ |
/ |
Valine |
-0.53 |
-0.915 |
/ |
/ |
Surcose |
0.58 |
0.857 |
/ |
/ |
Isoleucine |
-0.69 |
-0.897 |
/ |
/ |
Leucine |
-0.86 |
-0.931 |
/ |
/ |
1-Methylhistidine |
0.87 |
0.739 |
/ |
/ |
β-Glucose |
0.90 |
0.846 |
/ |
/ |
α-Glucose |
1.30 |
0.905 |
/ |
/ |
2-Hydroxybutyrate |
-1.54 |
-0.942 |
/ |
/ |
Acetate |
-1.56 |
-0.961 |
/ |
/ |
Proline |
-1.62 |
-0.859 |
/ |
/ |
Malate |
2.14 |
0.903 |
/ |
/ |
Alanine |
-2.18 |
-0.899 |
/ |
/ |
Betaine |
3.33 |
0.923 |
/ |
/ |
Glycerophosphocholine |
6.74 |
0.964 |
/ |
/ |
aSX-B and OX-B: BxPC-3 cell induced subcutaneous and orthotopic xenograft groups; SX-P and OX-P: Panc-1 cell induced subcutaneous and orthotopic xenograft groups.
bRC: relative concentration according to quantified NMR spectroscopy. Positive and negative indicate the metabolites that are more abundant in the orthotopic and subcutaneous xenograft groups, respectively.
cR: correlation coefficients. Positive and negative indicate the metabolites that are more abundant in the orthotopic and subcutaneous xenograft groups, respectively. “/” means no significant difference.
DISCUSSION
In this study, in order to be more convincing of metabonomic comparison, we chose Panc-1 and BxPC-3 cell strains to establish the experimental groups. With common suppressor genes such as P53 and P16, Panc-1 have a mutant Kras gene (KrasG12D) while BxPC-3 have a wild type Kras gene [10], which related with several crucial metabolisms for PDAC growth [11, 12]. Thus, these models could cover most of metabolic characteristics of PDAC strains used in scientific researches, providing a comprehensive assessment of metabonomic discrimination between SX and OX models. The average length, width and volume of tumors (calculated based on universal formula: length*width*width/2) in SX-B was 8.63±2.27 mm, 6.94±1.26 mm and 219.92 mm3, respectively. The average length, width and volume of tumors in OX-B was 7.35±1.19 mm, 6.53±0.98 mm and 166.92 mm3, respectively. For Panc-1, these parameters were 7.80±2.01 mm, 6.92±0.94 mm, 196.44±91.80 mm3 in SX-P and 7.34±1.41, 6.20±0.95, 154.44±74.25 mm3. No significant differences were observed for these pair-comparing parameters from SX and OX models. Therefore, the metabonomic difference between SX and OX models may not be attributed to the difference in size of tumors. In our study, in order to eliminate metabolic impact from the methodological difference of operations between OX and SX models, all groups were operated with almost the same surgical operations. Although these procedures in our study differ with conventional modeling methods, the perfect match of all groups could provide more precise metabonomic discrimination only caused by the methodological difference.
According to results of multivariate statistical analyses, the metabonomic differences were indistinctive in serum but significant in tissue, therefore we focus on the bioinformation contained in metabonomic difference of tissue between OX and SX models.
ABC-transporters are a large family of transmembrane proteins transporting nutrients into cells, and their abnormality has been associated with many diseases and cancers [13, 14]. Furthermore, previous literatures have demonstrated that ABC-transporters play an important role not only in chemoresistance of PDAC [15] but also connect with the initiation and progression of PDAC, further served as predictors for poor prognosis [16, 17]. As the unique role of ABC-transporters in PDAC oncobiology, the difference of ABC-transporters metabolism may partly account for biobehavioral discriminations between SX and OX models such as ascites generation, lymph node and liver metastases. It also implied that OX and SX models of PDAC would be unequivalent for pharmaceutical and clinical trials for chemical agents.
According to previous studies, the alteration of glycerophospholipid metabolism, characterized by increase of choline and phosphocholine (PC), is a critical aspect of tumor metabolism [18, 19, 20, 21]]. Besides generating more substrates for cell proliferation, the glycerophosphodiesterase (EDI3)-mediated choline glycerophospholipid metabolism can also control tumor cell migration via PKC signaling and module cellular signaling through down-stream products [22]. However, the changes of the specific metabolites involved in glycerophospholipid metabolism including GPC, PC and choline are not quite consistent in the previous studies on PDAC [23], which may be due to the differences in experimental models and comparison objectives. The contradictory results confuse us to give a specific elucidation about our finding. However, the difference of choline and GPC concentration between SX and OX models both in Bxpc-3 and Panc-1 groups strongly indicated that SX and OX models were unequivalent in the tumor-associated glycerophospholipid metabolism.
As one of the major component in nucleotide metabolism, purine metabolism was highly disturbed in tumor metabolism. In tumor cells, the pyruvate kinase M2 is often in less active form [24, 25, 26], followed by up-stream substrates of pyruvate accumulation and enhanced synthesis of ribose-5-phosphate and nucleic acid [27]. In addition, purine metabolism plays key roles in cell signaling and tumor immunology [28]. In extracellular microenvironment, ATP and its sequential hydrolyzed product, adenosine, can act on nucleotide receptors P2 and adenosine receptors P1 respectively, which are expressed by cancer cell and infiltrating immune cells. Depending on different condition, ATP and adenosine can promote through direct activation and immunosuppression, or inhibit cancer growth through immunoactivation [29, 30, 31, 32]]. Thus, the purinergic signaling pathways were significantly different between SX and OX models, which were indicated by the difference of adenosine and AMP concentration in our study. This difference may lead to erroneous assessment to chemotherapeutic efficacy of specific anticancer agents such as mitoxantrone and oxaliplatin which owe their anticancer effects to the ability of triggering an excessive anticancer immune response [33].
The difference of carbon metabolism between OX and SX models could definitely reflect the heterogeneity of many enzymes and receptors targeted as the potential chemotherapeutic sites, which may result in totally different outcome of pharmaceutical and clinical trials [34]. In our study, the metabolic differences of amino acids involved in carbon metabolism were quite notable between SX and OX models in Panc-1 group. Relative to SX model, the consistent low level of branched chain amino acids and tyrosine in OX model tissue implied that the transporting function of amino acids was significantly decreased, which may related with the L-type amino acid transporter (LAT1), the most common transporter for essential amino acids delivery. By now, several researches have demonstrated that overexpression of LAT1 can stimulate cancer growth via mTOR pathways and be closely related with poor prognosis of several cancers [35, 36, 37]. In return, depressing LAT1 can also inhibit the tumor cell growth [38]. In addition, the low level of alanine, lysine, asparagine and proline in OX models may be due to a relatively weak ability to synthesize and uptake non-essential amino acids (NEAAs), or abundant consuming caused by rapidly proliferation of tumor. Nowadays, NEAAs are explicitly identified as key players in development of tumor including PDAC [39]. For instance, proline plays a special role in linkage between the metabolism and epigenetics through modulating intermediates of epigenetic regulation [40]. Furthermore, a recent research uncovered a unique role of autophagic alanine secretion in energy metabolism through tricarboxylic acid cycle (TCA) efflux in PDAC, which may even outcompete glycolysis and glutaminolysis [41]. However, the specific mechanism causing metabolic difference between SX and OX models is yet to determine and further investigation will be needed to get a deep insight.
The particular reasons for metabolic difference between SX and OX models still remain unclear. However, since the main methodological difference between these models is the position of tumor implantation, we hypothesize that the tumor microenvironment may give the most important contribution to the metabonomic difference. As demonstrated by previous researches, the tumor microenvironment could impose a great influence on the fibrosis, invasion and metastasis of pancreatic cancer [42]. As the predominant cell type of tumor microenvironment, pancreatic stellate cells (PaSCs) play a key role in the intimate interaction between PDAC and tumor microenvironment [43, 44]. Recently, an important metabolic pathway was uncovered in PDAC. In vitro, PaSCs could secrete alanine through autophagy to fuel the Krebs cycle rather than glycolysis to support tumor metabolism [41]. The intermediates of TCA were not only depleted through oxidative phosphorylation to generate ATP but also acted as building blocks for biosynthesis of fatty acid and NEAAs. Thus, although the role in tumor metabolism of PDAC has yet to be completely understood, the existence of PaSCs could undoubtedly trigger significant metabolic difference between OX and SX models. However, this hypothesis may need further research to be confirmed and improved.
Our study demonstrated that SX models are not equivalent to OX ones. Although subcutaneous transplantation offers a simple, inexpensive, reproducible and quantifiable advantage, it displayed its inherent limitations, i. e. it does not accord with the biological behaviors and tumor microenvironment of PDAC. And orthotopic implantation may be more favorable to simulate PDAC in patients due to their tumorigenesis similarity.
CONCLUSION
In this pancreatic cancer-related study, an obvious metabonomic difference was demonstrated between SX and OX animal models in tissue samples by using NMR-based strategy. The metabonomic differences were mainly associated with ABC transporters, glycerophospholipid metabolism, purine metabolism and central carbon metabolism in cancer and may be attributed to the difference of tumor microenvironment caused by different location of implantation. These findings indicated that the implantation of PDAC cell subcutaneously or in other organ cannot simulate the pathophysiological and system-biological features of PDAC as well as the OX models. OX animal models should be more favorable for cancer involved scientific researches, especially for the pharmacodynamical and pathophysiological experiments.
MATERIALS AND METHODS
Cell culture and animal modeling
Panc-1 and BxPC-3 cell strains were purchased from Shanghai Institute of Cell Biology and incubated with RPMI1640 supplemented with 10% fetal bovine serum (Gibco, Thermo Fisher Scientific, Shanghai, China) in cell incubator (3110, Thermo Scientific) with a circumstance of 37 °C and 5% CO2. BALB/c nude mice (male, 4-6 weeks, weighing 20-24 g) (NO: SCXK (HU) 2012-0002) were purchased from Slac laboratory animals Co., Ltd (Shanghai, China) and fed for 1 weeks under a standard laboratory conditions in Fujian Medical University Animals Center (Fuzhou, china) for acclimatization before operations.
The protocol of this study was in accordance with the principles of Guide for the Care and Use of Laboratory Animals [45] and approved by the ethical committee of Fujian Medical University Union Hospital. After a three-day cell culture, the culture flasks of Panc-1 and BxPC-3 cells were digested with 0.125% trypsogen (Gibco, Thermo Fisher Scientific, Shanghai, China), followed by washing for three times with phosphate buffered saline (PBS, Hyclone, GE Healthcare, Logan, Utah, US), and consequently resuspended in PBS (1×10⁶ cells suspended in 100 μL of PBS). Then, the cell suspensions of Panc-1 and BxPC-3 were subcutaneously injected into the right axilla of a mouse respectively. After a month of feeding, the subcutaneous tumors were harvested and disintegrated into 1-mm3 particles for transplantation.
The operation of OX-P and OX-B groups started with a horizontal incision inferior to left costal margin and exposed the body and tail of pancreas. Then, one Panc-1 or BxPC-3 particle was implanted on the surface of pancreas for each mouse and fixed with 1 μL of albumin glue (Compont, Compont pharmaceutical Science & Technology Co. Ltd., Beijing, China). Meanwhile, 1 mL of saline was injected subcutaneously into the back of mice. Reversely, the SX-P and SX-B groups were injected subcutaneously into the back of the mice with a Panc-1 or BxPC-3 particle by using a 16-gauge syringe, respectively, and followed by a surgical exploration of pancreas with a fixation of 1 μL albumin glue but without particle implantation. In present study, 12 and 15 BALB/c mice were prepared for establishment of SX and OX models respectively (See the representative images of successful establishment of models as displayed in Supplementary Figure 3A-C in the supplemental materials). For Bxpc-3 cell strain, the successful percentage of SX models was 100% (12/12) while 73.33% (11/15) in OX models; For Panc-1 cell strain, the successful percentage of SX models was 91.67% (11/12) while 80% (12/15) in OX models. To be completely comparative, the control group (n=12) was operated with subcutaneously injection of saline and surgical exploration of pancreas without cell implantation.
Sample preparation and NMR spectroscopy for serum and tissue from mice
Four weeks after operations, all mice were sacrificed under continuous airway-anesthesia for sample collection. As described in our previous study [46], before mice’s execution, at least 800 μL of blood was collected in 1.5-mL EP tube with a 30-60 min standing, followed by a 10-min centrifugation at 2,000 g for serum preparation. After blood collection, the tumor tissues were immediately collected. To eliminate the contamination of these tissues, the tumors were disposed with en bloc resection. Then, the infiltrated and adherent tissues around the tumor including tumor capsular, pancreas, skin and muscle were entirely stripped until leaving pure tumor tissues characterized with a homogeneous, hoary and solid mass. Sequentially, these tumor tissues were rapidly divided into two parts, one for histological analysis (Figs. S3D-I in the supplemental materials) and another one for 1H NMR analyses. All samples were snap frozen with liquid nitrogen and stored at -80 °C for NMR spectroscopy. Unfortunately, some biosamples were not available due to the misconducted storing methods. Finally, there are only 6 serum samples remaining in SX-B and OX-B groups. Tissue were extracted with conventional methanol-chloroform extraction method as described in our previous report [47], and the serum and tissue samples were prepared accordingly for NMR detection.
All of the serum and tissue samples were analyzed randomly on a Bruker AscendTM NMR spectrometer (Bruker Corporation, Karlsruhe, Germany) at 600.13 MHz proton frequency and 295 K. For serum samples, 1H NMR spectra were acquired by using the water-suppressed Carr-Purcell-Meiboom-Gill (CPMG, [RD-90°-(τ-180°-τ)n-ACQ]) pulse sequence with a spectral width of 12 KHz, an acquisition time of 2.73 s, a relaxation delay of 4 s, a scan accumulation of 16 times, and a data point of 32 K. For tissue samples, the detection was performed with the pulse sequence of nuclear Overhauser effect spectroscopy plus water suppression (NOESYPR1D, [RD-90°-t1-90°-tm-90°-ACQ]) with a spectral width of 12 KHz, an acquisition time of 2.66 s, a relaxation delay of 4 s, a scan accumulation of 16 times, t1 of 4 μs, a data point of 32 K and a mixing time of 100 ms.
NMR spectral processing
All free induction decays (FIDs) were multiplied by an exponential weighting function equivalent to a line-broadening of 0.3 Hz for tissue samples and 0.5 Hz for serum samples to increase the signal-to-noise ratio. Then, by using MestReNova (V9.0, Mestrelab Research, Santiago de Compostela, Galicia, Spain), all spectra were deposed with Fourier transformation and manual corrections for phase and baseline. In serum samples, the chemical shift was referenced to the double peaks of endogenous lactate at δ1.33, and the spectral regions of δ4.67-δ5.22 and δ5.70-δ6.00 were removed to eliminate the interference of residual aquatic and ureal signals. The remainder spectral regions (δ0.6-8.6) were integrally segmented into discrete regions of 0.002 ppm. In tissue samples, the chemical shift was referenced to TSP at δ0.00 and the spectral regions of δ4.7-5.15 and δ3.34-3.39 were eliminated for aforementioned reasons, followed by segmentation with 0.004 ppm interval in spectral region of δ0.7-10.0. All the disposed data were normalized and homogenized for multivariate statistical analysis.
Univariate and multivariate statistical analyses
To get insight into the bioinformation contained in NMR spectra, all processed spectral data were analyzed by using multivariate statistical analysis with assistance of SIMCA-P+ (V14.0, Umetrics AB, Umea, Sweden). These analyses could simplify the complex information into several dominant components to demonstrate explicitly the metabonomic difference between groups. To give an overview of metabonomic profile from control, principal component analysis (PCA) and partial least squares discriminant analysis (PLS-DA) were conducted with mean center scaling and unit variance scaling, respectively. Then, for better understanding of the specific metabonomic difference between all subgroups in BxPC-3 and Panc-1 groups, the pair comparisons were performed and validated with 10-fold cross validation and permutation test with the first two principal components including a predictive component and an orthogonal component by using PLS-DA with orthogonal signal correction (OPLS-DA) with Parato scaling. The parameter R2 and Q2, derived from cross validation and permutation test, represented the degree of modeling fitting and the predictive ability, and the p-values from CV-ANOVA demonstrated the significance of the metabolic differences, thus to be critical for validation of statistical analyses and pattern recognition.
The metabolites contributed to the metabonomic difference in pair-comparisons were marked and color-coded based on the corresponding correlation coefficients in OPLS-DA loading volcano plots, where a hot color corresponds to the significant difference between classes while a cool color corresponds to no significant differences. In addition, the relative concentrations of metabolites through calculating the integral area of the corresponding signals were compared and statistical analyzed with Student’s t test for better reliability of characteristic metabolites’ screening, which represented as the X (indicated as −log2 of fold changes in concentration of differential metabolites) and Y (indicated as −log10 of t-test statistically p-values) axis in the loading volcano plots, respectively. The p-values for statistically significant difference were set as less than 0.05 for serum comparison and 0.01 for tissue comparison, respectively. Positive log2 value of fold changes indicate higher concentration of metabolites in the xenograft groups than in controls (for the serum comparison) or in subcutaneous xenograft groups (for the tissue comparison); negative values indicate higher concentrations of metabolites in control (for the serum comparison) or subcutaneous xenograft (for the tissue comparison) groups than in the xenograft groups.
To demonstrate the weight of metabolites in metabonomic difference in pair-comparisons, the visualized circles whose ranges were positively correlated with the concentrations (the radius was indicated as 15+2*concentration ratio), were also drew in the loading plots. Each circle in the volcano plots represents one metabolite, and the circle is colored according to the correlation coefficient of |r| and their cutoff values for the statistical significance were based on the discrimination significance at the level of p < 0.05 and the corresponding degree of freedom in the pair-wise comparison. Thus, the loading plots could demonstrate integrated information about metabonomic difference between groups, fully contributed to further metabolic pathways analysis.
Metabolic pathways analysis
To get a deep insight into the metabolic pathways involved in the metabonomic difference between SX and OX models, a comprehensive pathway analysis by using KEGG and MBROLE online service was performed on the differential metabolites derived from comparison of SX-OX models in both BxPC-3 and Panc-1 groups [48, 49].
Additional information
Supplemental materials contain the OPLS-DA and the validation for serum and tissue profiles between subcutaneous and orthotopic xenograft groups.
Author contributions
Conceived and designed the experiments: S. W., J. F., H. H. Performed the experiments: B. Z., S. W., X. L. Analyzed the data: B. Z., S. W., J. L., G. S. Wrote the paper: B. Z., S. W., J. F., H. H. All the authors reviewed the paper.
ACKNOWLEDGMENTS
This work is sponsored by the National Natural Science Foundation of China (No. 81272581, 31671920), the United Fujian Provincial Health and Education Project for Tackling the Key Research (No.WKJ-FJ-10) and National Key Clinical Specialty Discipline Construction Program of China and Key Clinical Specialty Discipline Construction Program of Fujian.
CONFLICTS OF INTEREST
The authors declare no competing financial interests.
REFERENCES
1. Siegel RL, Miller KD, Jemal A. Cancer statistics, 2015. CA Cancer J Clin. 2015; 65: 5-29.
2. Boj SF, Hwang CI, Baker LA, Chio II, Engle DD, Corbo V, Jager M, Ponz-Sarvise M, Tiriac H, Spector MS, Gracanin A, Oni T, Yu KH, et al. Organoid models of human and mouse ductal pancreatic cancer. Cell. 2015; 160: 324-338.
3. Herreros-Villanueva M, Hijona E, Cosme A, Bujanda L. Mouse models of pancreatic cancer. World J Gastroenterol. 2012; 18: 1286-1294.
4. Taketo MM. Mouse models of gastrointestinal tumors. Cancer Sci. 2006; 97: 355-361.
5. Du Q, Jiang L, Wang XQ, Pan W, She FF, Chen YL. Establishment of and comparison between orthotopic xenograft and subcutaneous xenograft models of gallbladder carcinoma. Asian Pac J Cancer Prev. 2014; 15: 3747-3752.
6. Li J, Zhao Z, Feng J, Gao J, Chen Z. Understanding the metabolic fate and assessing the biosafety of MnO nanoparticles by metabonomic analysis. Nanotechnol. 2013; 24: 238-241.
7. Dieterle F, Ross A, Schlotterbeck G, Senn H. Metabolite projection analysis for fast identification of metabolites in metabonomics. Application in an amiodarone study. Anal Chem. 2006; 78: 3551-3561.
8. Demšar U, Paul H, Chris B, Stewart F, Sean M. Principal component analysis on spatial data: an overview. Ann Assoc Am Geogr. 2013; 103: 106-128.
9. Wishart DS, Craig K, Anchi G, Roman E, Nelson Y, Bijaya G, David DH, Nick P, Edison D, Souhaila B, Rupasri M, Igor S, Jianguo X, et al. HMDB: a knowledgebase for the human metabolome. Nucleic Acids Res. 2009; 37: D603-610.
10. Deer EL, Gonzalez-Hernandez J, Coursen JD, Senn H. Phenotype and genotype of pancreatic cancer cell lines. Pancreas. 2010; 39: 425-435.
11. Commisso C, Shawn MD, Rengin GS, Seth JP, Jurre JK, Sean H, Elda G, Michel N, Jeffrey AD, Craig BT, Joshua DR, Christian MM, Matthew GV, et al. Macropinocytosis of protein is an amino acid supply route in Ras-transformed cells. Nature. 2013; 497: 633-637.
12. Son J, Lyssiotis CA, Ying H, Wang X, Hua S, Ligorio M, Perera RM, Ferrone CR, Mullarky E, Chang NS, Kang Y, Fleming JB, Bardeesy N, et al. Glutamine supports pancreatic cancer growth through a KRAS-regulated metabolic pathway. Nature. 2013; 496: 101-105.
13. Dean M, Rzhetsky A, Allikmets R. The human ATP-binding cassette (ABC) transporter superfamily. Genome Res. 2001; 11: 1156-1166.
14. Fletcher JI, Haber M, Henderson MJ, Norris MD. ABC transporters in cancer: more than just drug efflux pumps. Nat Rev Cancer. 2010; 10: 147-156.
15. Santisteban, M. ABC transporters as molecular effectors of pancreatic oncogenic pathways: the Hedgehog-GLI model. J Gastrointest Cancer. 2010; 41: 153-158.
16. Mohelnikova-Duchonova B, Brynychova V, Oliverius M, Honsova E, Kala Z, Muckova K, Soucek P. Differences in transcript levels of ABC transporters between pancreatic adenocarcinoma and nonneoplastic tissues. Pancreas. 2013; 42: 707-716.
17. Yuan Y, Yang Z, Miao X, Li D, Liu Z, Zou Q. The clinical significance of FRAT1 and ABCG2 expression in pancreatic ductal adenocarcinoma. Tumor Biol. 2015; 36: 9961-9968.
18. Aboagye EO, Bhujwalla ZM. Malignant transformation alters membrane choline phospholipid metabolism of human mammary epithelial cells. Cancer Res. 1999; 59: 80-84.
19. Ackerstaff E, Glunde K, Bhujwalla ZM. Choline phospholipid metabolism: a target in cancer cells? J Cell Biochem. 2003; 90: 525-533.
20. Glunde K, Jie C, Bhujwalla ZM. Molecular causes of the aberrant choline phospholipid metabolism in breast cancer. Cancer Res. 2004; 64: 4270-4276.
21. Iorio E, Mezzanzanica D, Alberti P, Spadaro F, Ramoni C, D’Ascenzo S, Millimaggi D, Pavan A, Dolo V, Canevari S, Podo F. Alterations of choline phospholipid metabolism in ovarian tumor progression. Cancer Res. 2005; 65: 9369-9376.
22. Marchan R, Lesjak MS, Stewart JD, Winter R, Seeliger J, Hengstler JG. Choline-releasing glycerophosphodiesterase EDI3 links the tumor metabolome to signaling network activities. Cell Cycle. 2012; 11: 4499-4506.
23. Penet MF, Shah T, Bharti S, Krishnamachary B, Artemov D, Mironchik Y, Wildes F, Maitra A, Bhujwalla ZM. Metabolic imaging of pancreatic ductal adenocarcinoma detects altered choline metabolism. Clin Cancer Res. 2015; 21: 386-395.
24. Soga T. Cancer metabolism: key players in metabolic reprogramming. Cancer Sci. 2013; 104: 275-281.
25. Hitosugi T, Kang SK, Heiden MG, Chung TW, Elf S, Lythgoe K, Dong SZ, Lonial S, Wang X, Chen GZ, Xie JX, Gu TL, Polakiewicz RD, et al. Tyrosine phosphorylation inhibits PKM2 to promote the Warburg effect and tumor growth. Sci Signal. 2009; 2: ra73.
26. Anastasiou D, Poulogiannis G, Asara JM, Boxer MB, Jiang JK, Shen M, Bellinger G, Sasaki AT, Locasale JW, Auld DS, Thomas CJ, Vander Heiden MG, Cantley LC, et al. Inhibition of pyruvate kinase M2 by reactive oxygen species contributes to cellular antioxidant responses. Science. 2011; 334: 1278-1283.
27. Gruning NM, Rinnerthaler M, Bluemlein K, Mulleder M, Wamelink MM, Lehrach H, Jakobs C, Breitenbach M, Ralser M. Pyruvate kinase triggers a metabolic feedback loop that controls redox metabolism in respiring cells. Cell Metab. 2011; 14: 415-427.
28. Di Virgilio F, Adinolfi E. Purines, purinergic receptors, and cancer. Cancer Res. 2012; 72: 5441-5447.
29. Ghiringhelli F, Apetoh L, Tesniere A, Aymeric L, Ma YT, Ortiz C, Vermaelen K, Panaretakis T, Mignot G, Ullrich E, Perfettini JL, Schlemmer F, Tasdemir E, et al. Activation of the NLRP3 inflammasome in dendritic cells induces IL-1beta-dependent adaptive immunity against tumors. Nat Med. 2009; 15: 1170-1178.
30. Di Virgilio F, Boeynaems JM, Robson SC. Extracellular nucleotides as negative modulators of immunity. Curr Opin Pharmacol. 2009; 9: 507-513.
31. Fishman P, Bar-Yehuda S, Synowitz M, Powell JD, Klotz KN, Gessi S, Borea PA. Adenosine receptors and cancer in handbook of experimental pharmacology. 2009; Springer: 399-441.
32. Hoskin DW, Butler JJ, Drapeau D, Haeryfar SM, Blay J. Adenosine acts through an A3 receptor to prevent the induction of murine anti-CD3-activated killer T cells. Int J Cancer. 2002; 99: 386-395.
33. Zitvogel L, Kepp O, Kroemer G. Immune parameters affecting the efficacy of chemotherapeutic regimens. Nat Rev Clin Oncol. 2011; 8: 151-160.
34. Vander Heiden MG. Targeting cancer metabolism: a therapeutic window opens. Nat Rev Drug Discov. 2011; 10: 671-684.
35. Fuchs BC, Bode BP. Amino acid transporters ASCT2 and LAT1 in cancer: partners in crime? Semin Cancer Biol. 2005; 15: 254-266.
36. Shimizu A, Kaira K, Kato M, Yasuda M, Takahashi A, Tominaga H, Oriuchi N, Nagamori S, Kanai Y, Oyama T, Asao T, Ishikawa O. Prognostic significance of L-type amino acid transporter 1 (LAT1) expression in cutaneous melanoma. Melanoma Res. 2015; 25: 399-405.
37. Kaira K, Sunose Y, Arakawa K, Ogawa T, Sunaga N, Shimizu K, Tominaga H, Oriuchi N, Itoh H, Nagamori S, Kanai Y, Segawa A, Furuya M, et al. Prognostic significance of L-type amino-acid transporter 1 expression in surgically resected pancreatic cancer. Br J Cancer. 2012; 107: 632-638.
38. Oda K, Hosoda N, Endo H, Saito K, Tsujihara K, Yamamura M, Sakata T, Anzai N, Wempe MF, Kanai Y, Endou H. I-Type amino acid transporter 1 inhibitors inhibit tumor cell growth. Cancer Sci. 2009; 101: 173-179.
39. Olivares O, Vasseur S. Metabolic rewiring of pancreatic ductal adenocarcinoma: new routes to follow within the maze. Int J Cancer. 2016; 138: 787-796.
40. Phang JM, Liu W, Hancock C. Bridging epigenetics and metabolism: role of non-essential amino acids. Epigenetics. 2013; 8: 231-236.
41. Sousa CM, Biancur DE, Wang XX, Halbrook CJ, Sherman MH, Zhang L, Kremer D, Hwang RF, Witkiewicz AK, Ying HQ, Asara JM, Evans RM, Cantley LC, et al. Pancreatic stellate cells support tumour metabolism through autophagic alanine secretion. Nature. 2016; 536: 479-483.
42. Kleeff J, Beckhove P, Esposito I, Herzig S, Huber PE, Lohr JM, Friess H. Pancreatic cancer microenvironment. Int J Cancer. 2007; 121: 699-705.
43. Apte MV, Wilson JS, Lugea A, Pandol SJ. A starring role for stellate cells in the pancreatic cancer microenvironment. Gastroenterology. 2013; 144: 1210-1219.
44. Pothula SP, Xu Z, Goldstein D, Pirola RC, Wilson JS, Apte MV. Key role of pancreatic stellate cells in pancreatic cancer. Pancreas. 2015; 29: 179-187.
45. National Research Council, National Insitutes of Health. Guide for the Care and Use of Laboratory Animals. Revised Edition. 1978; U. S. government printing office: 73.
46. Lin X, Zhan BH, Wen S, Li ZS, Huang HG, Feng JH. Metabonomic alterations from pancreatic intraepithelial neoplasia to pancreatic ductal adenocarcinoma facilitate the identification of biomarkers in serum for early diagnosis of pancreatic cancer. Mol Biosyst. 2016; 12: 2883-2892.
47. Wen S, Li Z, Feng J, Bai J, Lin X, Huang H. Metabonomic changes from pancreatic intraepithelial neoplasia to pancreatic ductal adenocarcinoma in tissues from rats. Cancer Sci. 2016; 107: 836-845.
48. Chagoyen M, Pazos F. MBRole: enrichment analysis of metabolomic data. Bioinformatics. 2011; 27: 730-731.
49. Kanehisa M, Goto S, Sato Y, Kawashima M, Furumichi M, Tanabe M. Data, information, knowledge and principle: back to metabolism in KEGG. Nucleic Acids Res. 2014; 42: D199-205.