
Introduction
Acute lymphoblastic leukemia (ALL) is the most common cancer in children and it accounts for 25% of all childhood malignancies. [1-3] Survival rates have improved significantly over time with the progressive intensification of ALL treatment and the implementation of multi-agent risk-adapted protocols. [2-4] However, a subset of patients experience treatment failure or short-term treatment-related toxicities which might result in the interruption or discontinuation of chemotherapy or can have severe, fatal, or lifelong consequences that challenge their ability to lead a normal life as future adults. [2]
Asparaginase (ASNase) was introduced as major component of ALL treatment protocols in 1970 and has been a mainstay of therapy ever since. [1-3, 5] It is an enzyme that catalyzes the hydrolysis of the amino acid asparagine (ASN) into aspartic acid and ammonia and is thus required by all cells. Cancerous lymphoblasts usually depend on extracellular sources of asparagine to support their fast growth as they have ASNS levels that are relatively lower than their needs. Thus, depletion of asparagine by ASNase reduces the capacity of protein biosynthesis in leukemia cells which selectively promotes their death. [1, 2]
Less favorable outcome in childhood ALL treatment has been associated with treatment discontinuation and the failure to receive the full course of ASNase due to treatment-related toxicities. [2, 4, 6] L-asparaginase comes from 2 bacterial sources, Escherichia coli (E.coli) and Erwinia chrysanthemi. While E. coli-derived enzyme generally has higher efficacy, it has been reported to have higher toxicity. [1-3] ASNase-related treatment toxicities mostly include allergic reactions, pancreatitis and thrombotic events frequently associated with discontinuation of asparaginase treatment. [1-4]
Given the bacterial origin of asparaginase, it is not surprising that it is capable of inducing immune reactions in vivo as up to 30% of patients experience a hypersensitivity reaction to E. coli-derived asparaginase. [1-4, 7] While reported rates vary across literature, clinical and subclinical hypersensitivity reactions are associated with decreased asparaginase activity levels caused by neutralizing antibodies and may be influenced by the asparaginase preparation used, dose intensity, and other medications. [3, 4, 7]
Around 2-18% of patients receiving asparaginase develop pancreatitis which is usually associated with clinical symptoms along with serum amylase and/or lipase elevation reaching more than three times upper-normal limits. [3, 4] While currently known risk factors include intensive treatment and older age, the pathogenesis of asparaginase-induced pancreatitis is not yet fully understood and is thought to occur as a result of an underlying predisposition. [2, 8] Interestingly, unlike with hypersensitivity reactions, the incidence of pancreatitis does not seem to be influenced, at least in some studies, by the formulation of asparaginase used. [3, 4, 8]
Thrombosis, defined as venous and/or arterial thromboembolism, has a higher incidence in paediatric oncology patients and is reported with both E. coli- and Erwinia-derived asparaginase (mainly due to interference with the hepatic synthesis of coagulation proteins) and has an overall incidence of around 5% according to recent studies. [4, 5] Many factors have been associated with the risk of thrombosis, some related to the disease, others to the treatment (like the dose and duration of asparaginase exposure) as well as to patient specific factors such as older age, female gender, non-O blood group, obesity, inherited prothrombotic states or central venous catheter. [3, 5, 9, 10]
Being able to predict which patients will experience asparaginase-related toxicity and switching them to an alternative asparaginase formulations [4] or a different treatment protocol that does not depend heavily on asparaginase has been shown to yield superior outcomes. [8] Accordingly, using genetic markers for prospective stratification of patients at high risk of developing allergic reactions, pancreatitis or thrombosis has the potential to improve ALL treatment by identifying a patient subgroup which might benefit more from an alternative regimen. [4, 8]
Over the past decade, important advances in sequencing technology have been achieved which not only helped deciphering leukemia specific mutations, [11, 12] but also provided comprehensive information on germline polymorphisms for association studies of complex disease traits and suboptimal treatment responses. [11, 12] Here we present the results of an exome-wide association study (EWAS) that was performed on whole exome sequencing (WES) data obtained from childhood patients who received asparaginase as part of ALL treatment protocol. The results provide an insight on novel pharmacogenetic markers associated with asparaginase related allergic reactions, pancreatitis and thrombosis.
Results
Asparaginase-related complications
Twenty-nine patients (9.6%) received a formulation containing Erwinia derived asparaginase while the rest received an E.coli derived formulation (Table 1). The observed frequencies of the asparaginase-related toxicities ware comparable to those reported in the literature [2, 4, 5, 8]: 15.9% (48) patients developed allergies (with 40 of them having serious systemic reactions while the rest having mixed or local reactions); 5% (15) experienced pancreatitis (12 severe and 3 mild to moderate); and 3.3% (10) had thrombosis. Consequently, and following the treatment protocols guidelines, ALL patients with complications needed treatment modification, either interruption or switch to other types of asparaginase.
Toxicities in replication cohort had similar frequencies to those of the discovery cohort as there were 20.9% (59) patients with allergies (39 systemic) and 7.4% (21) with pancreatitis (14 severe). Information on thrombosis was not available. The frequency of Erwinia-derived asparaginase and E.coli formulation was also comparable to the discovery cohort.
Table 1: Characteristics of the discovery and the replication cohort.
Cohort Characteristics |
QcALL |
DFCI |
p-Value |
|
Total Included |
302 |
282 |
|
|
Sex |
Female |
139 (46%) |
129 (45,7%) |
1 |
Male |
163 (54%) |
153 (54,3%) |
||
WBC |
< 50x103/µL |
257 (85,1%) |
229 (81,2%) |
0,2 |
> 50x103/µL |
45 (14,9%) |
53 (18,8%) |
||
Age |
< 10 years |
242 (80,1%) |
230 (81,6%) |
0,7 |
≥ 10 years |
60 (19,9%) |
52 (18,4%) |
||
Risk |
Standard |
151 (50%) |
173 (61,3%) |
0,007 |
High |
151 (50%) |
109 (38,7%) |
||
Source of Asparaginase |
E. Coli |
273 (90,4%) |
261 (92,6%) |
0,4 |
Erwinia |
29 (9,6%) |
21 (7,4%) |
||
DFCI Protocol |
00-01 |
111 (36,8%) |
187 (66,3%) |
6x10⁻⁵ |
95-01 |
119 (39,4%) |
95 (33,7%) |
||
91-01 |
55 (18,2%) |
- |
- |
|
87-01 |
17 (5,6%) |
- |
||
QcALL, Quebec Childhood ALL cohort; DFCI, Dana-Farber Cancer Institute ALL Consortium cohort.
Association study
The number of predicted functional common variants recovered from WES data was 5527; from these, 4519 SNPS distributed across 3802 genes, respected Hardy-Weinberg equilibrium and were tested for an association with asparaginase-related toxicities. Out of the 115 top-ranking SNPs identified from WES data with FDR < 20%, 43 were associated with allergy, 40 with pancreatitis and 32 with thrombosis (Supplemental Table S1). Given the relatively large number of hits, selective exclusion was performed to remove the SNPs found in genes that are unlikely to be involved in the pathways of studied toxicities (e.g. genes of the olfactory receptors family and other neurosensory functions as well as the ones whose expression is restricted to tissues that are irrelevant to the toxicity in question). Accordingly, and out of the remaining pool, thirty two SNPs (8 SNPs associated with allergy, 10 with thrombosis and 14 with pancreatitis) with minor allele frequency higher than 5% in discovery cohort and located in genes whose biological function could be relevant to the studied response, were selected (Figure 1 and Supplemental Table S2).
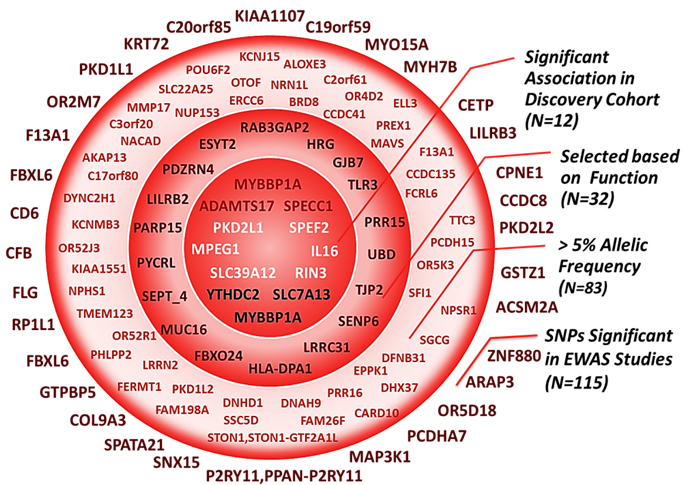
Figure 1: The selection process following the exome-wide association study. Top-ranking signals from the EWAS (N = 115) were filtered through a multi-step selection process explained on the right-side of the figure. Each circle contains all the SNPs that are inside of it, including the ones in the smaller circles. Inner circle represent significant associations with one of the 3 asparaginase related toxicities (N = 12) retained for analysis in replication cohort. rs3809849 in MYBBP1A was significantly associated both with allergy and pancreatitis in the EWAS study.
Based on genotyping results, 3 variants were associated with allergy (Table 2). Carriers of the minor allele of rs9656982 in the SLC7A13 gene and of rs3809849 in the MYBBP1A gene were associated in additive manner (OR = 2.1; 95% CI, 1.1-3.9; p = 0.02 and OR = 2.4; 95% CI, 1.4-3.9; p = 0.0006, respectively), whereas the effect of rs75714066 minor allele in the YTHDC2 gene followed the dominant model (OR = 3.1; 95% CI, 1.4-7.0; p = 0.008).
Three SNPs were significantly associated with a risk of pancreatitis (Table 2). Carriers of the minor allele of rs72755233 in the ADAMTS17 gene and of rs3809849 in the MYBBP1A gene were at higher risk of pancreatitis when compared to non-carriers (OR = 5.6; 95% CI, 1.9-16.3; p = 0.002 and OR = 6.9; 95% CI, 1.9-25.2; p = 0.002, respectively), whereas the SNP (rs9908032) in the SPECC1 gene followed the additive model (OR = 3.9; 95% CI, 1.6-9.2; p = 0.0008).
Six SNPs were associated with thrombosis (Table 2). Carriers of minor alleles were predisposed to a higher risk when compared to non-carriers including rs6584356 in PKD2L1 (OR = 5.0; 95% CI, 1.2-20.7; P = 0.05); rs3742717 in RIN3 (OR = 13.8; 95% CI, 2.3-82.5; P = 0.02); rs34708521 in SPEF2 (OR = 6.1; 95% CI, 1.4-26.9; P = 0.03); rs7926933 in MPEG1 (OR = 5.7; 95% CI, 1.5-22.1; P = 0.01); rs11556218 in IL16 (OR = 7.4; 95% CI, 1.8-31.2; P = 0.01) and rs62619938 in SLC39A12 (OR = 4.4; 95% CI, 1.6-11.7; P = 0.0005).
In the light of their positive association, each SNP was tested for possible associations with the two other side-effects. Interestingly, on the top of their association with allergy and pancreatitis, homozygote carriers of the variant rs3809849 allele in the MYBBP1A gene were associated with a higher risk of thrombosis (OR = 6.8; 95% CI, 1.3-36.5; p = 0.02; Figure 2a); whereas, rs11556218 in IL16 and rs34708521 in SPEF2 were, in addition to thrombosis, also correlated with pancreatitis (OR = 3.1; 95% CI, 1.1-8.6; p = 0.02 and OR = 3.4; 95% CI, 1.1-10.6; p = 0.02; Figures 2b and 2c, respectively).
The risk of any-toxicity increased in additive manner with the minor C allele of the rs3809849 SNP in the MYBBP1A gene (OR = 2.7; 95% CI, 1.7-4.3; p = 3x10⁻⁵;
Figure 3a). The same SNP was significantly associated with less favorable disease outcomes as homozygous C allele carriers had a reduced EFS (OR = 3.2; 95% CI, 1.4-7.4; p = 0.02; Figure 3b) and OS (OR = 5.3; 95% CI, 1.8-15.8; p = 0.003; Figure 3b).
In the multivariate analysis, only the association of rs34708521 in SPEF2 gene with thrombosis lost significance (OR = 4.3; 95% CI, 0.8-22.3; p = 0.08), whereas other associations remained significant in their respective models (Supplemental Table S3).
Table 2: Top-ranking signals from the exome-wide association study confirmed by genotyping.
Toxicity |
Gene_SNP Genotype |
Complication |
OR (95%-CI) |
P |
Model |
Complication |
OR (95%-CI) |
P |
||
+ |
- |
+ |
- |
|||||||
Allergy |
SLC7A13_rs9656982: A > G* |
|||||||||
AA |
37 (77,1%) |
217 (87,2%) |
1 |
1 |
|
2,1 (1,1-3,9) |
0,02 |
|||
AG |
8 (16,7%) |
30 (12,1%) |
1,6 (0,7-3,7) |
0,3 |
||||||
GG |
3 (6,3%) |
2 (0,8%) |
8,8 (1,4-54,5) |
0,03 |
||||||
MYBBP1A_rs3809849: G > C* |
||||||||||
GG |
20 (41,7%) |
160 (65%) |
1 |
1 |
|
2,4 (1,4-3,9) |
6x10⁻⁴ |
|||
GC |
23 (47,9%) |
79 (32,1%) |
2,3 (1,2-4,5) |
0,01 |
||||||
CC |
5 (10,4%) |
7 (2,9%) |
5,7 (1,7-19,7) |
0,01 |
||||||
YTHDC2_rs75714066: G > C |
||||||||||
GG |
37 (77,1%) |
232 (91,3%) |
1 |
1 |
GG |
37 (77,1%) |
232 (91,3%) |
1 |
- |
|
GC |
11 (22,9%) |
21 (8,3%) |
3,3 (1,5-7,4) |
0,005 |
GC+CC |
11 (22,9%) |
22 (8,7%) |
3,1 (1,4-7,0) |
0,008 |
|
CC |
0 (0%) |
1 (0,4%) |
NA |
- |
||||||
Pancreatitis |
ADAMTS17_rs72755233: G > A |
|||||||||
GG |
7 (46,7%) |
232 (83,2%) |
1 |
1 |
GG |
7 (46,7%) |
232 (83,1%) |
1 |
- |
|
GA |
8 (53,3%) |
45 (16,1%) |
5,9 (2-17,1) |
0,002 |
GA+AA |
8 (53,3%) |
47 (16,9%) |
5,6 (1,9-16,3) |
0,002 |
|
AA |
0 (0%) |
2 (0,7%) |
NA |
- |
||||||
MYBBP1A_rs3809849: G > C |
||||||||||
GG |
3 (20%) |
177 (63,4%) |
1 |
1 |
GG |
3 (20%) |
177 (63,4%) |
1 |
- |
|
GC |
12 (80%) |
90 (32,3%) |
7,9 (2,2-28,6) |
0,0005 |
GC+CC |
12 (80%) |
102 (36,6%) |
6,9 (1,9-25,2) |
0,002 |
|
CC |
0 (0%) |
12 (4,3%) |
NA |
- |
||||||
SPECC1_rs9908032: C > G* |
||||||||||
CC |
8 (53,3%) |
228 (80,6%) |
1 |
1 |
|
3,9 (1,6-9,2) |
8x10⁻⁴ |
|||
CG |
5 (33,3%) |
53 (18,7%) |
2,7 (0,8-8,5) |
0,1 |
||||||
GG |
2 (13,3%) |
2 (0,7%) |
28,5 (3,6-228,8) |
0,009 |
||||||
Thrombosis |
PKD2L1_rs6584356: C > A |
|||||||||
CC |
7 (70%) |
257 (92,1%) |
1 |
1 |
CC |
7 (70%) |
257 (92,1%) |
1 |
- |
|
CA |
2 (20%) |
22 (7,9%) |
3,3 (0,7-17) |
0,2 |
CA+AA |
3 (30%) |
22 (7,9%) |
5 (1,2-20,7) |
0,05 |
|
AA |
1 (10%) |
0 (0%) |
NA |
- |
||||||
RIN3_rs3742717: C > T |
||||||||||
CC |
6 (60%) |
219 (77,7%) |
1 |
1 |
CC+CT |
8 (80%) |
277 (98,2%) |
13,8 (2,3-82,5) |
0,02 |
|
CT |
2 (20%) |
58 (20,6%) |
1,3 (0,2-6,4) |
1 |
||||||
TT |
2 (20%) |
5 (1,8%) |
14,6 (2,3-91) |
0,02 |
TT |
2 (20%) |
5 (1,8%) |
|||
SPEF2_rs34708521: G > A |
||||||||||
GG |
5 (62,5%) |
242 (91%) |
1 |
1 |
GG |
5 (62,5%) |
242 (91%) |
1 |
- |
|
GA |
3 (37,5%) |
23 (8,7%) |
6,3 (1,4-28,1) |
0,03 |
GA+AA |
3 (37,5%) |
24 (9%) |
6,1 (1,4-26,9) |
0,03 |
|
AA |
0 (0%) |
1 (0,4%) |
NA |
- |
||||||
Thrombosis |
SLC39A12_rs62619938: C > T* |
|||||||||
CC |
6 (60%) |
262 (91%) |
1 |
1 |
|
4,4 (1,6-11,7) |
5x10⁻⁴ |
|||
CT |
3 (30%) |
23 (8%) |
5,7 (1,3-24,3) |
0,04 |
||||||
TT |
1 (10%) |
3 (1%) |
14,6 (1,3-161) |
0,1 |
||||||
MPEG1_rs7926933: G > A |
||||||||||
GG |
4 (44,4%) |
234 (82,1%) |
1 |
1 |
GG |
4 (44,4%) |
234 (82,1%) |
1 |
- |
|
GA |
5 (55,6%) |
45 (15,8%) |
6,5 (1,7-25,1) |
0,009 |
GA+AA |
5 (55,6%) |
51 (17,9%) |
5,7 (1,5-22,1) |
0,01 |
|
AA |
0 (0%) |
6 (2,1%) |
NA |
- |
||||||
IL16_rs11556218: T > G |
||||||||||
TT |
4 (50%) |
238 (88,2%) |
1 |
1 |
TT |
4 (50%) |
238 (88,1%) |
1 |
- |
|
TG |
4 (50%) |
30 (11,1%) |
7,9 (1,9-33,4) |
0,009 |
TG+GG |
4 (50%) |
32 (11,9%) |
7,4 (1,8-31,2) |
0,01 |
|
GG |
0 (0%) |
2 (0,7%) |
NA |
- |
||||||
The SNPs are presented as a change from major to minor alleles. OR, odds ratio; CI, confidence interval. Analysis in both co-dominant model and a model that best fits the data are presented. The final models are either dominant, recessive or additive; the latter is indicted by asterisk. NA, not analyzed due to low numbers.
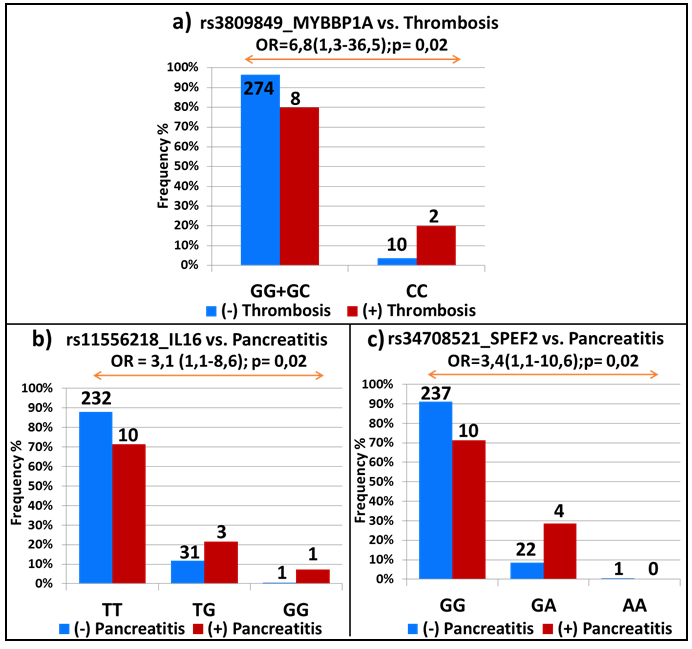
Figure 2: Top-ranking EWAS signals common for several asparaginase-related toxicities. SNPs that showed significant associations with one of the asparaginase-related toxicities were further tested for possible associations with the remaining side-effects. Association with thrombosis in a. and pancreatitis in b. and c. The studied association with the OR and 95% CI in brackets is indicated on the top of the graph. The frequency of patients with and without toxicity is represented by red and blue bars, respectively. The number of patients is shown on the top of each bar and the genotypes are indicated at the bottom of the graphs.
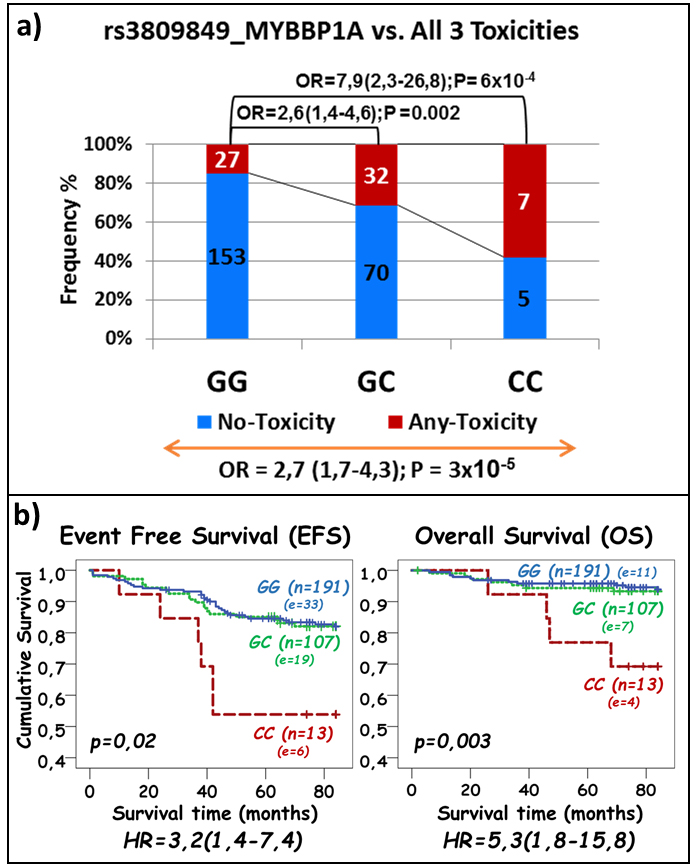
Figure 3: Association of rs3809849 in MYBBP1A gene with ASNase-related toxicities a. and with event free- and overall survival b. a. The frequency of patients with at least one asparaginase-related toxicity and without any toxicity is represented by the red and blue part of the bar, respectively. The number of samples per category is displayed inside of the bars. The OR with the 95% CI is given when compared to patients with no variant allele (top of the graph) and across all genotype groups (bottom of the graph). b. The p-values obtained by the log rank test for the difference across genotypes are provided on each plot. The number of patients represented by each genotype and number of patients with event (in brackets) are indicated next to each curve. Hazard-ratios (HR) obtained through Cox-regression analysis are given with 95% CI.
Replication analysis
Out of the 6 significant associations with allergy and pancreatitis that were confirmed by genotyping in the discovery cohort, the association between rs3809849 in the MYBBP1A gene and pancreatitis was replicated in the DFCI cohort (OR = 2.8; 95% CI, 1.1-7.1; p = 0.05, Figure 5a). Interestingly, the positive associations that were observed between rs11556218 in IL16 and rs34708521 in SPEF2 and the higher risk of pancreatitis were also seen in DFCI cohort (OR = 6.7; 95% CI, 1.1-41.5; p = 0.05 in patients with mild and moderate pancreatitis and OR = 3.4; 95% CI, 1.1-10.5; p = 0.02, Figures 5b and 5c, respectively). More significant associations were noted for rs3809849 and rs34708521 when analyses were performed in the cohort combining discovery and replication set (p = 0.0003 and p = 0.008, respectively, Supplemental Table S4). The significant associations with allergies were not replicated, whereas those with thrombosis were not tested since the data were not available in the validation group.
Table 3: Performance of the comprehensive genetic model in predicting the risk of pancreatitis.
Cohort |
AUC ± SD. |
95% CI |
P |
Sensitivity |
Specificty |
QcALL |
0,80 ± 0,062 |
68,1 ~ 92,6 |
1x10⁻⁴ |
71% |
81% |
DFCI |
0,78 ± 0,076 |
63,0 ~ 92,9 |
3x10⁻³ |
70% |
77% |
Combined |
0,80 ± 0,049 |
70,1 ~ 89,1 |
1x10⁻⁶ |
71% |
79% |
The data were extracted from the receiver operator characteristic (ROC) curves of the comprehensive model for pancreatitis which combines the 5 SNPs associated with this toxicity. The curves were produced by plotting the sensitivity against (1-specificty) of the model using weighted genetic risk scores to estimate the area under the curve in each cohort. The sensitivity and specificity reported in this table are based on an odds ratio greater than 11 for the risk of developing pancreatitis.
AUC, Area Under the Curve; SD, standard deviation; QcALL, Quebec Childhood ALL cohort; DFCI, Dana-Farber Cancer Institute ALL Consortium cohort.
Combined effect model
We next investigated the combined effect of the top-ranked SNPs in each of the toxicities. In this model, a significant correlation was observed between the number of variant alleles carried and the increase in the risk of each of the toxicities. For allergy, the risk associated with an additive effect was 2.5 (95% CI, 1.6-3.9; p = 4X10⁻⁵,
Figure 4a), whereas the presence of 2 or more variant alleles was associated with a 6.5-fold increase in the risk of experiencing allergic reactions as compared to not carrying any variant allele (OR = 6.5; 95% CI, 2.7-15.6; p = 1X10⁻⁵, Figure 4a). Similar effect was noted for thrombosis (OR for additive effect = 4.0; 95% CI, 1.5-10.6; p = 0.002, Figure 4b). As for pancreatitis, the addition of all 3 variants in the model increased the risk 6-fold (OR = 5.9; 95% CI, 2.4-14.4; p = 7x10⁻⁶, Figure 4c) with carriers of at least two variant alleles being almost 28 times more at risk as compared to those without any variant allele (OR = 27,9; 95% CI, 3,5-224,3; p = 3X10⁻⁵, Figure 4c).
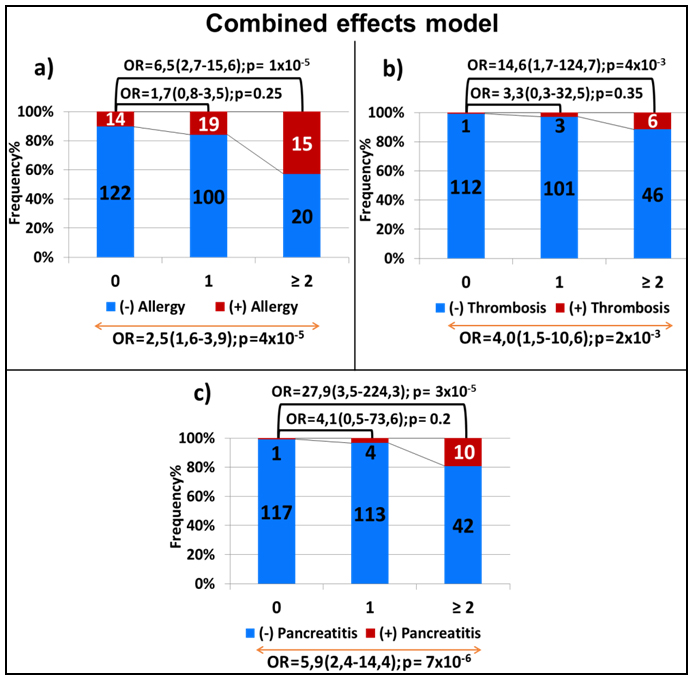
Figure 4: Combined-effect model of the variants associated with allergy a., thrombosis b. and pancreatitis c. Each bar represents the number of the variant alleles (i.e. none, one, two or more). The frequency of patients with and without toxicity is represented by the red and blue part of the bar, respectively. The number of samples per category is displayed inside of the bars. The OR with the 95% CI is given when compared to patients with no variants allele (top of the graph) and across genotype groups with increasing number of minor alleles (bottom of the graph).
In an attempt to increase the discrimination ability of the model, rs11556218 in IL16 and rs34708521 in SPEF2 that were initially investigated for their association with thrombosis but later found to be also associated with pancreatitis, were added to the analysis. In this new comprehensive model with five variants, the groups of 0, 1, 2 and 3 or more variant alleles were compared. The association between the number of minor alleles and the increase in the risk of pancreatitis was directly proportional (OR = 5; 95% CI, 2.4-10.2; P = 5x10⁻⁷, Supplemental Figure S1).
The model combining the 3 SNPs associated with pancreatitis (i.e. rs72755233 in ADAMTS17, rs3809849 in MYBBP1A and rs9908032 in SPECC1) was also replicated in the validation cohort (OR = 2.2; 95% CI, 1.1-4.6; P = 0.02, Figure 5d), as also was the comprehensive model with the five variants (OR = 2.6; 95% CI, 1.3-5.4; P = 0.005, Supplemental Figure S1). The association was further potentiated in the combined cohort (p = 2x10⁻⁶ and p = 1x10⁻⁸ for the models containing 3 and 5 SNPs, respectively; Supplemental Figure S2).
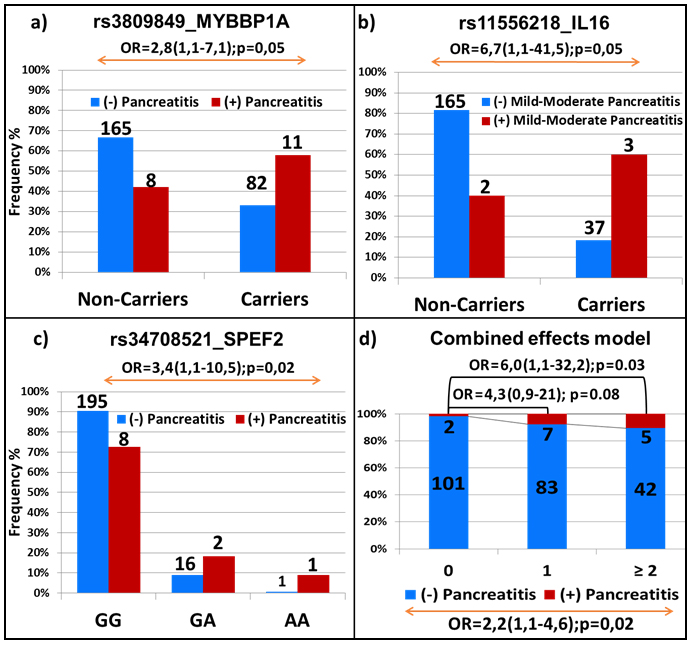
Figure 5: Replication analysis in the independent validation cohort. Association of pancreatitis with genetic variations in MYBBP1A a., IL16 b., SPEF2 c. and in combined effect model d. The frequency of patients with and without pancreatitis in a., b. and c. is represented by red and blue bars, respectively. The number and the genotypes are indicated. Combined-effect model in d. includes SNPs identified for association with pancreatitis through EWAS of discovery cohort (i.e. rs72755233 in ADAMTS17, rs3809849 in MYBBP1A and rs9908032 in SPECC1). Each bar represents the number of the variant alleles present (i.e. none, one, two or more). The frequency of patients with and without toxicity is represented by the red and blue part of the bar, respectively. The number of samples per category is displayed inside of the bars. The OR with the 95% CI is given when compared to patients with no variants allele (top of the graph) and across groups (bottom of the graph).
Risk prediction
To assess the performance of the comprehensive combined-effect model in predicting the risk of ASNase-induced pancreatitis, we used the weighted genetic risk score (wGRS) method. [13] A risk score was assigned to each patient by taking the sum of the weighted score of each risk allele across the 5 loci. We then applied these values derived from the discovery cohort to assign the risk scores to patients in the validation cohort. The performance of the model in the discovery, replication and combined cohorts, is summarized in Table 3. The discriminatory ability of the model is reflected by the area under the ROC curve derived from the wGRS. The best sensitivity/specificity values were derived from the OR values greater than 11 corresponding to at least two associated SNPs. The model was successfully validated in the replication and combined cohorts.
In order to evaluate the efficiency and reproducibility of the model in assigning patients to risk categories, the patients were divided into 4 groups based on the weighted genetic risk scores. Patients who had a score of 0 (indicating the absence of any risk allele) were considered the standard risk category, whereas those who had higher scores were divided into 3 equal groups corresponding to low, intermediate and high risk based on their individually assigned cumulative OR. Distribution of the patients with pancreatitis was compared across the groups and between the two cohorts. The distribution of patients with pancreatitis in the replication cohort (which was based on the predicted ORs) was similar to that of patients from the discovery cohort (who were classified according to their observed ORs), Figure 6. Patients predicted to have the highest risk of pancreatitis (thus assigned to group H) had substantially higher frequency of individuals who actually developed pancreatitis and the observed OR of this group was significantly greater than that of the standard risk group (Figure 6).
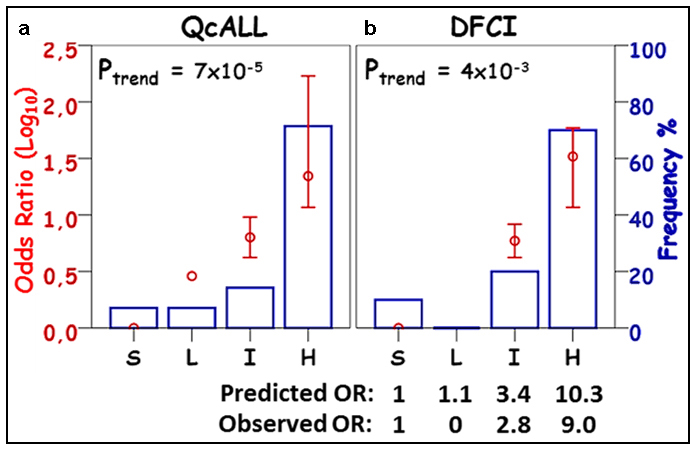
Figure 6: Distribution of patients with pancreatitis among risk groups established using wGRS from the comprehensive combined-effect model in a) QcALL, b) DFCI cohort. Risk groups (S, standard; L, low; I, intermediate and H, high) represent the categorical distribution of weighted genetic risk scores (wGRS) of the Comprehensive Combined-effect model containing the 5 SNP associated with pancreatitis in this study (i.e. rs72755233 in ADAMTS17, rs3809849 in MYBBP1A, rs9908032 in SPECC1, rs11556218 in IL16 and rs34708521 in SPEF2). The wGRS values in a. were calculated from the discovery cohort and were used to predict the odds ratios in the validation cohort b. The frequency of patients with pancreatitis in each risk group is displayed as a blue lined histogram reflecting the percentage out of the total number of cases. Log(OR) for pancreatitis susceptibility for each risk group (red circle) with a 95% confidence interval and the p-value for the trend across the groups are provided. The groups correspond to the following OR cut-off values: S (1); L ( > 1); I ( > 3.4) and Q4 ( > 10.3) as predicted from the QcALL cohort. The observed ORs per risk group in the DFCI cohort are also provided.
Discussion
Using WES data we identified common genetic variants significantly associated with asparaginase-related side-effects. The rs3809849 in the MYBBP1A gene was associated both with allergy and pancreatitis; the significant association with pancreatitis was replicated in the validation cohort. The same SNP was also associated with thrombosis as well as reduction in EFS and OS in discovery cohort. The observed association with EFS and OS could be the result of treatment interruption due to the development of side-effects or could be mediated by ASNase deactivation in the case of allergic reactions. In either situation, the patients would consequently receive a lower ASNase dose intensity, which has been previously shown to be associated with less favourable outcome. [2, 4, 6] Another possible hypothesis involves an increased clearance of dexamethasone driven by anti-asparaginase antibodies which ultimately reduces the overall exposure to this drug and is associated with higher risk of relapse. [14] The effect of other confounding factors such as, for example, leukemia specific mutations, cannot be however ruled out.
MYBBP1A gene encodes MYB Binding Protein 1a which is important for early embryonic development as well as many other cellular processes including mitosis, cell cycle control, response to nuclear stress, synthesis of ribosomal DNA and tumoral suppression via modulation of the p53 activity. [15, 16] MYBBP1A also acts as a co-repressor of the nuclear factor kappaB (NF-kB), [17, 18] a transcription factor activated in response to inflammatory and stress signals, apoptosis and cellular proliferation. Interestingly, a key role of NF-kB in the development of acute pancreatitis has been recently documented. [19] To our knowledge, this is the first study demonstrating an association between MYBBP1A gene and the risk of pancreatitis. In general, rs3809849 in MYBBP1A gene was rarely investigated. There is only one study which found significant association of this SNP with higher risk of tuberculosis. [18]
Another interesting observation is that 2 loci that were initially investigated for their possible association with thrombosis also showed significant and reproducible associations with pancreatitis. Accordingly, G allele carriers of the rs11556218 SNP in the IL16 gene and carriers of the A allele in the rs34708521 SNP of the SPEF2 gene, were at higher risk of pancreatitis in both discovery and replication cohorts. The association with IL16 is of particular interest because IL16 gene codes for interleukin-16, a multifactorial cytokine involved in inflammatory and autoimmune diseases as well as cancer risk. [20] In the past few years, rs11556218 has been found to be associated with a wide range of conditions such as endometriosis, [21] Alzheimer’s Disease, [22] emphysema, [23] coronary artery disease, [24] ischemic stroke, [25] systemic lupus erythematous, [26] chronic hepatitis B infection, [27] osteoarthritis, [20] overall cancer risk as well as particular cancer types. [28] SPEF2 stands for “Sperm Flagellar 2” gene which encodes for a protein that is required for correct axoneme development. [29] Even though the association of this gene with thrombosis and pancreatitis might seem counterintuitive, we are tempted to speculate that this might be mediated by the role this gene has in protein dimerization activity and the fact that the protein it encodes is significantly overexpressed in platelets. [30] This finding should be investigated in future studies.
Our analysis also suggests that synergistic interactions might exist between the SNPs identified in each of the studied toxicities, which could explain the markedly significant associations and high odd-ratios in the combined SNPs models. Same combined effect was noted for pancreatitis in the replication set. When all associated SNPs were regarded together, either in combined or comprehensive model, they could explain almost all cases of pancreatitis in both patients’ groups. This was further supported by the model based on wGRS that displayed the best discrimination ability between individuals with and without pancreatitis as confidence limits were substantially above random prediction. Importantly, similar sensitivity and specificity values were observed in the discovery and replication cohorts at odds ratio greater than the chosen threshold which reflects the stability of the model. Furthermore, the prediction model using wGRS values derived from the discovery cohort to assign patients of the validation cohort into risk groups was able to detect far more patients at risk of pancreatitis than any of the SNPs considered alone. In fact, the group of patients predicted to have the highest risk based on their calculated wGRS had a substantial overrepresentation of individuals with pancreatitis compared to all other groups and a significantly higher OR compared to the standard risk group.
This indicates that it would be important to further investigate the utility of using sets of SNPs, rather than individual variants. This EWAS added novel genetic markers to the existing pool of pharmacogenetics modifiers of ASNase treatment that were previously described by several groups including ours, using GWAS and candidate-gene studies (ex. ATF5 and EFS, [31] ASNS and allergy/pancreatitis, [2] GRIA1 and hypersensitivity, [32] HLA-DRB1*0701 and allergy, [33] CPA2 and pancreatitis [8]). Collectively, this rapidly growing pool of markers might become more efficient in explaining the observed inter-individual variability in morbidities associated with anti-leukemia treatment which can eventually help developing genotype guided interventions for patients predisposed to such toxicities. [34]
As per the impact of the sources of ASNase used, the results did not differ significantly when samples of patients who received Erwinia-derived ASNase were excluded from the analysis. The only noteworthy observation was related to the association of IL16 with pancreatitis. On the top of the association with mild-moderate pancreatitis shown earlier in replication cohort (when both ASNase formulations were confounded), IL16 SNP also showed a significant association with overall pancreatitis in the group treated only with E. coli derived formulation in the replication cohort. This difference can be due to the fact that patients treated with E. coli ASNase usually have higher rates of ASNase related toxicities. [1, 2] Likewise, the addition of other factors (age, sex, protocol, risk groups) in multivariate model did not affect the results since all of the presented associations remained significant in the multivariate analysis, with the sole exception of rs34708521 in SPEF2 gene with thrombosis.
There are several limitations to our study. The analyses were done retrospectively as clinical data were inferred from the patients’ medical charts. The distribution of treatment protocols and risk groups varied significantly between the cohorts, which could have introduced variability as patients might have received different ASNase doses. The sample size of the discovery cohort was relatively small and the selected FDR threshold of < 20% was relaxed, which might have increased the number of false-positives, possibly reflected in the high number of EWAS hits. However, the fact that several associations were successfully reproducible in the independent validation cohort supports the validity of the findings. Furthermore, the analysis in the context of a larger sample size provided by the combined cohort further supports the correlation between the SNPs in MYBBP1A, IL16 and SPEF2 with pancreatitis as the associations gained more significance in the pooled sample. Finally, this study aimed primarily to identify genetic markers that put the patients at risk of developing treatment-related toxicities commonly associated with the use of asparaginase; however, the treatment included other chemotherapeutic agents which makes it difficult to estimate the magnitude of the interaction between asparaginase alone and the genetic composition, requiring experiments in cell lines and animal models to further support the observations.
In conclusion, using WES data in the context of association study was a successful “hypothesis-free” strategy which allowed identifying significant genetic associations with asparaginase-related toxicities in children treated for ALL. Results for pancreatitis were replicated in the independent validation cohort. Even though interesting associations with thrombosis were observed, no replication studies were done due to logistic limitations. Thus, it would be valuable replicating further those results.
Patients and methods
Study population and endpoints in the analysis
Discovery cohort consisted of 302 children of European descent from the well-established Quebec Childhood ALL (QcALL) cohort who were diagnosed with childhood ALL at the Sainte-Justine University Hospital Centre (SJUHC), Montreal, QC, Canada, between January 1989 and July 2005. ALL patients received ASNase as part of the Dana-Farber Cancer Institute ALL Consortium protocols DFCI 87-01, 91-01, 95-01, or 00-01 (Table 1). [2, 6, 31, 35] In 95-01 and 00-01, one dose of asparaginase was administered during remission induction, and in all protocols it was administered for 20-30 consecutive weeks during consolidation phase. Details about asparaginase doses and formulation are provided elsewhere. [31, 35] Retrospective review of the medical files was conducted to obtain information on ASNase-related toxicity. Hypersensitivity reactions were defined as adverse local or general manifestations from exposure to asparaginase (flushing, erythema, rash, urticaria, drug fever, dyspnoea, symptomatic bronchospasm, oedema or angio-oedema). [2] Pancreatitis was identified according to the diagnostic criteria of the institution and the guidelines of respective protocols which involved pancreatic enzyme elevation of higher than 3-fold the normal levels along with other clinical signs and symptoms that confirm the diagnosis. [2, 36] Thrombosis was determined by clinical symptoms and confirmed by radiologic imaging based on institutional guidelines. [2, 37]
The replication cohort consisted of 282 children who share similar characteristics with the discovery cohort and who were treated according to the 95-01 and 00-01 protocols. All participants had been previously recruited at one of the nine remaining Dana Farber consortium institutions (i.e. DFCI cohort excluding the SJUHC patients). Information on ASNase related allergy and pancreatitis were available for these patients. Clinical characteristics of both the discovery and replication cohorts are shown in Table 1.
Written informed consent was obtained in accordance with the Declaration of Helsinki from all participants and/or their parents or legal guardians. Institution ethics committees approved the study.
Whole exome sequencing (WES)
DNA was extracted from peripheral blood or bone marrow samples obtained after remission from 224 childhood ALL patients (QcALL cohort) [38] using standard protocols as described previously. [39] Whole exomes were captured in solution with Agilent’s SureSelect Human All Exon 50Mb kits, and sequenced on the Life Technologies SOLiD System (patients mean coverage ~35X). Reads were aligned to the hg19 reference genome using SOLiD LifeScope software. PCR duplicates were removed using Picard. [40] Base quality score recalibration was performed using the Genome Analysis ToolKit (GATK) [41] and QC Failure reads were removed. Cleaned BAM files were used to create pileup files using SAMtool. [42]
Germline variants have been called using SNooPer [43] a variant caller based on a machine learning algorithm that uses a subset of variant positions from the sequencing output for which the class is known, either actual variation or sequencing error, to train a data-specific model.
The annotation of the identified germline variants was performed using ANNOVAR. [44] Only missense, nonsense and variations in splicing sites were conserved. The predicted effect of missense variants on the protein function was assessed in silico using Sift (≤0.05) [45] and Polyphen2 (≥0.5). [46] Minor allele frequencies higher than 5% were derived from the 1000 Genomes (European population) [47] and the NHLBI GO Exome Sequencing Project (European population, ESP). [48]
Fisher’s Exact test (allelic association) and Cochran-Armitage trend test, implemented in PLINK [49], were used for an association study. Adjustment for multiple testing was performed by bootstrap false discovery rate (FDR) [50] method; the SNPs retained for further analysis had FDR lower than 20%.
Validation of top-ranking EWAS signals by genotyping
Genotyping of top ranking EWAS signals was either performed at the McGill University and Génome Québec Innovation Centre through Sequenom genotyping platform or by allele-specific oligonucleotides (ASOs) hybridization as described earlier. [51] Comparison between genotypes and ASNase related complication was performed for each of the SNPs by χ2 test or Fisher test. For significant associations, the genetic model that was most representative of the effect of the variant (i.e. additive, dominant, or recessive) was tested as well. The genotype-associated risk was expressed as odds ratio (OR) with 95% confidence interval (CI). Survival differences in terms of event-free-survival (EFS) and overall survival (OS) were estimated using Kaplan-Meier analysis for patients with different genotypes and were assessed using log-rank test. Patients were followed for up to five years after the last therapeutic dose and an event was defined as induction failure, relapse, second malignancy or death from any cause. Combined effect of associated SNPs was tested by recoding genotypes as having none, one or two and more alleles at risk. Logistic regression was used for multivariate analysis which included beside genotypes: sex, age ( < 10 years or ≥ 10 years), risk (standard or high), DFCI protocol and asparaginase formulation (E.coli or Ervinia) as categorical variables. Statistical analyses were performed with IBM SPSS Statistics for Windows, Version 22.0. (IBM Corp. Armonk, NY).
Risk prediction
Weighted genetic risk score (wGRS) method was used to predict the risk of developing ASNase induced pancreatitis based on the cumulative combined effect of all SNPs found to be associated with this toxicity in the current study. The wGRS was estimated from the number of risk alleles by calculating the sum of weighted ln(OR) for each allele as explained elsewhere. [13] The performance of the comprehensive model in classifying patients based on their individual wGRS was assessed by calculating the area under the receiver operator characteristic (ROC) curves.
Abbreviations
ALL: Acute Lymphoblastic Leukemia; ASN: Asparagine; ASNase: Asparaginase; AUC: Area Under the Curve; CI: Confidence Interval; DFCI: Dana-Farber Cancer Institute; E.coli: Escherichia coli; EFS: Event-free Survival; Erwinia: Erwinia chrysanthemi; EWAS: Exome-Wide Association Study; FDR: False Discovery Rate; HR: Hazard Ratio; NF-kB: Nuclear Factor kappaB; OR: Odds Ratio; OS: Overall Survival; PCR: Polymerase Chain Reaction; QcALL: Quebec Childhood Acute Lymphoblastic Leukemia; ROC: Receiver Operator Characteristic; SJUHC: Sainte-Justine University Hospital Centre; SNP: Single Nucleotide Polymorphism; WES: Whole Exome Sequencing; wGRS: weighted Genetic Risk Score.
Authorship contributions
M.K. designed the study; R.A. and V.G., performed experiments; F.C. performed medical chart reviews; C.L. JM.L., S.E.S., D.N. J.K, L.B.S and D.S. contributed to sample and clinical data collection and interpretation; D.S. supervised whole exome sequencing; R.A, J-F.S., CJ.X, V.G. and M.K. performed the data analysis; R.A. drafted the article; All authors revised the manuscript.
Acknowledgments
We thank ALL patients and their parents who consented to participate in genetics studies related to leukemia. Leukemia Lymphoma Society of Canada, Canadian Institutes of Health Research, Charles Bruneau Foundation and Dana-Farber Cancer Institute supported this study.
Conflicts of Interest
The authors declare no competing financial interests.
Funding
Dr. Krajinovic received grants for this project from Leukemia Lymphoma Society of Canada and Canadian Institutes of Health Research (#106458). Dana-Farber Cancer Institute ALL treatment protocols are supported by the National Cancer Institute/NIH grant 5 P01CA06848.
Editorial note
This paper has been accepted based in part on peer-review conducted by another journal and the authors’ response and revisions as well as expedited peer-review in Oncotarget.
References
1. Ko RH, Jones TL, Radvinsky D, Robison N, Gaynon PS, Panosyan EH, Avramis IA, Avramis VI, Rubin J, Ettinger LJ, Seibel NL, Dhall G. Allergic reactions and antiasparaginase antibodies in children with high-risk acute lymphoblastic leukemia: A children’s oncology group report. Cancer. 2015; 121: 4205-11. doi: 10.1002/cncr.29641.
2. Ben Tanfous M, Sharif-Askari B, Ceppi F, Laaribi H, Gagne V, Rousseau J, Labuda M, Silverman LB, Sallan SE, Neuberg D, Kutok JL, Sinnett D, Laverdiere C, et al. Polymorphisms of asparaginase pathway and asparaginase-related complications in children with acute lymphoblastic leukemia. Clin Cancer Res. 2015; 21: 329-34. doi: 10.1158/1078-0432.CCR-14-0508.
3. Pui CH, Mullighan CG, Evans WE, Relling MV. Pediatric acute lymphoblastic leukemia: where are we going and how do we get there? Blood. 2012; 120: 1165-74. doi: 10.1182/blood-2012-05-378943.
4. Hijiya N, van der Sluis IM. Asparaginase-associated toxicity in children with acute lymphoblastic leukemia. Leuk Lymphoma. 2016; 57: 748-57. doi: 10.3109/10428194.2015.1101098.
5. Duarte X, Esteves S, Neto AM, Pereira F. Incidence and risk factors for Central Nervous System thrombosis in paediatric acute lymphoblastic leukaemia during intensive asparaginase treatment: a single-centre cohort study. Br J Haematol. 2016; 174: 280-91. doi: 10.1111/bjh.14048.
6. Silverman LB, Gelber RD, Dalton VK, Asselin BL, Barr RD, Clavell LA, Hurwitz CA, Moghrabi A, Samson Y, Schorin MA, Arkin S, Declerck L, Cohen HJ, et al. Improved outcome for children with acute lymphoblastic leukemia: results of Dana-Farber Consortium Protocol 91-01. Blood. 2001; 97: 1211-8.
7. Vrooman LM, Kirov II, Dreyer ZE, Kelly M, Hijiya N, Brown P, Drachtman RA, Messinger YH, Ritchey AK, Hale GA, Maloney K, Lu Y, Plourde PV, et al. Activity and Toxicity of Intravenous Erwinia Asparaginase Following Allergy to E. coli-Derived Asparaginase in Children and Adolescents With Acute Lymphoblastic Leukemia. Pediatr Blood Cancer. 2016; 63: 228-33. doi: 10.1002/pbc.25757.
8. Liu C, Yang W, Devidas M, Cheng C, Pei D, Smith C, Carroll WL, Raetz EA, Bowman WP, Larsen EC, Maloney KW, Martin PL, Mattano LA Jr, et al. Clinical and Genetic Risk Factors for Acute Pancreatitis in Patients With Acute Lymphoblastic Leukemia. J Clin Oncol. 2016; 34: 2133-40. doi: 10.1200/JCO.2015.64.5812.
9. Mizrahi T, Leclerc JM, David M, Ducruet T, Robitaille N. ABO Group as a Thrombotic Risk Factor in Children With Acute Lymphoblastic Leukemia: A Retrospective Study of 523 Patients. J Pediatr Hematol Oncol. 2015; 37: e328-32. doi: 10.1097/MPH.0000000000000333.
10. Nowak-Gottl U, Wermes C, Junker R, Koch HG, Schobess R, Fleischhack G, Schwabe D, Ehrenforth S. Prospective evaluation of the thrombotic risk in children with acute lymphoblastic leukemia carrying the MTHFR TT 677 genotype, the prothrombin G20210A variant, and further prothrombotic risk factors. Blood. 1999; 93: 1595-9.
11. Stranger BE, Stahl EA, Raj T. Progress and promise of genome-wide association studies for human complex trait genetics. Genetics. 2011; 187: 367-83. doi: 10.1534/genetics.110.120907.
12. Mullighan CG. The molecular genetic makeup of acute lymphoblastic leukemia. Hematology Am Soc Hematol Educ Program. 2012; 2012: 389-96. doi: 10.1182/asheducation-2012.1.389.
13. De Jager PL, Chibnik LB, Cui J, Reischl J, Lehr S, Simon KC, Aubin C, Bauer D, Heubach JF, Sandbrink R, Tyblova M, Lelkova P, Steering committee of the BENEFIT study, et al. Integrating genetic risk factors into a clinical algorithm for multiple sclerosis susceptibility. Lancet neurology. 2009; 8: 1111-9. doi: 10.1016/S1474-4422(09)70275-3.
14. Kawedia JD, Liu C, Pei D, Cheng C, Fernandez CA, Howard SC, Campana D, Panetta JC, Bowman WP, Evans WE, Pui CH, Relling MV. Dexamethasone exposure and asparaginase antibodies affect relapse risk in acute lymphoblastic leukemia. Blood. 2012; 119: 1658-64. doi: 10.1182/blood-2011-09-381731.
15. Mori S, Bernardi R, Laurent A, Resnati M, Crippa A, Gabrieli A, Keough R, Gonda TJ, Blasi F. Myb-binding protein 1A (MYBBP1A) is essential for early embryonic development, controls cell cycle and mitosis, and acts as a tumor suppressor. PLoS One. 2012; 7: e39723. doi: 10.1371/journal.pone.0039723.
16. George B, Horn D, Bayo P, Zaoui K, Flechtenmacher C, Grabe N, Plinkert P, Krizhanovsky V, Hess J. Regulation and function of Myb-binding protein 1A (MYBBP1A) in cellular senescence and pathogenesis of head and neck cancer. Cancer Lett. 2015; 358: 191-9. doi: 10.1016/j.canlet.2014.12.042.
17. Owen HR, Elser M, Cheung E, Gersbach M, Kraus WL, Hottiger MO. MYBBP1a is a novel repressor of NF-kappaB. J Mol Biol. 2007; 366: 725-36. doi: 10.1016/j.jmb.2006.11.099.
18. Cai L, Deng SL, Liang L, Pan H, Zhou J, Wang MY, Yue J, Wan CL, He G, He L. Identification of genetic associations of SP110/MYBBP1A/RELA with pulmonary tuberculosis in the Chinese Han population. Hum Genet. 2013; 132: 265-73. doi: 10.1007/s00439-012-1244-5.
19. Rakonczay Z Jr, Hegyi P, Takacs T, McCarroll J, Saluja AK. The role of NF-kappaB activation in the pathogenesis of acute pancreatitis. Gut. 2008; 57: 259-67. doi: 10.1136/gut.2007.124115.
20. Luo SX, Li S, Zhang XH, Zhang JJ, Long GH, Dong GF, Su W, Deng Y, Liu Y, Zhao JM, Qin X. Genetic polymorphisms of interleukin-16 and risk of knee osteoarthritis. PLoS One. 2015; 10: e0123442. doi: 10.1371/journal.pone.0123442.
21. Azimzadeh P, Khorram Khorshid HR, Akhondi MM, Shirazi A. Association of interleukin-16 polymorphisms with disease progression and susceptibility in endometriosis. Int J Immunogenet. 2016; 43: 297-302. doi: 10.1111/iji.12281.
22. Khoshbakht T, Soosanabadi M, Neishaboury M, Kamali K, Karimlou M, Bazazzadegan N, Khorram Khorshid HR. An Association Study on IL16 Gene Polymorphisms with the Risk of Sporadic Alzheimer’s Disease. Avicenna J Med Biotechnol. 2015; 7: 128-32.
23. Bowler RP, Bahr TM, Hughes G, Lutz S, Kim YI, Coldren CD, Reisdorph N, Kechris KJ. Integrative omics approach identifies interleukin-16 as a biomarker of emphysema. OMICS. 2013; 17: 619-26. doi: 10.1089/omi.2013.0038.
24. Tong Z, Li Q, Zhang J, Wei Y, Miao G, Yang X. Association between interleukin 6 and interleukin 16 gene polymorphisms and coronary heart disease risk in a Chinese population. J Int Med Res. 2013; 41: 1049-56. doi: 10.1177/0300060513483405.
25. Liu XL, Du JZ, Zhou YM, Shu QF, Li YG. Interleukin-16 polymorphism is associated with an increased risk of ischemic stroke. Mediators Inflamm. 2013; 2013: 564750. doi: 10.1155/2013/564750.
26. Xue H, Gao L, Wu Y, Fang W, Wang L, Li C, Li Y, Liang W, Zhang L. The IL-16 gene polymorphisms and the risk of the systemic lupus erythematosus. Clin Chim Acta. 2009; 403: 223-5. doi: 10.1016/j.cca.2009.03.016.
27. Romani S, Hosseini SM, Mohebbi SR, Kazemian S, Derakhshani S, Khanyaghma M, Azimzadeh P, Sharifian A, Zali MR. Interleukin-16 gene polymorphisms are considerable host genetic factors for patients’ susceptibility to chronic hepatitis B infection. Hepat Res Treat. 2014; 2014: 790753. doi: 10.1155/2014/790753.
28. Mo CJ, Peng QL, He Y, Wang J, Xie L, Li TJ, Li S, Qin X. Positive Association Between IL-16 rs11556218 T/G Polymorphism and Cancer Risk: a Meta-analysis. Asian Pacific Journal of Cancer Prevention. 2014; 15: 4697-703. doi: 10.7314/apjcp.2014.15.11.4697.
29. Sironen A, Kotaja N, Mulhern H, Wyatt TA, Sisson JH, Pavlik JA, Miiluniemi M, Fleming MD, Lee L. Loss of SPEF2 function in mice results in spermatogenesis defects and primary ciliary dyskinesia. Biol Reprod. 2011; 85: 690-701. doi: 10.1095/biolreprod.111.091132.
30. GeneCards. SPEF2 (Sperm Flagellar 2).
31. Rousseau J, Gagne V, Labuda M, Beaubois C, Sinnett D, Laverdiere C, Moghrabi A, Sallan SE, Silverman LB, Neuberg D, Kutok JL, Krajinovic M. ATF5 polymorphisms influence ATF function and response to treatment in children with childhood acute lymphoblastic leukemia. Blood. 2011; 118: 5883-90. doi: 10.1182/blood-2011-05-355560.
32. Chen SH, Pei D, Yang W, Cheng C, Jeha S, Cox NJ, Evans WE, Pui CH, Relling MV. Genetic variations in GRIA1 on chromosome 5q33 related to asparaginase hypersensitivity. Clin Pharmacol Ther. 2010; 88: 191-6. doi: 10.1038/clpt.2010.94.
33. Fernandez CA, Smith C, Yang W, Date M, Bashford D, Larsen E, Bowman WP, Liu C, Ramsey LB, Chang T, Turner V, Loh ML, Raetz EA, et al. HLA-DRB1*07:01 is associated with a higher risk of asparaginase allergies. Blood. 2014; 124: 1266-76. doi: 10.1182/blood-2014-03-563742.
34. Mei L, Ontiveros EP, Griffiths EA, Thompson JE, Wang ES, Wetzler M. Pharmacogenetics predictive of response and toxicity in acute lymphoblastic leukemia therapy. Blood Rev. 2015; 29: 243-9. doi: 10.1016/j.blre.2015.01.001.
35. Silverman LB, Stevenson KE, O’Brien JE, Asselin BL, Barr RD, Clavell L, Cole PD, Kelly KM, Laverdiere C, Michon B, Schorin MA, Schwartz CL, O’Holleran EW, et al. Long-term results of Dana-Farber Cancer Institute ALL Consortium protocols for children with newly diagnosed acute lymphoblastic leukemia (1985-2000). Leukemia. 2010; 24: 320-34. doi: 10.1038/leu.2009.253.
36. Kearney SL, Dahlberg SE, Levy DE, Voss SD, Sallan SE, Silverman LB. Clinical course and outcome in children with acute lymphoblastic leukemia and asparaginase-associated pancreatitis. Pediatr Blood Cancer. 2009; 53: 162-7. doi: 10.1002/pbc.22076.
37. Grace RF, Dahlberg SE, Neuberg D, Sallan SE, Connors JM, Neufeld EJ, Deangelo DJ, Silverman LB. The frequency and management of asparaginase-related thrombosis in paediatric and adult patients with acute lymphoblastic leukaemia treated on Dana-Farber Cancer Institute consortium protocols. Br J Haematol. 2011; 152: 452-9. doi: 10.1111/j.1365-2141.2010.08524.x.
38. Healy J, Richer C, Bourgey M, Kritikou EA, Sinnett D. Replication analysis confirms the association of ARID5B with childhood B-cell acute lymphoblastic leukemia. Haematologica. 2010; 95: 1608-11. doi: 10.3324/haematol.2010.022459.
39. Baccichet A, Qualman SK, Sinnett D. Allelic loss in childhood acute lymphoblastic leukemia. Leuk Res. 1997; 21: 817-23.
40. BroadInstitiute. GITHUB-PICARD.
41. McKenna A, Hanna M, Banks E, Sivachenko A, Cibulskis K, Kernytsky A, Garimella K, Altshuler D, Gabriel S, Daly M, DePristo MA. The Genome Analysis Toolkit: a MapReduce framework for analyzing next-generation DNA sequencing data. Genome Res. 2010; 20: 1297-303. doi: 10.1101/gr.107524.110.
42. Li H, Handsaker B, Wysoker A, Fennell T, Ruan J, Homer N, Marth G, Abecasis G, Durbin R, Genome Project Data Processing S. The Sequence Alignment/Map format and SAMtools. Bioinformatics. 2009; 25: 2078-9. doi: 10.1093/bioinformatics/btp352.
43. Spinella JF, Mehanna P, Vidal R, Saillour V, Cassart P, Richer C, Ouimet M, Healy J, Sinnett D. SNooPer: a machine learning-based method for somatic variant identification from low-pass next-generation sequencing. BMC Genomics. 2016; 17: 912. doi: 10.1186/s12864-016-3281-2.
44. Wang K, Li M, Hakonarson H. ANNOVAR: functional annotation of genetic variants from high-throughput sequencing data. Nucleic Acids Res. 2010; 38: e164. doi: 10.1093/nar/gkq603.
45. Kumar P, Henikoff S, Ng PC. Predicting the effects of coding non-synonymous variants on protein function using the SIFT algorithm. Nat Protoc. 2009; 4: 1073-81. doi: 10.1038/nprot.2009.86.
46. Adzhubei I, Jordan DM, Sunyaev SR. Predicting functional effect of human missense mutations using PolyPhen-2. Curr Protoc Hum Genet. 2013; Chapter 7: Unit7 20. doi: 10.1002/0471142905.hg0720s76.
47. Genomes Project C, Abecasis GR, Altshuler D, Auton A, Brooks LD, Durbin RM, Gibbs RA, Hurles ME, McVean GA. A map of human genome variation from population-scale sequencing. Nature. 2010; 467: 1061-73. doi: 10.1038/nature09534.
48. Exome Variant Server, NHLBI GO Exome Sequencing Project (ESP), Seattle, WA (URL: http://evs.gs.washington.edu/EVS/) [ accessed January 2014].
49. Purcell S, Neale B, Todd-Brown K, Thomas L, Ferreira MA, Bender D, Maller J, Sklar P, de Bakker PI, Daly MJ, Sham PC. PLINK: a tool set for whole-genome association and population-based linkage analyses. Am J Hum Genet. 2007; 81: 559-75. doi: 10.1086/519795.
50. Storey JD, Taylor JE, Siegmund D. Strong control, conservative point estimation and simultaneous conservative consistency of false discovery rates: a unified approach. Journal of the Royal Statistical Society: Series B (Statistical Methodology). 2004; 66: 187-205. doi: 10.1111/j.1467-9868.2004.00439.x.
51. Labuda D, Krajinovic M, Richer C, Skoll A, Sinnett H, Yotova V, Sinnett D. Rapid detection of CYP1A1, CYP2D6, and NAT variants by multiplex polymerase chain reaction and allele-specific oligonucleotide assay. Anal Biochem. 1999; 275: 84-92. doi: 10.1006/abio.1999.4293.