
INTRODUCTION
Lung cancer is the leading cause of cancer death worldwide, and non-small cell lung cancer (NSCLC) accounts for 85% of all lung cancer cases [1]. Approximately 70% of patients with NSCLC have locally advanced disease or distant metastases at diagnosis [2]. Radiotherapy is an important treatment modality for patients with locally advanced disease, particularly those with medical conditions that make them ineligible for surgery. However, radiation-induced lung toxicity, including radiation pneumonitis (RP) and subsequent lung fibrosis, limits the therapeutic ratio and can also complicate quality of life for survivors. Dosimetric variables such as mean lung dose (MLD) and V20 (the volume of lung exposed to radiation doses of 20 Gy or more) have been identified as being associated with RP [3, 4]. However, some patients will still develop RP even when these variables are under the thresholds established for them, implicating the patients’ genetic makeup in their response to radiotherapy.
At the cellular and tissue levels, RP is characterized by injury to type I and type II alveolar cells, endothelium, and fibroblasts, followed by infiltration of inflammatory cells, proliferation of type II alveolar cells and fibroblasts, progression through the epithelial-to-mesenchymal transition (EMT), remodeling of extracellular matrix, and deposition of collagen [5, 6]. The TGFβ superfamily includes multifunctional cytokines that have different isoforms and highly specific functions, e.g. wound healing, extracellular matrix remodeling, and EMT [7]. Patients who develop RP also show increases in levels of the cytokine TGFβ1 during radiotherapy [8]. We previously found that single nucleotide polymorphisms (SNPs) in TGFβ1 could predict the risk of RP among patients receiving radiotherapy as definitive treatment for NSCLC [9]. A subgroup of the TGFβ superfamily, bone morphogenetic proteins (BMPs), is thought to influence inflammatory processes through their chemotactic effects on fibroblasts, myocytes, and inflammatory cells. In addition to the definite role of TGFβ1 in inducing EMT, BMP2 and BMP 4 are the best studied for EMT among the 20 different human BMPs. Interestingly, BMP2 and BMP4 have opposing functions: BMP2 exerts pro-inflammatory effects in endothelial activation [10], whereas BMP4 has anti-inflammatory effects in airway injury [11]. Previous study found that BMP2 was decreased and BMP4 was increased in idiopathic lung fibrosis[12]. Moreover, the ratio between BMPs and TGFβ1 correlates strongly with the EMT: increased TGFβ1 expression, decreased BMP2 expression, and increased BMP4 expression are all associated with induction of the EMT [12].
To the best of our knowledge, no studies have investigated potential associations between SNPs in BMP2 and BMP4 and the incidence of RP, and no studies have incorporated BMP SNPs into existing models based on MLD for predicting the risk of RP (grade ≥ 2 or 3) in patients after definitive radiotherapy for NSCLC. To address these gaps, we selected 8 potentially functional and tagging SNPs in BMP2 (rs170986, rs1979855, rs1980499, rs235768, and rs3178250) and in BMP4 (rs17563, rs4898820, and rs762642). Our hypothesis was that these SNPs in BMP2 and BMP4 are associated with incidence of RP in such patients and that incorporating these SNPs into an existing predictive model based on MLD could more accurately predict the risk of RP after definitive radiotherapy for NSCLC.
RESULTS
Patient characteristics
The same database was used as our previous study[13]. Characteristics of the study population are shown in Table 1. For the total population, the median age of the patients was 66 years (range 35–88 years), and most (488 [73.2%]) had stage III NSCLC. The median gross tumor volume (GTV) was 94.8 cm3 (range 1.5–1271.5 cm3), the median radiation dose was 69 Gy (range 60–87.5 Gy), and the median MLD was 17.9 Gy (range 0.15–32.741 Gy). Radiation was delivered as proton beam therapy to 139 patients (20.8%), as intensity-modulated (photon) radiotherapy to 331 patients (49.6%), and as 3-dimensional conformal radiotherapy to 174 patients (26.1%). In addition, 247 patients (36.3%) received induction chemotherapy and 560 patients (84.0%) received concurrent chemotherapy.
Table 1: Patient characteristics
Characteristic |
Training cohort |
Validation cohort |
P value |
Pooled analysis |
|---|---|---|---|---|
Age |
||||
< 66 (median) |
160 |
171 |
0.877 |
331 |
≥ 66 |
163 |
169 |
332 |
|
Sex |
||||
Male |
184 |
178 |
0.243 |
362 |
Female |
139 |
162 |
301 |
|
Race |
||||
White |
281 |
287 |
0.376 |
568 |
Other |
42 |
53 |
95 |
|
Disease Stage |
||||
I–IIIA |
139 |
157 |
0.81 |
296 |
IIIB, IV, recurrence |
160 |
172 |
333 |
|
Tumor Histology |
||||
SCC |
116 |
112 |
0.462 |
228 |
Non-SCC |
207 |
228 |
435 |
|
Karnofsky Performance |
||||
< 80 |
43 |
58 |
0.195 |
101 |
≥ 80 |
280 |
282 |
562 |
|
Induction Chemotherapy |
||||
No |
211 |
206 |
0.228 |
417 |
Yes |
112 |
134 |
246 |
|
Smoking Status |
||||
Never |
19 |
36 |
0.034 |
55 |
Former/Current |
298 |
298 |
596 |
|
Total Radiation Dose, Gy |
||||
< 69.03 (median) |
144 |
184 |
0.010 |
328 |
≥ 69.03 |
178 |
151 |
329 |
|
Gross Tumor Volume, cm3 |
||||
< 95.2 (median) |
146 |
160 |
0.418 |
306 |
≥ 95.2 |
156 |
148 |
304 |
|
Mean Lung Dose, Gy |
||||
< 17.9 (median) |
162 |
157 |
0.579 |
319 |
≥ 17.9 |
154 |
165 |
319 |
|
Radiation Modality |
||||
Photon (X-ray) |
248 |
262 |
0.633 |
510 |
Proton |
71 |
68 |
139 |
*P values of Pearson chi-square tests.
We randomized 323 patients to the training cohort and 340 patients to the validation cohort. The training cohort and the validation cohort matched well. These two cohorts showed no obvious distribution differences for age (P = 0.877), sex (P = 0.243), race (P = 0.376), disease stage (P = 0.81), tumor histology (P = 0.462), KPS (P = 0.195), induction chemotherapy (P = 0.228), GTV (P = 0.418), MLD (P = 0.579), and radiation modality (P = 0.633). Distributions of smoking status and total dose showed slight difference, however, as shown in Table 2, smoking status didn’t contribute to the incidence of grade ≥ 2 RP (hazard ratio [HR] 0.825, 95% CI 0.532–1.279, P = 0.39) or grade ≥ 3 RP (HR 1.123, 95% CI 0.489–2.58, P = 0.784). No significant associations were shown between total dose and the risk of grade ≥2 RP (HR 0.799, 95% CI 0.622–1.026, P = 0.079) or grade ≥3 RP (HR 0.657, 95% CI 0.421–1.026, P = 0.065), either.
Table 2: Univariate and multivariate Cox regression analyses to identify clinical predictors of grade ≥ 2 and 3 radiation pneumonitis
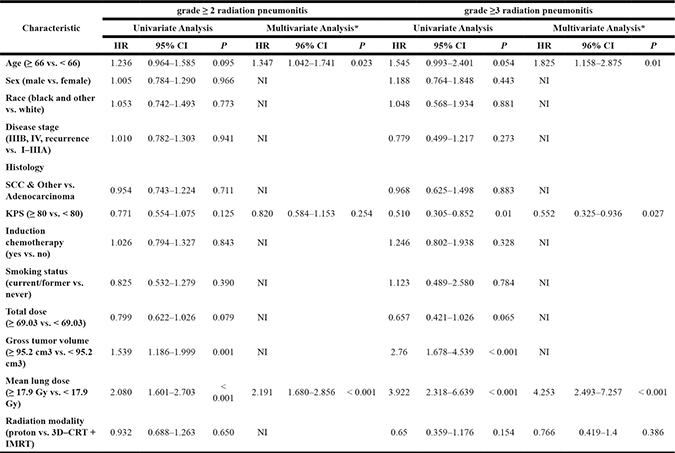
*Characteristics with a P value of <0.05 in the univariate analysis were entered into the multivariate model in a stepwise fashion and were removed if at any point the P value was > 0.20.
Abbreviations: HR, hazard ratio; CI, confidence interval; NI, not included; KPS, Karnofsky Performance Status score; SCC, squamous cell carcinoma; 3D–CRT, 3–dimensional conformal (photon) radiation therapy; IMRT, intensity–modulated (photon) radiation therapy
Clinical predictors of RP
The ability of characteristics shown in Table 1 to predict the incidence of RP of grade < 2 versus ≥ 2 or grade < 3 versus ≥ 3 were then evaluated in a stepwise fashion as follows. Variables found in univariate Cox regression analysis with P values of < 0.05 were entered into the multivariate analysis, and then removed if the P value was > 0.20. Significant associations were found in univariate analysis between the incidence of grade ≥ 2 RP and GTV (HR 1.539, 95% confidence interval [CI] 1.186–1.999, P = 0.001) or MLD (HR 2.080, 95% CI 1.601–2.703, P < 0.001) (Table 2). Because of the correlation between GTV and MLD, only MLD (the variable with larger HR and lower P value) was entered into the multivariate analysis. Multivariate analysis revealed that the risk of grade ≥ 2 RP was increased among patients who were ≥ 66 years old (HR 1.347, 95% CI 1.042–1.741, P = 0.023) and those whose MLD ≥ 17.9 Gy (HR 2.191, 95% CI 1.680–2.856, P < 0.001) (Table 2). Similar results were observed for the risk of grade ≥ 3 RP. Older patients or patients with higher MLD had greater risk of developing grade ≥ 3 RP. Besides, patients with higher KPS had the lower risk of grade ≥ 3 RP (HR 0.552, 95% CI 0.325–0.936, P = 0.027). In summary, these findings validated the already established role of MLD in the risk of RP.
Associations between SNPs in BMPs and RP
Next, we evaluated whether the BMP SNPs we genotyped (distribution shown in Supplementary Table 2) were associated with risks of grade ≥ 2 or grade ≥ 3 RP. The univariate analysis showed that BMP2 rs235768 AT/TT genotypes were strongly associated with increased risk of grade ≥ 2 RP in the training cohort (HR 2.455, 95% CI 1.243–4.847, P = 0.010), validation cohort (HR 1.92, 95% CI 1.118–3.298, P = 0.018), and the pooled analysis (HR 2.090, 95% CI 1.370–3.187, P = 0.001) (Table 3). Similar results were also found in the multivariate analysis (training cohort: HR 2.186, 95% CI 1.103–4.333, P = 0.025; validation cohort: HR 1.884, 95% CI 1.093–3.246, P = 0.023; the pooled analysis: HR 1.866, 95% CI 1.221–2.820, P = 0.004) (Table 4; Figure 1B). For BMP2 rs1980499, the univariate analysis of the training cohort suggested that genotypes CT/TT were associated with increased risk of grade ≥ 2 RP (HR 1.648, 95% CI 1.028–2.642, P = 0.038), while these results were not validated by the validation cohort (HR 1.461, 95% CI 0.946–2.256, P = 0.088). However, the pooled analysis still showed significant associations (HR 1.532, 95% CI 1.113–2.108, P = 0.009) (Table 3). The multivariate analysis in the pooled cohort also showed that BMP2 rs1980499 genotypes CT/TT were associated with increased risk of grade ≥ 2 RP (HR 1.403, 95% CI 1.014–1.941, P = 0.041) (Table 4; Figure 1A).
Table 3: Univariate analysis of associations between single-nucleotide polymorphisms (SNPs) and grade ≥ 2 radiation pneumonitis
SNPs |
Training Cohort |
Validation Cohort |
Pooled analysis |
||||||
|---|---|---|---|---|---|---|---|---|---|
HR |
95% CI |
P |
HR |
95% CI |
P |
HR |
95% CI |
P |
|
BMP2 |
|||||||||
rs170986 (CA/CC vs. AA) |
0.442 |
0.18–1.082 |
0.074 |
2.073 |
0.659–6.523 |
0.212 |
1.038 |
0.513–2.101 |
0.917 |
rs1979855 (AG/AA vs. GG) |
0.522 |
0.165–1.651 |
0.268 |
1.853 |
0.458–7.495 |
0.387 |
1.049 |
0.432–2.545 |
0.916 |
rs1980499 (CT/TT vs. CC) |
1.648 |
1.028–2.642 |
0.038 |
1.461 |
0.946–2.256 |
0.088 |
1.532 |
1.113–2.108 |
0.009 |
rs235768 (AT/TT vs. AA) |
2.455 |
1.243–4.847 |
0.010 |
1.920 |
1.118–3.298 |
0.018 |
2.090 |
1.370–3.187 |
0.001 |
rs3178250 (CT/TT vs. CC) |
0.364 |
0.177–0.748 |
0.006 |
0.954 |
0.303–3.003 |
0.936 |
0.529 |
0.288–0.969 |
0.039 |
BMP4 |
|||||||||
rs17563 (AG/GG vs. AA) |
0.844 |
0.563–1.266 |
0.413 |
1.280 |
0.843–1.942 |
0.246 |
1.047 |
0.783–1.400 |
0.756 |
rs4898820 (GT/TT vs. GG) |
1.198 |
0.739–1.940 |
0.464 |
0.933 |
0.601–1.448 |
0.757 |
1.062 |
0.768–1.469 |
0.716 |
rs762642 (AC/CC vs. AA) |
1.196 |
0.705–2.031 |
0.507 |
1.025 |
0.614–1.712 |
0.925 |
1.129 |
0.781–1.632 |
0.519 |
Abbreviation: HR, hazard ratio; CI, confidence interval.
Table 4: Multivariate analysis of associations between single-nucleotide polymorphisms (SNPs) and grade ≥ 2 radiation pneumonitis
SNPs |
Training Cohort |
Validation Cohort |
Pooled analysis |
||||||
|---|---|---|---|---|---|---|---|---|---|
HR |
95% CI |
P |
HR |
95% CI |
P |
HR |
95% CI |
P |
|
BMP2 |
|||||||||
rs170986 (CA/CC vs. AA) |
0.442 |
0.179–1.093 |
0.077 |
1.666 |
0.522–5.319 |
0.389 |
0.921 |
0.451–1.882 |
0.822 |
rs1979855 (AG/AA vs. GG) |
0.704 |
0.221–2.244 |
0.553 |
1.873 |
0.462–7.59 |
0.379 |
1.167 |
0.480–2.837 |
0.734 |
rs1980499 (CT/TT vs. CC) |
1.557 |
0.957–2.533 |
0.075 |
1.457 |
0.937–2.265 |
0.095 |
1.403 |
1.014–1.941 |
0.041 |
rs235768 (AT/TT vs. AA) |
2.186 |
1.103–4.333 |
0.025 |
1.884 |
1.093–3.246 |
0.023 |
1.866 |
1.221–2.820 |
0.004 |
rs3178250 (CT/TT vs. CC) |
0.521 |
0.251–1.081 |
0.080 |
1.107 |
0.349–3.51 |
0.863 |
0.667 |
0.362–1.230 |
0.194 |
BMP4 |
|||||||||
rs17563 (AG/GG vs. AA) |
0.885 |
0.584–1.343 |
0.567 |
1.351 |
0.888–2.055 |
0.16 |
1.115 |
0.830–1.499 |
0.470 |
rs4898820 (GT/TT vs. GG) |
1.347 |
0.811–2.236 |
0.25 |
0.909 |
0.584–1.415 |
0.673 |
1.115 |
0.800–1.555 |
0.521 |
rs762642 (AC/CC vs. AA) |
1.303 |
0.753–2.254 |
0.345 |
1.006 |
0.601–1.685 |
0.982 |
1.156 |
0.794–1.682 |
0.449 |
Note: Age, Karnofsky Performance Status score, mean lung dose were used as covariates in multivariate analysis.
Abbreviation: HR, hazard ratio; CI, confidence interval.
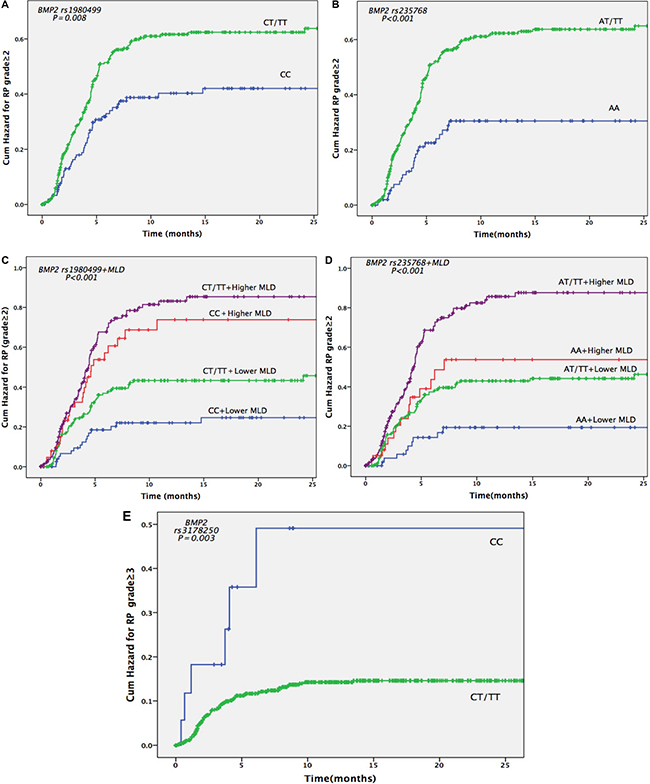
Figure 1: Cumulative probability of grade ≥ 2 or 3 radiation pneumonitis (RP) in 664 patients with non-small cell lung cancer according to BMP2 genotypes. (A) Effects of BMP2 rs1980499 genotypes CT and TT versus CC on RP grade ≥ 2. (B) Effects of BMP2 rs235768 genotypes AT and TT versus AA on RP grade ≥ 2. (C) Combined effects of BMP2 rs1980499 genotypes and MLD on the risk of RP grade ≥ 2. (D) Combined effects of BMP2 rs235768 genotypes and MLD on the risk of RP grade ≥ 2. (E) Effects of BMP2 rs3178250 genotypes CT and TT versus CC on the risk of RP grade ≥ 3. The cut-off value for higher and lower MLD is 17.9 Gy (the median dose of MLD).
The training cohort showed that BMP2 rs3178250 genotypes CT/TT were obviously associated with the risk of grade ≥ 3 RP both in the univariate analysis (HR 0.272, 95% CI 0.108–0.687, P = 0.006) and multivariate analysis (HR 0.378, 95% CI 0.148–0.936, P = 0.041) (Table 5; Table 6). However, the validation cohort did not validate these results, but the pooled analysis still showed the significant associations in uni- (HR 0.303, 95% CI 0.132–0.698, P = 0.005) and multivariate analysis (HR 0.406, 95% CI 0.175–0.942, P = 0.036) (Table 6; Figure 1E).
Table 5: Univariate analysis of associations between single-nucleotide polymorphisms (SNPs) and grade ≥ 3 radiation pneumonitis
SNPs |
Training Cohort |
Validation Cohort |
Pooled analysis |
||||||
|---|---|---|---|---|---|---|---|---|---|
BMP2 |
HR |
95% CI |
P |
HR |
95% CI |
P |
HR |
95% CI |
P |
rs170986 (CA/CC vs. AA) |
0.345 |
0.107–1.11 |
0.074 |
1.484 |
0.202–10.905 |
0.698 |
0.691 |
0.253–1.891 |
0.472 |
rs1979855 (AG/AA vs. GG) |
0.870 |
0.120–6.316 |
0.890 |
0.680 |
0.092–5.005 |
0.705 |
0.818 |
0.201–3.335 |
0.779 |
rs1980499 (CT/TT vs. CC) |
1.640 |
0.768–3.505 |
0.201 |
1.047 |
0.443–2.477 |
1.047 |
1.390 |
0.790–2.448 |
0.254 |
rs235768 (AT/TT vs. AA) |
1.957 |
0.703–5.449 |
0.199 |
1.104 |
0.421–2.893 |
0.841 |
1.534 |
0.765–3.075 |
0.228 |
rs3178250 (CT/TT vs. CC) |
0.272 |
0.108–0.687 |
0.006 |
0.524 |
0.071–3.870 |
0.524 |
0.303 |
0.132–0.698 |
0.005 |
BMP4 |
|||||||||
rs17563 (AG/GG vs. AA) |
0.806 |
0.434–1.499 |
0.496 |
2.452 |
0.853–7.048 |
0.096 |
1.182 |
0.698–2.001 |
0.535 |
rs4898820 (GT/TT vs. GG) |
1.761 |
0.748–4.148 |
0.195 |
0.926 |
0.377–2.276 |
0.926 |
0.332 |
1.357–2.514 |
0.332 |
rs762642 (AC/CC vs. AA) |
2.176 |
0.780–6.068 |
0.137 |
1.073 |
0.373–3.084 |
0.896 |
1.614 |
0.775–3.360 |
0.201 |
Abbreviation: HR, hazard ratio; CI, confidence interval.
Table 6: Multivariate analysis of associations between single-nucleotide polymorphisms (SNPs) and grade ≥ 3 radiation pneumonitis
SNPs |
Training Cohort |
Validation Cohort |
Pooled analysis |
||||||
|---|---|---|---|---|---|---|---|---|---|
BMP2 |
HR |
95% CI |
P |
HR |
95% CI |
P |
HR |
95% CI |
P |
rs170986 (CA/CC vs. AA) |
0.393 |
0.120–1.282 |
0.122 |
0.945 |
0.124–7.196 |
0.957 |
0.579 |
0.208–1.613 |
0.296 |
rs1979855 (AG/AA vs. GG) |
1.157 |
0.158–8.486 |
0.886 |
0.665 |
0.089–4.953 |
0.690 |
0.959 |
0.234–3.933 |
0.954 |
rs1980499 (CT/TT vs. CC) |
1.454 |
0.675–3.132 |
0.339 |
1.028 |
0.432–2.447 |
0.950 |
1.216 |
0.688–2.147 |
0.501 |
rs235768 (AT/TT vs. AA) |
1.655 |
0.591–4.632 |
0.337 |
1.027 |
0.390–2.704 |
0.956 |
1.307 |
0.650–2.626 |
0.452 |
rs3178250 (CT/TT vs. CC) |
0.378 |
0.148–0.936 |
0.041 |
0.701 |
0.093–5.254 |
0.729 |
0.406 |
0.175–0.942 |
0.036 |
BMP4 |
|||||||||
rs17563 (AG/GG vs. AA) |
0.809 |
0.430–1.520 |
0.509 |
2.791 |
0.968–8.050 |
0.057 |
1.275 |
0.751–2.168 |
0.369 |
rs4898820 (GT/TT vs. GG) |
1.763 |
0.746–4.168 |
0.196 |
0.957 |
0.386–2.370 |
0.924 |
1.414 |
0.761–2.627 |
0.273 |
rs762642 (AC/CC vs. AA) |
2.139 |
0.764–5.987 |
0.148 |
1.080 |
0.374–3.121 |
0.887 |
1.638 |
0.785–3.418 |
0.188 |
Note: Age, Karnofsky Performance Status score, mean lung dose were used as covariates in multivariate analysis.
Abbreviation: HR, hazard ratio; CI, confidence interval.
Incorporating SNPs into an clinical model
As shown in Figure 1C and 1D, the risk of developing RP ≥2 RP was highest in patients with BMP2 rs1980499 gentoypes CT/TT and higher MLD or BMP2 rs235768 AT/TT genotypes and higher MLD. Finally, we investigated if the two grade ≥ 2 RP associated BMP2 SNPs (rs235768 and rs1980499) could improve the prediction of the clinical model consisted of age, KPS, and MLD [4]. To do so, we calculated Harrell’s C to compare the predictive power of the models with or without the SNPs. The Harrell’s C of the model without the SNPs was 0.6117, and it significantly increased to 0.6235 after the SNPs had been added (P = 0.0105). Receiver operating characteristics curve was also used to validate our results. As shown in Figure 2, a model containing MLD and rs235768 exhibited an AUC of 0.617, which was greater than model with MLD alone (AUC = 0.596). The difference between areas was also significant (95% CI: 0.00737–0.0346, P = 0.0025).
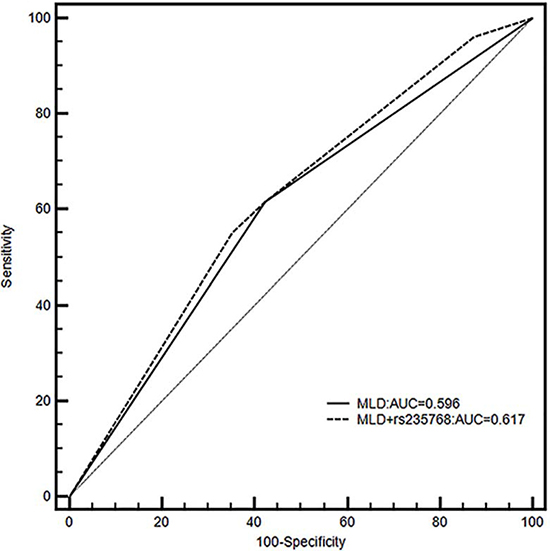
Figure 2: Receiver operating characteristics shown for models including only MLD (black line) or both MLD and rs235768 (dashed line) for grade ≥ 2 radiation pneumonitis (RP) with corresponding areas under curves (AUCs).
DISCUSSION
To the best of our knowledge, this is the first study to investigate potential associations between SNPs in BMPs and the risk of RP. We found that BMP2 SNPs rs235768 and rs1980499 were associated with risk of grade ≥ 2 RP; and rs3178250 was associated with the risk of grade ≥ 3 RP in patients with NSCLC after definitive radiotherapy. However, no association was found between BMP4 SNPs and RP. Furthermore, we validated that higher MLD was a risk factor for RP and incorporating the SNPs (rs235768 and rs1980499) into an existing MLD-based model could more effectively predict the risk of RP.
Our findings also make sense from a biological standpoint. Like the general inflammation process, RP is a severe acute inflammatory response to radiation, followed by tissue repair and pulmonary fibrosis [14]. BMP2 has complicated roles in this process, having been found to increase both during airway inflammation [15] and after exposure to pro-inflammatory stimuli such as TNFα. Early in the inflammatory process, increased expression of BMP2 could have pro-inflammatory effects by inducing endothelial dysfunction, oxidative stress, and endothelial activation [10]. In the consequent tissue repair process, BMP2 could have a novel role as a fibrosis-antagonizing cytokine through inhibiting TGFβ1 signaling [16, 17]. Therefore aberrant expression of BMP2 could aggravate inflammation, induce more severe toxicity, or attenuate normal pulmonary tissue repair during radiation-induced lung injury. BMP2 rs235768 is a non-synonymous mutation located in the coding area and may affect the protein product. Indeed, one study revealed that BMP2 rs235768 could contribute to higher expression of BMP2 in vitro [18]. These mechanisms could explain our finding that the BMP2 rs235768 AT/TT genotypes could increase the risk of RP. BMP2 rs1980499 is located within the transcriptional factor binding sites of BMP2. It may bind with either positive or inhibitory transcriptional factors and result in aberrant expression of BMP2.
One case-control study showing BMP4 rs17563 increased the expression of BMP4 mRNA and associated with the risk of cutaneous melanoma [19]. In this study we didn’t find association between BMP4 rs17563 and RP in NSCLC patients and couldn’t be able to validate the BMP4 expression.
The ability to safely escalate radiation doses has long been considered important for patients with cancer given its established dose-response relationship [20, 21]; however, results from the Radiation Therapy Oncology Group trial 0617 showed that a dose of 74 Gy (given in 2-Gy fractions with concurrent chemotherapy) not only was no better than 60 Gy with concurrent chemotherapy for patients with stage III NSCLC but also may have been harmful [22]. This result may have reflected limitations on the assessment of radiation-related toxicity and its contribution to treatment-related death. Therefore, it is crucial to identify patients who will benefit from higher radiation dose as well as those patients who are at high risk of developing radiation-related toxicity. Our inclusion of SNPs related to RP with dosimetric parameters related to RP represents a helpful tool for identifying those patients who are at increased risk of RP and thus may be less suitable for high-dose radiation. From the perspective of clinical practice, testing SNPs is inexpensive and relatively less invasive than analysis of tumor samples, as SNPs can be tested directly in peripheral blood samples, which expands the numbers of patients who can undergo this testing.
A strength of our study was the relatively large number of patients analyzed (663); indeed, this may be the largest study reported to date on associations between SNPs and RP in patients with NSCLC [23–25]. We further tested the power of adding SNPs to the established clinical RP predictive model to investigate the predictive role of SNPs in the aspect of clinical practice.
However, this study also had some limitations. First, because it is a single institution retrospective study, these findings await for validation by other institutions and other patient populations. Second, we did not investigate the mechanisms underlying our positive results. Third, only potentially functional and tagging SNPs were studied, rather than all of the SNPs in the entire gene.
In conclusion, we found that SNPs in BMP2 (rs235768, rs1980499, and rs3178250) can predict grade ≥ 2 or 3 RP after definitive radiotherapy for NSCLC, and including these SNPs in an existing model predicting RP risk based on age, performance status, and MLD could improve the predictive power.
MATERIALS AND METHODS
Study population
This retrospective analysis was approved by the institutional review board of The University of Texas MD Anderson Cancer Center, and we complied with all applicable Health Insurance Portability and Accountability Act regulations. We searched an institutional database to identify patients who had received definitive radiotherapy for NSCLC at MD Anderson from 1999 through 2014 who had (1) histologically confirmed NSCLC; (2) received a total radiation dose of ≥ 60 Gy [or ≥ 60 Gy (RBE) for proton therapy]; (3) available computed tomography (CT) or positron emission tomography (PET) scans obtained within 1 year after completing radiotherapy, to be used for detecting and scoring RP; and (4) available archived blood samples for genotyping. Patients who had received stereotactic ablative radiotherapy were excluded. A total of 663 patients met these criteria and were the subjects of this analysis.
RP was assessed at each follow-up visit after the completion of radiotherapy and graded according to the National Cancer Institute’s Common Terminology Criteria for Adverse Events version 3.0. Follow-up visits took place within the first 1–3 months after radiotherapy and then every 3 months thereafter for 2 years; those visits included interval history and physical examinations and imaging studies.
SNP selection and genotyping methods
Potentially functional and tagging SNPs were selected by using https://snpinfo.niehs.nih.gov/snpinfo/snpfunc.html. Predicted SNP functions are shown in Supplementary Table 1. The inclusion criteria were: (1) a minor allele frequency of > 5% among whites; (2) located in a transcription factor binding site, a microRNA binding site, or a non-synonymous mutation in the coding area; and (3) an R2 value for linkage disequilibrium between each SNP of < 0.8. Linkage disequilibrium was calculated with Haploview (https://www.broadinstitute.org/scientific-community/science/programs/medical-and-population-genetics/haploview/haploview) (Figure 3; numbers in the grid are R2 × 100).
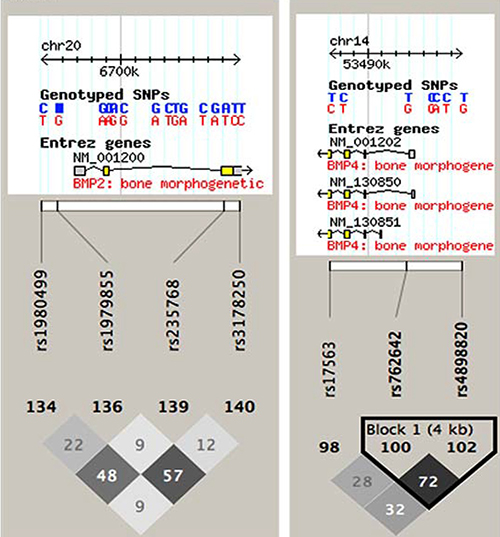
Figure 3: Linkage disequilibrium map for the single nucleotide polymorphisms studied. The numbers shown in the grid represent R2 × 100 values. R2 of our studied SNPs ranged from 0.09 to 0.72, all less than 0.80, indicating that our studies SNPs were not in high linkage disequilibrium.
Genomic DNA was extracted from the buffy coat fraction of blood samples using a blood DNA mini kit. The genomic DNA was genotyping by Taqman real-time polymerase chain reaction. The extract of genomic DNA and genotyping methods were described in our previous study [13]. For all genotypes, the assay success rate was > 95%, and concordance of repeated sample testing was 100%.
Statistical analyses
Chi-square tests were used to test for potential differences in distributions. Potential associations between RP risk and genotypes were assessed with a Cox proportional hazard model, with consideration of time to event. Characteristics with P values < 0.05 in the univariate Cox analysis were entered into the multivariate analysis; characteristics with a P value of > 0.20 in the multivariate analysis were then removed. Kaplan-Meier analysis was used to assess the effect of different genotypes on the cumulative probability of RP. All of these analyses were done with SPSS 22. Harrell’s C was calculated to determine if adding SNPs that were found to be significant in the multivariate analyses could improve the ability of a model comprising age, performance status, and MLD to predict the risk of RP. All tests were 2-sided and differences were considered significant at P < 0.05.
ACKNOWLEDGMENTS AND FUNDING
The China Scholarship Council financially supported Dr. Ju Yang during her stay in the department of Radiation Oncology, the University of Texas MD Anderson Cancer Center. This study is supported in part by Cancer Center Support (Core) Grant CA016672 from the US National Cancer Institute to The University of Texas MD Anderson Cancer Center.
CONFLICTS OF INTEREST
The authors do not see any conflicts of interest.
REFERENCES
1. Torre LA, Bray F, Siegel RL, Ferlay J, Lortet-Tieulent J, Jemal A. Global cancer statistics. CA Cancer J Clin. 2015; 65:87–108.
2. Molina JR, Yang P, Cassivi SD, Schild SE, Adjei AA. Non-small cell lung cancer: epidemiology, risk factors, treatment, and survivorship. Mayo Clin Proc. 2008; 83:584–594.
3. Schallenkamp JM, Miller RC, Brinkmann DH, Foote T, Garces YI. Incidence of radiation pneumonitis after thoracic irradiation: Dose-volume correlates. Int J Radiat Oncol Biol Phys. 2007; 67:410–416.
4. Tang C, Gomez DR, Wang H, Levy LB, Zhuang Y, Xu T, Nguyen Q, Komaki R, Liao Z. Association between white blood cell count following radiation therapy with radiation pneumonitis in non-small cell lung cancer. Int J Radiat Oncol Biol Phys. 2014; 88:319–325.
5. Trott KR, Herrmann T, Kasper M. Target cells in radiation pneumopathy. Int J Radiat Oncol Biol Phys. 2004; 58:463–469.
6. McDonald S, Rubin P, Phillips TL, Marks LB. Injury to the lung from cancer therapy: clinical syndromes, measurable endpoints, and potential scoring systems. Int J Radiat Oncol Biol Phys. 1995; 31:1187–1203.
7. Wahab NA, Mason RM. A critical look at growth factors and epithelial-to-mesenchymal transition in the adult kidney. Interrelationships between growth factors that regulate EMT in the adult kidney. Nephron Exp Nephrol. 2006; 104:e129–134.
8. Barthelemy-Brichant N, Bosquee L, Cataldo D, Corhay JL, Gustin M, Seidel L, Thiry A, Ghaye B, Nizet M, Albert A, Deneufbourg JM, Bartsch P, Nusgens B. Increased IL-6 and TGF-beta1 concentrations in bronchoalveolar lavage fluid associated with thoracic radiotherapy. Int J Radiat Oncol Biol Phys. 2004; 58:758–767.
9. Yuan X, Liao Z, Liu Z, Wang LE, Tucker SL, Mao L, Wang XS, Martel M, Komaki R, Cox JD, Milas L, Wei Q. Single nucleotide polymorphism at rs1982073:T869C of the TGFbeta 1 gene is associated with the risk of radiation pneumonitis in patients with non-small-cell lung cancer treated with definitive radiotherapy. J Clin Oncol. 2009; 27:3370–3378.
10. Csiszar A, Ahmad M, Smith KE, Labinskyy N, Gao Q, Kaley G, Edwards JG, Wolin MS, Ungvari Z. Bone morphogenetic protein-2 induces proinflammatory endothelial phenotype. Am J Pathol. 2006; 168:629–638.
11. Li Z, Wang J, Wang Y, Jiang H, Xu X, Zhang C, Li D, Xu C, Zhang K, Qi Y, Gong X, Tang C, Zhong N, et al. Bone morphogenetic protein 4 inhibits liposaccharide-induced inflammation in the airway. Eur J Immunol. 2014; 44:3283–3294.
12. Selman M, Pardo A, Kaminski N. Idiopathic pulmonary fibrosis: aberrant recapitulation of developmental programs? PLoS Med. 2008; 5:e62.
13. Yang J, Xu T, Gomez DR, Jeter M, Levy LB, Song Y, Hahn S, Liao Z, Yuan X. The Pulmonary Fibrosis Associated MUC5B Promoter Polymorphism Is Prognostic of the Overall Survival in Patients with Non-Small Cell Lung Cancer (NSCLC) Receiving Definitive Radiotherapy. Transl Oncol. 2017; 10:197–202.
14. Ding NH, Li JJ, Sun LQ. Molecular mechanisms and treatment of radiation-induced lung fibrosis. Curr Drug Targets. 2013; 14:1347–1356.
15. Rosendahl A, Pardali E, Speletas M, Ten Dijke P, Heldin CH, Sideras P. Activation of bone morphogenetic protein/Smad signaling in bronchial epithelial cells during airway inflammation. Am J Respir Cell Mol Biol. 2002; 27:160–169.
16. Wang S, Sun A, Li L, Zhao G, Jia J, Wang K, Ge J, Zou Y. Up-regulation of BMP-2 antagonizes TGF-beta1/ROCK-enhanced cardiac fibrotic signalling through activation of Smurf1/Smad6 complex. J Cell Mol Med. 2012; 16:2301–2310.
17. Gao X, Cao Y, Yang W, Duan C, Aronson JF, Rastellini C, Chao C, Hellmich MR, Ko TC. BMP2 inhibits TGF-beta-induced pancreatic stellate cell activation and extracellular matrix formation. Am J Physiol Gastrointest Liver Physiol. 2013; 304:G804–813.
18. Li JM, Zhang Y, Ren Y, Liu BG, Lin X, Yang J, Zhao HC, Wang YJ, Song L. Uniaxial cyclic stretch promotes osteogenic differentiation and synthesis of BMP2 in the C3H10T1/2 cells with BMP2 gene variant of rs2273073 (T/G). PLoS One. 2014; 9:e106598.
19. Capasso M, Ayala F, Russo R, Avvisati RA, Asci R, Iolascon A. A predicted functional single-nucleotide polymorphism of bone morphogenetic protein-4 gene affects mRNA expression and shows a significant association with cutaneous melanoma in Southern Italian population. J Cancer Res Clin Oncol. 2009; 135:1799–1807.
20. Perez CA, Bauer M, Edelstein S, Gillespie BW, Birch R. Impact of tumor control on survival in carcinoma of the lung treated with irradiation. Int J Radiat Oncol Biol Phys. 1986; 12:539–547.
21. Partridge M, Ramos M, Sardaro A, Brada M. Dose escalation for non-small cell lung cancer: analysis and modelling of published literature. Radiother Oncol. 2011; 99:6–11.
22. Bradley JD, Paulus R, Komaki R, Masters G, Blumenschein G, Schild S, Bogart J, Hu C, Forster K, Magliocco A, Kavadi V, Garces YI, Narayan S, et al. Standard-dose versus high-dose conformal radiotherapy with concurrent and consolidation carboplatin plus paclitaxel with or without cetuximab for patients with stage IIIA or IIIB non-small-cell lung cancer (RTOG 0617): a randomised, two-by-two factorial phase 3 study. Lancet Oncol. 2015; 16:187–199.
23. Yin M, Liao Z, Liu Z, Wang LE, Gomez D, Komaki R, Wei Q. Functional polymorphisms of base excision repair genes XRCC1 and APEX1 predict risk of radiation pneumonitis in patients with non-small cell lung cancer treated with definitive radiation therapy. Int J Radiat Oncol Biol Phys. 2011; 81:e67–73.
24. Niu X, Li H, Chen Z, Liu Y, Kan M, Zhou D, Li Z, Ye X, Shen S, Lv C, Lu S. A study of ethnic differences in TGFbeta1 gene polymorphisms and effects on the risk of radiation pneumonitis in non-small-cell lung cancer. J Thorac Oncol. 2012; 7:1668–1675.
25. Yin M, Liao Z, Liu Z, Wang LE, O’Reilly M, Gomez D, Li M, Komaki R, Wei Q. Genetic variants of the nonhomologous end joining gene LIG4 and severe radiation pneumonitis in nonsmall cell lung cancer patients treated with definitive radiotherapy. Cancer. 2012; 118:528–535.