
INTRODUCTION
Severe sepsis is one of the leading cause of morbidity and mortality in the intensive care unit (ICU). Despite strenuous effort to improve its survival, the mortality rate remains unacceptably high [1–3]. A priority in the management of severe sepsis is to predict its outcome, which can further help to triage patients and inform family members. A variety of prognosticating scores have been developed and validated in external cohorts for their discrimination and calibration. Among them, the sepsis-related organ failure assessment (SOFA) score received most attentions. Although SOFA score was simple to use and accurate in predicting mortality outcome, it was developed based on expert consensus [4]. Laboratory and treatment variables chosen for each organ system were somewhat arbitrary, and some empirical evidence showed that some component variables were not linearly associated with mortality in Logit scale and the cutoff points were arbitrary. For example, the hepatic score showed no independent contribution to the mortality risk [5, 6].
Conventional method to develop illness severity score was first to screen variables that were associated with mortality by bivariate analysis. However, this method has been criticized for its limitations because covariates of high correlation can be included [7]. The least absolute shrinkage and selection operator (LASSO) was developed in 1996, which was particularly suitable for variable selection among large amount of variables for the prediction of an outcome [8]. Prediction in severe sepsis is such a situation that a large amount of laboratory and treatment variables are collected. With LASSO method, coefficients of unimportant variables will be penalized to zero while important variables will be retained. The present study aimed to develop a new scoring system for the prognostication of severe sepsis. The new score was termed LASSO score because the LASSO technique was employed to train the model.
RESULTS
The initial search identified 58,976 ICU admissions in the MIMIC-III database. 15,254 of them were adult and met the criteria of severe sepsis. There were 3206 patients with complete data (Figure 1), including 1054 non-survivors and 2152 survivors. Comparisons of demographics and variables were shown in Supplementary Tables 1 and 2. Non-survivors were older than survivors (80 ± 58 vs. 70 ± 48 years; p < 0.01). Non-survivors had significantly higher A-aO2 (289.62 ± 141.16 vs. 235.04 ± 128.83 mmHg; p < 0.01), bilirubin (3.35 ± 5.98 vs. 1.83 ± 4.34 mg/dl; p < 0.01), BUN (44.47 ± 28.05 vs. 34.30 ± 25.05 mg/dl; p < 0.01), heart rate (97 ± 19 vs. 94 ± 18 /min; p < 0.01), INR (2.05 ± 1.58 vs. 1.64 ± 1.25; p < 0.01), lactate (4.03 ± 3.34 vs. 2.46 ± 1.70 mmol/l; p < 0.01), aPTT (48.1 ± 22.9 vs. 40.5 ± 19.5 s; p < 0.01), respiratory rate (22 ± 5 vs. 21 ± 5 /min; p < 0.01), WBC (15.7 ± 18.7 vs. 14.0 ± 8.4 ; p = 0.005) than those in survivors. Survivors showed significantly higher albumin (2.91 ± 0.65 vs. 2.66 ± 0.68 mg/dl; p < 0.01), bicarbonate (22.55 ± 5.43 vs. 20.38 ± 5.94 mmol/l; p < 0.01), diastolic blood pressure (63.85 ± 11.75 vs. 59.58 ± 12.71 mmHg; p < 0.01), pH (7.35 ± 0.08 vs. 7.31 ± 0.10; p < 0.01), platelet (229.6 ± 136.3 vs. 192.8 ± 138.6 ; p < 0.01), PaO2 (166.5 ± 68.8 vs. 160.2 ± 71.1 mmHg; p = 0.02), systolic blood pressure (119 ± 16 vs. 111 ± 17 mmHg; p < 0.01), body temperature (37.0 ± 0.8 vs. 36.7 ± 1.0°C; p < 0.01), GCS (13.3 ± 3.2 vs. 13.0 ± 3.0; p = 0.02), urine output (1750 ± 1652 vs. 1078 ± 1134 ml/24 h; p < 0.01) than those in non-survivors. Higher doses of dopamine (2.7 ± 7.0 vs. 1.4 ± 8.4 mg/kg/min; p < 0.01), epinephrine (0.01 ± 0.08 vs. 0.003 ± 0.02 mg/kg/min; p = 0.012), norepinephrine (0.2 ± 0.4 vs. 0.1 ± 1.4 mg/kg/min; p = 0.049) and dobutamine (0.3 ± 1.8 vs. 0.2 ± 1.1 mg/kg/min; p = 0.009) were associated with increased risk of hospital death. Mechanical ventilation was associated with increased risk of death (1002 [95%] vs. 1978 [92%]; p = 0.001). Patients with cardiac arrhythmia (330 [31%] vs. 555 [26%]; p = 0.001), lymphoma (37 [4%] vs. 30 [1%]; p < 0.01) and metastatic cancer (95 [9%] vs. 81 [4%]; p < 0.001) showed elevated risk of death. Obesity was associated with reduced risk of death (49 [5%] vs. 180 [8%]; p < 0.001).
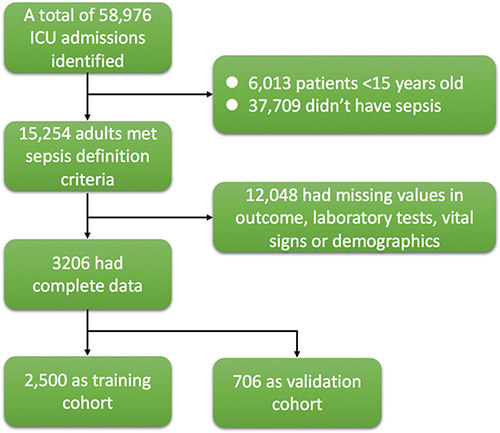
Figure 1: Flowchart of patient selection. There were 3206 patients with complete data being used for analysis, including 1054 non-survivors and 2152 survivors.
Loess smoothing curves for continuous variables are shown in Supplementary Figures 1–38. Figure 2 shows different AUC values across the range of lambda. The AUC was estimated with cross-validation technique and the largest lambda value was chosen when the cross-validation error was within one standard error of the minimum. It appeared that 65 dummy variables were retained in the model. Points assigned to each range of continuous variable and categories were shown in Supplementary Table 3. Note that the presence of obesity was assigned -2 points because it was a protective factor. Discrimination of the LASSO score was evaluated in the validation cohort and compared with other scores (Figure 3). The LASSO score showed the largest discrimination ability (AUC: 0.772; 95% CI: 0.735-0.810), followed by SAPSII (AUC: 0.741; 95% CI: 0.703-0.778), APSIII, (AUC: 0.737; 95% CI: 0.700-0.774) and LODS (AUC: 0.707; 95% CI: 0.667-0.746). The LASSO score showed significantly better discrimination than the SOFA score (AUC: 0.687; 95% CI: 0.643-0.725). The calibration of LASSO score in the validation cohort was shown in Figure 4. The calibration slope was 0.889 and the Brier value was 0.173. Figure 5 shows the relationship between LASSO score and probability of death. The gray area is the 95% confidence interval of the prediction. At a LASSO score of 30, the probability of death was approximately 60%.
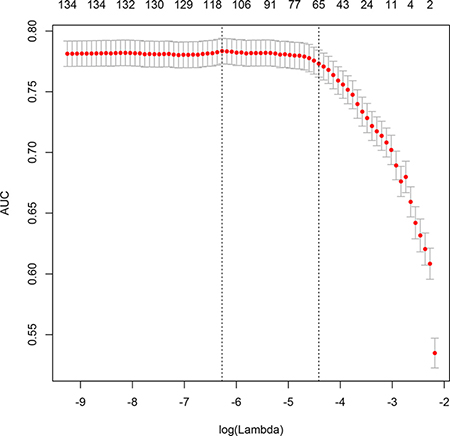
Figure 2: Different area under curve (AUC) values across the range of lambda. The AUC was estimated with cross-validation technique and the largest lambda value was chosen when the cross-validation error was within one standard error of the minimum.
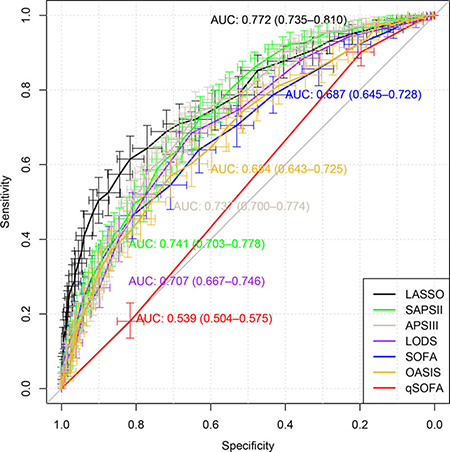
Figure 3: Discrimination of the LASSO score was evaluated in the validation cohort and compared with other scores.
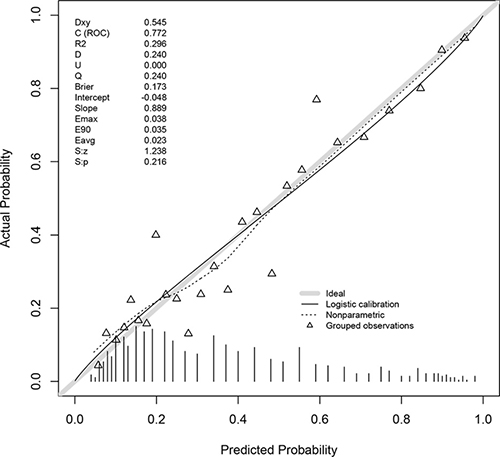
Figure 4: Calibration of LASSO score in the validation cohort. The calibration slope was 0.889 and the Brier value was 0.173.
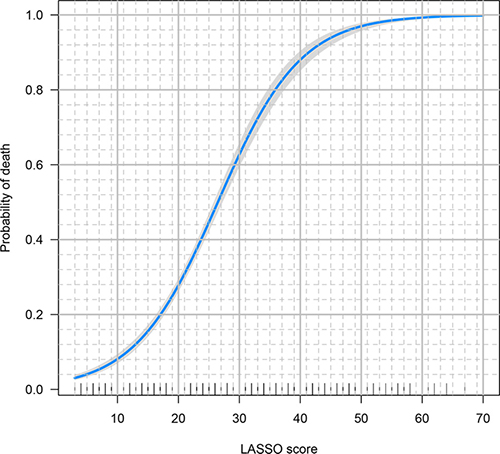
Figure 5: The relationship between LASSO score and probability of death. The gray area is the 95% confidence interval of the prediction. At a LASSO score of 30, the probability of death was approximately 60%.
DISCUSSION
The study developed a new scoring system for severe sepsis. It was coined LASSO score because the LASSO technique was employed to develop the score. Discrimination and calibration of the score were evaluated in the validation cohort and the result showed that the discrimination was comparable to other scores such as SAPSII, APSIII and LODS. However, the discrimination of LASSO was significantly better than SOFA.
There are a variety of scores being used for the triage of critically ill patients, but only SOFA has been proposed to be used specifically for sepsis [4]. However, SOFA was originally developed by expert consensus and validated in subsequent dataset. Although SOFA score has been extensively validated in subsequent studies, its discriminations varied substantially due to case mix [9]. The reported AUC of SOFA score measured on admission for mortality prediction ranged from 0.61 to 0.88 [6, 9, 10]. The components of SOFA score are related to organ dysfunctions and some important prognosticators are not included. A large body of evidence have shown that obesity was a protective factor for critically ill patients, and the effect is robust across several subgroups such as severe sepsis, acute respiratory distress syndrome and cardiac surgery [11–14]. In a meta-analysis involving six studies [13], overweight and obesity were associated with reduced odds ratio of mortality [0.83 (0.75, 0.91) p < 0.001 and 0.82 (0.67, 0.99) p = 0.04, respectively]. In our study, we used robust LASSO technique and the obesity remain consistently to be a protective factor. The LASSO score included obesity as a component and assigned minus 2 points to it. Similarly, numerous studies have found that serum lactate was an strong independent predictor of mortality [15–17], but none of the above mentioned scores included it. Since the measurement of lactate has become a clinical routine, it is time to add it as a component of severity score. The LASSO score assigned 10 points to lactate, which was in line with previous finding that lactate was a strong and independent predictor of mortality [18, 19].
There were limitations in the present study. The study used dataset from a single center. Although cross-validation was used for selection of lambda value and the LASSO score was validated in the validation dataset, the importance of external validation can never be overstated [20]. Further studies are required to evaluate the discrimination and calibration of LASSO score in external datasets. For many continuous variables, there were limited number of subjects at both ends of the whole range. Thus, points assigned to extreme values may not be stable. In the study we combine the extreme values into their next intervals. Severe sepsis was defined as infection and acute organ dysfunction, and acute organ dysfunctions were identified according to ICD-9 in electronic healthcare records. Such a definition is different from the one that has been recommended in the Sepsis-3.0 [21]. However, there is no formal diagnosis for the severe sepsis in the ICD system and we had to implement data manipulation to identify patients who had documented infection and acute organ failure. Another limitation of the study referred to the definition of routine clinical variables. The definition of “routine” may vary widely among different hospitals and institutions. However, in the study we included all variables that have been investigated in establishing other severity scores [9, 22, 23], as well as those that were found to be relevant in predicting mortality outcome such as obesity and serum lactate [11, 13, 16, 24]. Lastly, the timing of variable measurement is somewhat arbitrary. The timing was determined in accordance with other severity scores [4, 6, 22]. If the sampling time is too early, many laboratory variables are not reported, compromising the ability of the predictive performance. On the other hand, if the sampling time is late, the predictive accuracy can be improved because variables are measured close to the occurrence of the outcome, but the timeliness of the prediction is compromised. The use of 24 hours after ICU admission is a trade-off between timeliness and prediction accuracy.
In conclusion, the study developed the LASSO score for mortality prediction in patients with severe sepsis. The score had good discrimination and calibration in a randomly selected subsample. Further studies are required to validate the score in external cohorts.
MATERIALS AND METHODS
Database
The study employed publically available database Medical Information Mart for Intensive Care-III) MIMIC-III for analysis. Details of the database were fully described elsewhere [25]. Briefly, MIMIC-III comprised ICU patients admitted to the Beth Israel Deaconess Medical Center in Boston, Massachusetts from the year 2001 to 2012. It contained more than 50,000 adult distinct ICU admissions and nearly 8,000 neonates admissions. Data on laboratory tests, demographics, drugs, diagnosis, microbiology findings and survival status on hospital discharge were available. The establishment of the database was approved by the Massachusetts Institute of Technology (Cambridge, MA) and the Institutional Review Boards of Beth Israel Deaconess Medical Center (Boston, MA). Requirement for individual patient consent was waived because the project did not impact clinical care and all protected health information was deidentified [25].
Study population
Severe sepsis was defined as infection and acute organ dysfunction [26, 27], which had been described elsewhere [28]. In the electronic healthcare records, a subject was defined to have infection if his or her ICD-9 code indicated a diagnosis of infection. ICD-9 code for acute organ failure included Hypotension (458), Acute and subacute necrosis of liver (570), Transient mental disorders due to conditions classified elsewhere (293), Shock without mention of trauma (7855), Anoxic brain damage (3481), Secondary thrombocytopenia (2874), Encephalopathy (3483), unspecified thrombocytopenia(2875), Other and unspecified coagulation defects (2869), Defibrination syndrome (2866), acute kidney failure (584) and Hepatic infarction (5734). If mechanical ventilation (procedures ICD code: 9670, 9671, 9672) was required, it was also defined as organ dysfunction. Patients were excluded if 1) they were younger than 16 years old; or 2) variables contained missing values.
Variables included in the analysis
Clinical and laboratory variables that were used in routine clinical practice were included for screening. Demographic data included age, gender, admission type (emergency, post-operative, ward), and ethnicity. Laboratory variables include alveolar–arterial gradient (A-aO2), albumin, bicarbonate, bilirubin, blood urea nitrogen (BUN), coagulation profile, partial pressure of arterial carbon dioxide (PaCO2), partial pressure of arterial oxygen (PaO2), lactate, pH, lactate, platelet, electrolytes, total CO2, and white blood cell (WBC) count. Vital signs included heart rate, systolic blood pressure, mean arterial blood pressure, diastolic blood pressure, body temperature, and respiratory rate. Comorbidities included obesity, cardiac arrhythmia, lymphoma and metastatic cancer. Vasopressors and inotropes included dopamine, norepinephrine, epinephrine and dobutamine. Other variables included Glasgow Coma scale (GCS) and urine output. All variables were recorded during the first 24 hours after ICU admission. If there were several measurements, the worst one was included for the analysis. For continuous variables, the worst one may be the lowest or the highest value, we used the one with the highest points in other severity scores. All continuous variables except for the lactate had been used in other severity scores such as simplified acute physiology score (SAPS) II, acute physiological score (APS) III, Logistic organ dysfunction system (LODS), SOFA, Oxford Acute Severity of Illness Score (OASIS) and quick SOFA (qSOFA) [22, 23, 29–32].
Outcome variable was the vital status at hospital discharge. There were survivors and non-survivors. Admissions with missing information on outcome were excluded.
Statistical analysis
Continuous variables were expressed as mean and standard deviation (SD), and compared between survivors and non-survivors with t test. Categorical variables were expressed as the number and proportion, and were compared between groups with Chi-square test [33].
The complete dataset was randomly split into training and validation datasets. The training dataset comprised 78% of the total subjects, and the remaining constituted the validation cohort. Continuous variables were cut into several intervals, with each interval corresponding to a certain range of mortality risk. Firstly, continuous variables were plotted against vital status at hospital discharge and Loess smoothing function was fit to suggest the cutoff points for each variable [34]. Cutoff points corresponding to the probability of death at 0.2, 0.3, 0.4, 0.5, 0.6 and 0.7 were used. One continuous variable was made into dummy variables by the cutoff points. Then, dummy variables and categorical variables were entered into logistic regression model. Variable selection was performed by using the LASSO technique. Briefly, the technique shrunk coefficient estimates towards zero by tuning parameter lambda. Similar to the best subset selection, LASSO technique forces some of the coefficient estimates to be exactly zero when the lambda is sufficiently large. The largest value of lambda was chosen for which the cross-validation error was within one standard error of the minimum [35].
The LASSO regression model would return coefficients for each variables, and these coefficients were used to assign points to each range. The coefficient of each range was multiplied by 10 and rounded off to the nearest integer. Thereafter, the LASSO score for each patient could be calculated. A logistic regression model would be built to convert this score to the probability of hospital mortality.
The scoring system was validated in the validation dataset. Also the discrimination of LASSO score was compared with other commonly used scores such as SAPS-II, APS-III, LODS, SOFA, OASIS and qSOFA in the validation cohort. Discrimination, which measures the ability of the score to correctly classify hospital survivors and non-survivors, was represented by the area under receiver operating characteristic (ROC) curve [36]. Calibration of LASSO in the validation cohort was also evaluated. All statistical analyses were performed using R (version 3.3.2).
Ethics committee approval
The establishment of the database was approved by the Massachusetts Institute of Technology (Cambridge, MA) and the Institutional Review Boards of Beth Israel Deaconess Medical Center (Boston, MA). Requirement for individual patient consent was waived because the project did not impact clinical care and all protected health information was deidentified.
Data sharing statement
The data for the study were fully available in the website.
Authors’ contributions
Z.Z. conceived the idea and drafted the manuscript; Y.H. helped drafted the manuscript and interpret the results. Both authors approved the final manuscript. The Corresponding Author has the right to grant on behalf of all authors and does grant on behalf of all authors, a worldwide licence.
CONFLICTS OF INTEREST
There is no conflict of interest.
FUNDING
There is no funding for the study
REFERENCES
1. Zafar Iqbal-Mirza S, Ciardo P, Julián-Jiménez A. Considerations on the epidemiology of community-acquired severe sepsis. Med Clin (Barc). 2017; 148:e3. doi: 10.1016/j.medcli.2016.09.025.
2. Ou L, Chen J, Hillman K, Flabouris A, Parr M, Assareh H, Bellomo R. The impact of post-operative sepsis on mortality after hospital discharge among elective surgical patients: a population-based cohort study. Crit Care. 2017; 21:34. doi: 10.1186/s13054-016-1596-7.
3. Yébenes JC, Ruiz-Rodriguez JC, Ferrer R, Clèries M, Bosch A, Lorencio C, Rodriguez A, Nuvials X, Martin-Loeches I, Artigas A, SOCMIC (Catalonian Critical Care Society) Sepsis Working Group. Epidemiology of sepsis in Catalonia: analysis of incidence and outcomes in a European setting. Ann Intensive Care. 2017; 7:19. doi: 10.1186/s13613-017-0241-1.
4. Vincent JL, Moreno R, Takala J, Willatts S, De Mendonça A, Bruining H, Reinhart CK, Suter PM, Thijs LG. The SOFA (Sepsis-related Organ Failure Assessment) score to describe organ dysfunction/failure. On behalf of the Working Group on Sepsis-Related Problems of the European Society of Intensive Care Medicine. 1996; 707–10.
5. Moreno R, Vincent JL, Matos R, Mendonça A, Cantraine F, Thijs L, Takala J, Sprung C, Antonelli M, Bruining H, Willatts S. The use of maximum SOFA score to quantify organ dysfunction/failure in intensive care. Results of a prospective, multicentre study. Working Group on Sepsis related Problems of the ESICM. Intensive Care Med. 1999; 25:686–96.
6. Khwannimit B. A comparison of three organ dysfunction scores: MODS, SOFA and LOD for predicting ICU mortality in critically ill patients. J Med Assoc Thai. 2007; 90:1074–81.
7. Schisterman EF, Perkins NJ, Mumford SL, Ahrens KA, Mitchell EM. Collinearity and Causal Diagrams: A Lesson on the Importance of Model Specification. Epidemiology. 2017; 28:47–53. doi: 10.1097/EDE.0000000000000554.
8. Vasquez MM, Hu C, Roe DJ, Chen Z, Halonen M, Guerra S. Least absolute shrinkage and selection operator type methods for the identification of serum biomarkers of overweight and obesity: simulation and application. BMC Med Res Methodol. 2016; 16: 154. doi: 10.1186/s12874-016-0254-8.
9. Johnson AE, Pollard TJ, Shen L, Lehman LW, Feng M, Ghassemi M, Moody B, Szolovits P, Celi LA, Mark RG. MIMIC-III, a freely accessible critical care database. Sci Data. 2016; 3: 160035. doi: 10.1038/sdata.2016.35.
10. Zhang Z, Smischney NJ, Zhang H, Van Poucke S, Tsirigotis P, Rello J, Honore PM, Kuan Sen W, Ray JJ, Zhou J, Shang Y, Yu Y, Jung C, et al. AME evidence series 001-The Society for Translational Medicine: clinical practice guidelines for diagnosis and early identification of sepsis in the hospital. J Thorac Dis. 2016; 8:2654–65. doi: 10.21037/jtd.2016.08.03.
11. Angus DC, Linde-Zwirble WT, Lidicker J, Clermont G, Carcillo J, Pinsky MR. Epidemiology of severe sepsis in the United States: analysis of incidence, outcome, and associated costs of care. Crit Care Med. 2001; 29:1303–10.
12. Zhang Z, Hong Y, Liu N, Chen Y. Association of do-not-resuscitate order and survival in patients with severe sepsis and/or septic shock. Intensive Care Med. 2017; 43:715–717. doi: 10.1007/s00134-017-4690-7.
13. Vincent JL, De Mendonça A, Cantraine F, Moreno R, Takala J, Suter PM, Sprung CL, Colardyn F, Blecher S. Use of the SOFA score to assess the incidence of organ dysfunction/failure in intensive care units: results of a multicenter, prospective study. Working group on “sepsis-related problems” of the European Society of Intensive Care Medicine. Crit Care Med. 1998; 26:1793–800.
14. Le Gall JR, Klar J, Lemeshow S, Saulnier F, Alberti C, Artigas A, Teres D. The Logistic Organ Dysfunction system. A new way to assess organ dysfunction in the intensive care unit. ICU Scoring Group. JAMA. 1996; 276:802–10.
15. Raith EP, Udy AA, Bailey M, McGloughlin S, MacIsaac C, Bellomo R, Pilcher DV, Australian and New Zealand Intensive Care Society (ANZICS) Centre for Outcomes and Resource Evaluation (CORE). Prognostic Accuracy of the SOFA Score, SIRS Criteria, and qSOFA Score for In-Hospital Mortality Among Adults With Suspected Infection Admitted to the Intensive Care Unit. JAMA. 2017; 317:290–300. doi: 10.1001/jama.2016.20328.
16. Johnson AE, Kramer AA, Clifford GD. A new severity of illness scale using a subset of Acute Physiology And Chronic Health Evaluation data elements shows comparable predictive accuracy. Crit Care Med. 2013; 41:1711–8. doi: 10.1097/CCM.0b013e31828a24fe.
17. Le Gall JR. A New Simplified Acute Physiology Score (SAPS II) Based on a European/North American Multicenter Study. JAMA. 1993; 270:2957–63. doi: 10.1001/jama.1993.03510240069035.
18. Knaus WA, Wagner DP, Draper EA, Zimmerman JE, Bergner M, Bastos PG, Sirio CA, Murphy DJ, Lotring T, Damiano A. The APACHE III prognostic system. Risk prediction of hospital mortality for critically ill hospitalized adults. Chest. 1991; 100:1619–36.
19. Zhang Z. Univariate description and bivariate statistical inference: the first step delving into data. Ann Transl Med. 2016; 4:91–1. doi: 10.21037/atm.2016.02.11.
20. Cleveland WS. Robust Locally Weighted Regression and Smoothing Scatterplots. Journal of the American Statistical Association. 2012; 74:829–36. doi: 10.1080/01621459.1979.10481038.
21. Friedman J. Regularization paths for generalized linear models via coordinate descent. Journal of Statistical Software. 2010; 33:1–22.
22. Zhang Z. Model building strategy for logistic regression: purposeful selection. Ann Transl Med. 2016; 4:111–1. doi: 10.21037/atm.2016.02.15.
23. Minne L, Abu-Hanna A, de Jonge E. Evaluation of SOFA-based models for predicting mortality in the ICU: A systematic review. Crit Care. 2008; 12: R161. doi: 10.1186/cc7160.
24. Gosling P, Czyz J, Nightingale P, Manji M. Microalbuminuria in the intensive care unit: Clinical correlates and association with outcomes in 431 patients. Crit Care Med. 2006; 34:2158–66. doi: 10.1097/01.CCM.0000228914.73550.BD.
25. Ni YN, Luo J, Yu H, Wang YW, Hu YH, Liu D, Liang BM, Liang ZA. Can body mass index predict clinical outcomes for patients with acute lung injury/acute respiratory distress syndrome? A meta-analysis. Crit Care. 2017; 21: 36. doi: 10.1186/s13054-017-1615-3.
26. Wang M, Chen M, Ao H, Chen S, Wang Z. The Effects of Different BMI on Blood Loss and Transfusions in Chinese Patients Undergoing Coronary Artery Bypass Grafting. Ann Thorac Cardiovasc Surg. 2017; 23:83-90. doi: 10.5761/atcs.oa.16-00219.
27. Pepper DJ, Sun J, Welsh J, Cui X, Suffredini AF, Eichacker PQ. Increased body mass index and adjusted mortality in ICU patients with sepsis or septic shock: a systematic review and meta-analysis. Crit Care. 2016; 20: 181. doi: 10.1186/s13054-016-1360-z.
28. Ranucci M, Ballotta A, La Rovere MT, Castelvecchio S, Surgical and Clinical Outcome Research (SCORE) Group. Postoperative hypoxia and length of intensive care unit stay after cardiac surgery: the underweight paradox? PLoS ONE. 2014; 9: e93992. doi: 10.1371/journal.pone.0093992.
29. Zhang Z, Chen K, Ni H, Fan H. Predictive value of lactate in unselected critically ill patients: an analysis using fractional polynomials. J Thorac Dis. 2014; 6:995–1003. doi: 10.3978/j.issn.2072-1439.2014.07.01.
30. Zhang Z, Ni H. Normalized lactate load is associated with development of acute kidney injury in patients who underwent cardiopulmonary bypass surgery. PLoS ONE. 2015; 10: e0120466. doi: 10.1371/journal.pone.0120466.
31. Mikkelsen ME, Miltiades AN, Gaieski DF, Goyal M, Fuchs BD, Shah CV, Bellamy SL, Christie JD. Serum lactate is associated with mortality in severe sepsis independent of organ failure and shock. Crit Care Med. 2009; 37:1670–7. doi: 10.1097/CCM.0b013e31819fcf68.
32. Zhang Z, Xu X. Lactate clearance is a useful biomarker for the prediction of all-cause mortality in critically ill patients: a systematic review and meta-analysis*. Crit Care Med. 2014; 42:2118–25. doi: 10.1097/CCM.0000000000000405.
33. Gorgis N, Asselin JM, Fontana C, Heidersbach RS, Flori HR, Ward SL. Evaluation of the Association of Early Elevated Lactate With Outcomes in Children With Severe Sepsis or Septic Shock. Pediatr Emerg Care. 2017 Jan 9. [Epub ahead of print]
34. Riley RD, Ensor J, Snell KI, Debray TP, Altman DG, Moons KG, Collins GS. External validation of clinical prediction models using big datasets from e-health records or IPD meta-analysis: opportunities and challenges. BMJ. 2016; 353: 3140. doi: 10.1136/bmj.i3140.
35. Singer M, Deutschman CS, Seymour CW, Shankar-Hari M, Annane D, Bauer M, Bellomo R, Bernard GR, Chiche JD, Coopersmith CM, Hotchkiss RS, Levy MM, Marshall JC, et al. The Third International Consensus Definitions for Sepsis and Septic Shock (Sepsis-3). JAMA. 2016; 315:810–10. doi: 10.1001/jama.2016.0287.
36. Zhang Z, Chen K, Ni H, Fan H. Predictive value of lactate in unselected critically ill patients: an analysis using fractional polynomials. J Thorac Dis. 2014; 6:995–1003. doi: 10.3978/j.issn.2072-1439.2014.07.01.