
INTRODUCTION
Although thymic epithelial tumors (TETs) are relatively rare, accounting for 0.2-1.5 % of all malignancies, they are the most common primary tumor of the anterior mediastinum [1, 2]. The major prognostic indicators for TETs are tumor invasiveness and histology, which is evaluated using the Masaoka staging system [3] and is an important indicator of candidacy for complete surgical resection. Optimal therapeutic strategies and prognoses for TETs differ depending on pathological type or stage [4], especially because surgery is not always the first step in treatment. For example, early stage (stages I and II) TETs are treated with surgery, while more advanced diseases (stages III and IV) require neoadjuvant chemotherapy [5–9]. It is therefore critical to accurately identify histological type and stage before treatment.
Imaging is an important noninvasive technique for the preoperative diagnosis, staging, and follow-up monitoring of TETs [10]. Conventional computed tomography (CT) and magnetic resonance imaging (MRI), which can provide detailed morphologic information regarding tumor location, size, shape, homogeneity, and other characteristics, are routinely used for imaging TET patients [11–13]. Although conventional imaging has also shown considerable potential, it relies on qualitative parameters and the presence of many overlapping features, and TET type and stage cannot be accurately assessed using conventional imaging [14].
Diffusion-weighted imaging (DWI), a noninvasive functional MRI technique, is considered the most sensitive method for detecting differences in the diffusion of molecular water within different tissues [15]. Apparent diffusion coefficient (ADC) values generated using DWI might be useful for quantitatively evaluating the pathological classification of TETs [16, 17]. Razek et al. reported that an ADC cutoff value of 1.22 ×10⁻³ mm2/sec was best for differentiating low risk thymoma (LRT) from high risk thymoma (HRT) and thymic carcinoma (TC), with a sensitivity of 87%, specificity of 85%, and accuracy of 86% [16]. Priola et al. found that the optimal threshold ADC value for differentiating LRT from HRT was 1.309 ×10⁻³ mm2/sec, with 94.7% diagnostic sensitivity, 63.6% specificity, and 78.1% accuracy [17]. However, an important limitation of DWI should be considered when interpreting these results. Perfusion due to the incoherent motion of blood in pseudorandom capillary networks can substantially confound diffusion measurements. Intravoxel incoherent motion (IVIM) based on DWI has been proposed as a way to overcome this limitation [18–20], and studies of human tumors, including brain, liver, pancreas, and bone lesions, have begun to demonstrate its efficacy [21–24]. However, whether IVIM DWI is effective in predicting the pathological classification of TETs and the specific parameters that should be applied in IVIM DWI analyses remain largely unknown.
In this study, we evaluated the diagnostic performance of IVIM DWI parameters in preoperatively predicting TET pathological subtypes and stages. In addition, we assessed the inter-observer variability of IVIM parameters.
RESULTS
Demographic data
The clinical and demographic characteristics of the patients are summarized in Table 1. The study group consisted of 53 males and 24 females with a mean age of 51.6 ± 12.4 years (range: 19 - 77 years). The major clinical presentations of the patients were myasthenia gravis (20.8%; 16 of 77 patients), chest pain (19.5%; 15 of 77), and respiratory symptoms (33.8%; 26 of 77); 4 (5.2%) patients presented with other symptoms, and the remaining 16 patients were without any discomfort (20.8%).
Table 1: Clinical and demographic characteristics of 77 TET patients
Patient characteristics |
|
|---|---|
Age (yrs) |
|
Mean ± SD |
51.6 ± 12.4 |
Median |
52.0 |
Range |
19 - 77 |
Sex - no. (%) |
|
Males |
53 (68.8) |
Females |
24 (31.2) |
Major symptoms or signs - no. (%) |
|
No symptom |
16 (20.8) |
Myasthenia gravis |
16 (20.8) |
Chest pain |
15 (19.5) |
Respiratory symptoms |
26 (33.8) |
Other |
4 (5.2) |
Method for obtaining pathologic results - no. (%) |
|
Surgery |
65 (84.4) |
Puncture biopsy |
12 (15.6) |
Masaoka-Koga Stage - no. (%) |
|
Stage I |
11 (14.3) |
Stage II |
22 (28.6) |
Stage III |
27 (35.1) |
Stage IV |
17 (22.1) |
WHO classification - no. (%) |
|
A |
3 (3.9) |
AB |
15 (19.5) |
B1 |
5 (6.5) |
B2 |
22 (28.6) |
B3 |
9 (11.7) |
Thymic Carcinoma |
23 (29.9) |
Squamous cell carcinoma |
14 (18.2) |
Adenocarcinoma |
5 (6.5) |
Neuroendocrine carcinomas |
4 (5.2) |
Sixty-five TET cases were staged based on surgical specimens, and the remaining 12 advanced stage patients were staged based on the presence of pleural or pericardium dissimilation or hematogenous metastasis at imaging and confirmatory puncture biopsies. Using the Masaoka clinical stages, 11 (14.3%) patients were classified as clinical stage I, 22 (28.6%) as stage II, 27 (35.1%) as stage III, and 17 (22.1%) as stage IV. The pathologic subtypes of the 77 TET patients were as follows: 23 patients had LRT (types A (n = 3), AB (n = 15), and B1 (n = 5)); 31 had HRT (types B2 (n = 22) and B3 (n = 9)); and 23 had TC (squamous cell carcinoma (n = 14), adenocarcinoma (n = 5), and neuroendocrine carcinomas (n = 4)). Representative histological images of LRT (type A), HRT (type B3) and TC (thymic squamous cell carcinoma) are shown in Figure 1F, Figure 2F, and Figure 3F, respectively.
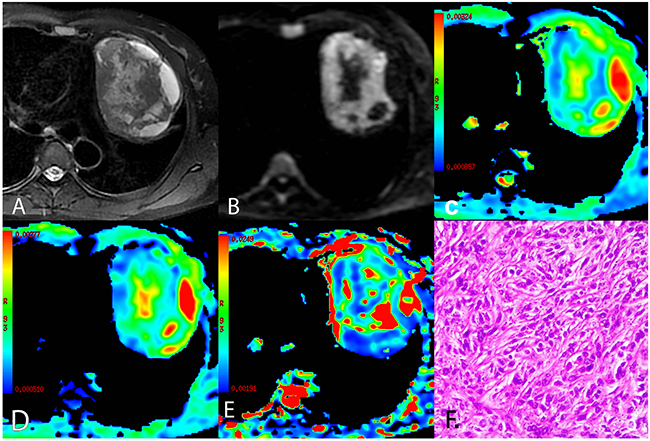
Figure 1: A representative case of low risk thymoma (type A). (A) Axial T2-weighted fat-suppressed MR image showing left-sided anterior mediastinal mass with an oval shape and smooth contours containing central cystic areas and peripheral cyst-like changes. (B) Diffusion-weighted trace image (b = 1000 sec/mm2) showing high signal intensity in solid parts and lower signal intensity in cystic areas of the tumor. (C-E) ADCmb maps, D maps, and D* maps showing varying ADCmb, D, and D* values in different parts of the tumor (parametric values increase as color changes from dark blue to red). (F) Histological image showing diffuse growth of short spindle cells with bland nuclei (HE, 200 ×). ADCmb = ADC calculated using mono-exponential model DWI (multi b-values: 0 - 1200 sec/mm2); D = ADCslow or pure diffusion coefficient; D* = ADCfast or pseudo-diffusion coefficient.
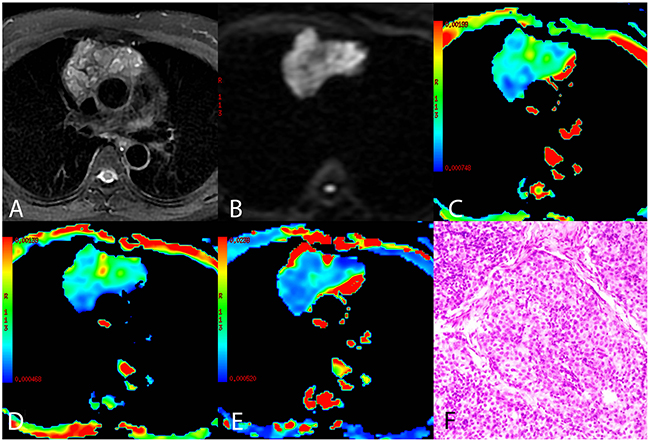
Figure 2: A representative case of high risk thymoma (type B3). (A) Axial T2-weighted fat-suppressed MR image showing an anterior mediastinal mass with an irregular shape and heterogeneous intensity. (B) Diffusion-weighted trace image (b = 1000 sec/mm2) showing higher intensity in the tumor compared to the normal chest wall muscle. (C-E) ADCmb maps, D maps, and D* maps showing varying ADCmb, D, and D* values in different parts of the tumor (parametric values increase as color changes from dark blue to red). (F) Histological image showing epithelial cells arranged in dense sheets with some size variation and round nuclei (HE, 200 ×). ADCmb = ADC calculated using mono-exponential model DWI (multi b-values: 0 - 1200 sec/mm2); D = ADCslow or pure diffusion coefficient; D* = ADCfast or pseudo-diffusion coefficient.
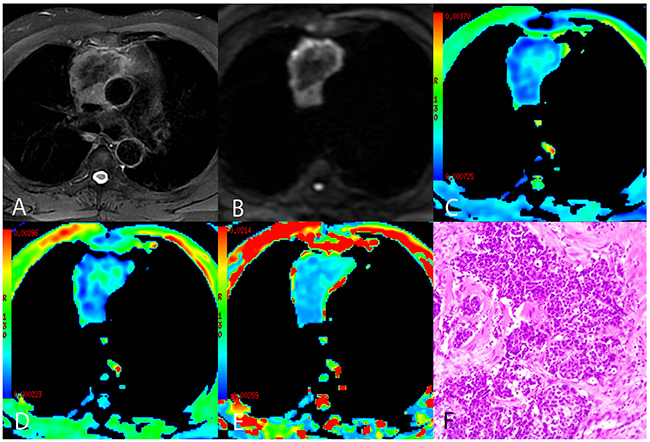
Figure 3: A representative case of thymic squamous cell carcinoma. (A) Axial T2-weighted fat-suppressed MR image showing an anterior mediastinal mass with an irregular contour containing a low-signal area. (B) Diffusion-weighted trace image (b = 1000 sec/mm2) showing peripheral high-signal intensity and central low-signal intensity. (C-E) ADCmb maps, D maps, and D* maps showing varying ADCmb, D, and D* values in different parts of the tumor (parametric values increase as color changes from dark blue to red). (F) Histological image showing carcinoma cells arranged in the nest with enlarged and atypical nuclei (HE, 200 ×). >ADCmb = ADC calculated using mono-exponential model DWI (multi b-values: 0 - 1200 sec/mm2); D = ADCslow or pure diffusion coefficient; D* = ADCfast or pseudo-diffusion coefficient.
Comparisons of conventional MRI findings depending on TET pathological type are shown in Table 2, and representative MR fat-suppressed T2-weighted images and diffusion-weighted images of LRT (type A), HRT (type B3), and TC (thymic squamous cell carcinoma) are shown in Figure 1A-B, Figure 2A-B, and Figure 3A-B, respectively. Overall, maximum tumor diameter, homogeneity, and the presence of pericardial or pleural effusion differed among patients with LRT, HRT, and TC (all P < 0.01), while mean tumor diameter and shape did not differ depending on TET subtype (P = 0.056 and 0.742, respectively).
Table 2: Comparison of conventional MRI findings for low- and high-risk thymoma and thymic carcinoma
Variable |
LRT (n=23) |
HRT(n=31) |
TC (n=23) |
P value |
|---|---|---|---|---|
Size |
||||
Maximum diameter - no. (%) |
0.003* |
|||
< 6 cm |
13 (56.5) |
4 (12.9) |
2 (8.7) |
|
6 - 9 cm |
6 (26.1) |
15 (48.4) |
13 (56.5) |
|
≥ 9 cm |
4 (17.4) |
12 (38.7) |
8 (34.8) |
|
Mean diameter (mean ± sd; cm) |
5.62 ± 2.35 |
6.33 ± 1.65 |
6.99 ± 1.45 |
0.056# |
Shape - no. (%) |
0.742 |
|||
Round |
6 (26.1) |
12 (38.7) |
9 (39.1) |
|
Oval |
11 (47.8) |
14 (45.2) |
11 (47.8) |
|
Plaque |
6 (26.1) |
5 (16.1) |
3 (13.0) |
|
Homogeneity - no. (%) |
<0.001 |
|||
Heterogeneous |
2 (8.7) |
22 (71.0) |
11 (47.8) |
|
High-signal foci |
17 (73.9) |
4 (12.9) |
2 (8.7) |
|
Low-signal foci |
4 (17.4) |
5 (16.1) |
10 (43.5) |
|
Pericardial or pleural effusion - no. (%) |
<0.001 |
|||
Yes |
2 (8.7) |
8 (25.8) |
14 (60.9) |
|
No |
21 (91.3) |
23 (74.2) |
9 (39.1) |
*Calculated using Kruskal-Wallis test;#calculated using Welch test; LRT = low-risk thymoma; HRT = high-risk thymoma; TC = thymic carcinoma.
Comparison of parameters in low-risk (LRT) and high-risk thymomas (HRT) and thymic carcinomas (TC) patients for both readings
Comparisons of the ADCmb and IVIM parameters among patients with LRT, HRT, and TC are shown in Table 3. A one-way ANOVA revealed that the mean ADCmb, D, and D* values in both readings were higher in the LRT group than in the HRT and TC groups (ADCmb: 1.55, 1.17, and 0.94 × 10⁻³ mm2/sec in the first reading (Figure 4A) and 1.56, 1.23, and 0.96 ×10⁻³ mm2/sec in the second reading; D: 1.09, 0.66, and 0.57 × 10⁻³ mm2/sec in the first reading (Figure 4B) and 1.14, 0.69, and 0.57 × 10⁻³ mm2/sec in the second reading; D*: 10.06, 4.93, and 3.35 × 10⁻³ mm2/sec in the first reading (Figure 4C) and 10.47, 5.29, and 3.90 × 10⁻³ mm2 /sec in the second reading, respectively; all P < 0.001); ADCmb and D values did not differ between the HRT and TC groups in either reading (first reading, P = 0.018 and 0.128 and second reading, P = 0.021 and 0.042 for ADCmb and D, respectively). In addition, the f value did not differ among any of the groups in either reading (P > 0.05) (Figure 4D). Representative ADCmb, D, and D* maps for patients with LRT (type A), HRT (type B3), and TC (thymic squamous cell carcinoma) are shown in Figure 1C-E, Figure 2C-E, and Figure 3C-E, respectively.
Table 3: Comparison of IVIM parameters among low- and high-risk thymoma and thymic carcinoma
Parameters |
LRT (n = 23) |
HRT (n = 31) |
TC (n = 23) |
P value |
|---|---|---|---|---|
First reading |
||||
ADCmb (×10−3 mm2/sec) |
1.55 ± 0.46 a |
1.17 ± 0.31 b |
0.94 ± 0.26 b |
< 0.001 |
D (×10−3 mm2/sec) |
1.09 ± 0.26a |
0.66 ± 0.19b |
0.57 ± 0.15b |
< 0.001 |
D* (×10−3 mm2/sec) |
10.06 ± 4.51a |
4.93 ± 2.28b |
3.35 ± 0.95c |
< 0.001 |
f |
0.36 ± 0.18 |
0.42 ± 0.15 |
0.44 ± 0.18 |
0.239 |
Second reading |
||||
ADCmb (×10−3 mm2/sec) |
1.56 ± 0.44a |
1.23 ± 0.33b |
0.96 ± 0.27b |
< 0.001 |
D (×10−3 mm2/sec) |
1.14 ± 0.31a |
0.69 ± 0.20b |
0.57 ± 0.15b |
< 0.001 |
D* (×10−3 mm2/sec) |
10.47 ± 5.49a |
5.29 ± 2.23b |
3.90 ± 1.14c |
< 0.001 |
f |
0.43 ± 0.21 |
0.47 ± 0.15 |
0.43 ± 0.17 |
0.603 |
The data are expressed as means ± standard deviation. P < 0.05 indicated a statistically significant difference among groups based on one-way ANOVA. The different letters represent significant differences between two groups based on post-hoc tests (P < 0.05/3).
LRT = low-risk thymoma; HRT = high-risk thymoma; TC = thymic carcinoma; ADCmb = ADC calculated using mono-exponential model DWI (multi b-values: 0-1200 sec/mm2); D = ADCslow or pure diffusion coefficient; D* = ADCfast or pseudo-diffusion coefficient; f = perfusion fraction.
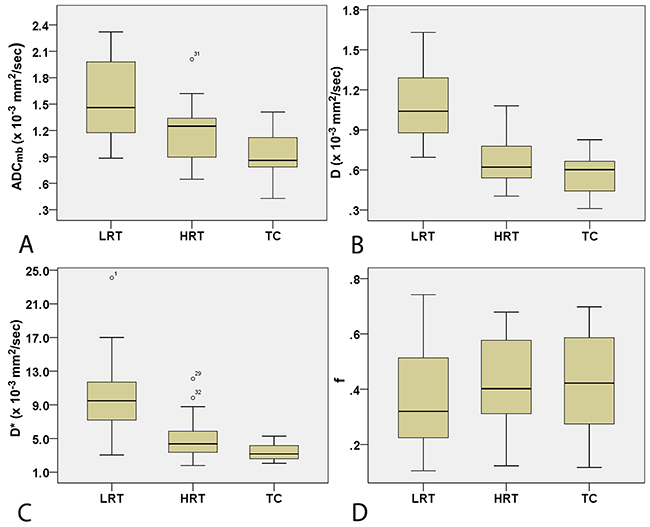
Figure 4: Box plots for ADCmb (A), D (B), D* (C), and f (D) valuesin LRT, HRT, and TC patients. LRT = low risk thymoma; HRT = high risk thymoma; TC = thymic carcinoma; ADCmb = ADC calculated using mono-exponential model DWI (multi b-values: 0-1200 sec/mm2); D = ADCslow or pure diffusion coefficient; D* = ADCfast or pseudo-diffusion coefficient; f = perfusion fraction.
Comparison of parameters in early and advanced stage TETs
Comparisons of IVIM parameters between early and advanced stage TETs groups are shown in Table 4. The mean ADCmb, D, and D* values in both readings were higher in the early stage group than in the advanced stage group (ADCmb: 1.41 vs. 1.06 × 10⁻³ mm2/sec in the first reading (Figure 5A) and 1.47 vs. 1.08 × 10⁻³ mm2/sec in the second reading; D: 0.93 vs. 0.64 × 10⁻³ mm2/sec in the first reading (Figure 5B) and 1.00 vs. 0.63 × 10⁻³ mm2/sec in the second reading; D*: 8.19 vs. 4.34 × 10⁻³ mm2/sec in the first reading (Figure 5C) and 8.62 vs. 4.77 × 10⁻³ mm2/sec in the second reading; all P < 0.05). The f values did not differ between groups in either reading (P > 0.05) (Figure 5D).
Table 4: Comparison of IVIM parameters between early and advanced stage TETs
Parameters |
Early stage (n = 33) |
Advanced stage (n = 44) |
t |
P value |
|---|---|---|---|---|
First reading |
||||
ADCmb (×10−3 mm2 /sec) |
1.41 ± 0.46 |
1.06 ± 0.31 |
3.747 |
< 0.001 |
D (×10−3 mm2/sec) |
0.93 ± 0.30 |
0.64 ± 0.23 |
4.708 |
< 0.001 |
D* (×10−3 mm2 /sec) |
8.19 ± 4.70 |
4.34 ± 2.24 |
4.346 |
< 0.001 |
f |
0.38 ± 0.18 |
0.43 ± 0.17 |
1.188 |
0.239 |
Second reading |
||||
ADCmb (×10−3 mm2 /sec) |
1.47 ± 0.45 |
1.08 ± 0.31 |
4.218 |
< 0.001 |
D (×10−3 mm2/sec) |
1.00 ± 0.34 |
0.63 ± 0.20 |
5.581 |
< 0.001 |
D* (×10−3 mm2 /sec) |
8.62 ± 5.50 |
4.77 ± 1.91 |
3.846 |
< 0.001 |
f |
0.46 ± 0.19 |
0.44 ± 0.16 |
0.460 |
0.647 |
The data are expressed as means ± standard deviation. ADCmb = ADC calculated using mono-exponential model DWI (multi b-values: 0 - 1200 sec/mm2); D = ADCslow or pure diffusion coefficient; D* = ADCfast or pseudo-diffusion coefficient; f = perfusion fraction.
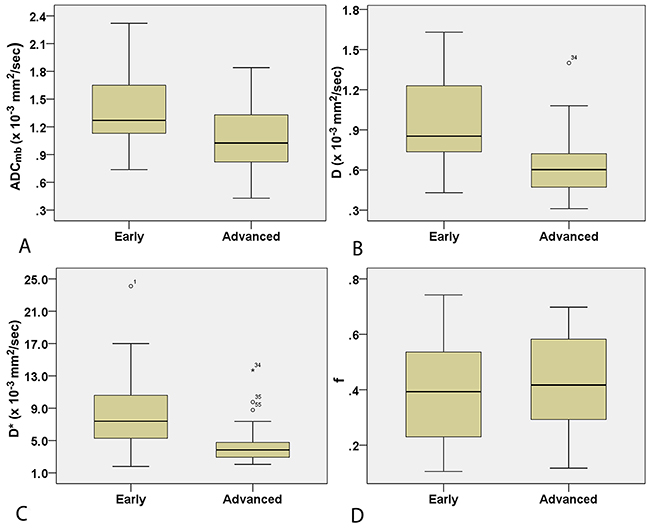
Figure 5: Box plots for ADCmb (A), D (B), D* (C), and f (D) values in early and advanced stage TETs. ADCmb = ADC calculated using mono-exponential model DWI (multi b-values: 0-1200 sec/mm2); D = ADCslow or pure diffusion coefficient; D* = ADCfast or pseudo-diffusion coefficient; f = perfusion fraction.
Analysis of diagnostic efficacy of the first reading
In ROC analyses, the D value achieved a higher diagnostic efficacy, with an AUC of 0.933, 95.7% sensitivity, 77.8% specificity, 83.1% accuracy, 64.7% positive predictive value (PPV), and 97.7% negative predictive value (NPV) for differentiating LRT from HRT and TC at the cutoff value of 0.747 × 10⁻³ mm2/sec. The AUC, sensitivity, specificity, accuracy, PPV, NPV, and cutoff values for differentiating LRT from HRT and TC were 0.793, 56.5 %, 90.7 %, 79.2 %, 70.6 %, 81.7 %, 1.415 × 10⁻³ mm2/sec for ADCmb and 0.919, 95.7 %, 77.8 %, 83.1 %, 64.7 %, 97.7 %, and 5.256 ×10⁻³ mm2/sec for D*, respectively. We then used a binary logistic regression with group as dependent variable and using D and D* as covariates to acquire P values for each patient, which were used for ROC analyses. Logistic (D, D*) achieved the highest diagnostic efficacy with an AUC of 0.959, 95.7% sensitivity, 87.0% specificity, 89.6% accuracy, 75.9% PPV, and 97.9% NPV (Table 5 and Figure 6A).
Table 5: Comparisonof the diagnostic efficacy of IVIM parameters in differentiating TETs based on WHO classification and Masaoka-Koga stage and comparisons of TET ADCs with published data
Parameters |
AUC |
Sensitivity (%) |
Specificity (%) |
Accuracy (%) |
PPV (%) |
NPV (%) |
Cutoff value |
|---|---|---|---|---|---|---|---|
LRT vs. HRT+TC |
|||||||
ADCmb (×10−3 mm2/sec) |
0.793 |
56.5 |
90.7 |
79.2 |
70.6 |
81.7 |
1.415 |
D (×10−3 mm2/sec) |
0.933 |
95.7 |
77.8 |
83.1 |
64.7 |
97.7 |
0.747 |
D* (×10−3 mm2/sec) |
0.919 |
95.7 |
77.8 |
83.1 |
64.7 |
97.7 |
5.256 |
Logistic (D, D*) # |
0.959 |
95.7 |
87.0 |
89.6 |
75.9 |
97.9 |
0.193 |
ADC (×10−3 mm2/sec) (16)* |
0.851 |
87.0 |
85.0 |
86.0 |
87.0 |
85.0 |
1.22 |
ADC (×10−3 mm2/sec) (17)§ |
0.864 |
94.7 |
63.6 |
78.1 |
- |
- |
1.309 |
Early vs. advanced stage |
|||||||
ADCmb (×10−3 mm2/sec) |
0.711 |
78.8 |
56.8 |
64.9 |
56.5 |
77.4 |
1.095 |
D (×10−3 mm2/sec) |
0.793 |
78.8 |
72.7 |
75.3 |
68.4 |
82.1 |
0.694 |
D* (×10−3 mm2/sec) |
0.789 |
78.8 |
77.3 |
77.9 |
72.2 |
82.9 |
4.88 |
ADC (×10−3 mm2/sec) (17)§ |
0.730 |
91.7 |
58.8 |
73.2 |
- |
- |
1.243 |
AUC = area under curve; PPV = positive predictive value; NPV = negative predictive value; LRT = low risk thymoma; HRT = high risk thymoma; TC = thymic carcinoma; ADCmb = ADC calculated using mono-exponential model DWI (multi b-values: 0 - 1200 sec/mm2); D = ADCslow or pure diffusion coefficient; D* = ADCfast or pseudo-diffusion coefficient.
#The results of Logistic (D, D*) were acquired using group as the dependent variable and the D and D* parameters as covariates to generate a binary logistic regression and P values for each patient. This P value was analyzed using ROC. The actual Logistic (D, D*) for LRT vs. HRT+TC model was as follows: ln[P/(1-P)] = 9.364 - 6.763D - 0.446D*.
*Results from Razek et al. for differentiating LRT from HRT+TC (16).
§Results from Priola et al. for differentiating LRT from HRT (17).
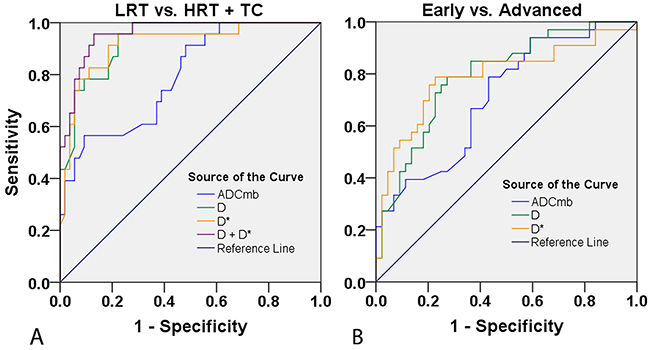
Figure 6: Receiver operating characteristic (ROC) curves for differentiating the performance of IVIM parameters in patients with different TET types based on WHO classification and Masaoka-Koga stage. (A) LRT vs. HRT and TC based on ADCmb, D, and D* values. (B) Early vs. advanced stage based on ADCmb, D, and D* values. LRT = low risk thymoma; HRT = high risk thymoma; TC = thymic carcinoma; ADCmb = ADC calculated using mono-exponential model DWI (multi b-values: 0-1200 sec/mm2); D = ADCslow or pure diffusion coefficient; D* = ADCfast or pseudo-diffusion coefficient.
The AUC, sensitivity, specificity, accuracy, PPV, NPV, and cutoff values for differentiating early from advanced stages of TETs for ADCmb, D and D* were as follows: ADCmb, 0.711, 78.8 %, 56.8 %, 64.9 %, 56.5 %, 77.4 %, and 1.095 × 10⁻³ mm2/sec; D, 0.793, 78.8 %, 72.7 %, 75.3 %, 68.4 %, 82.1 %, and 0.694 × 10⁻³ mm2/sec; and D*, 0.789, 78.8 %, 77.3 %, 77.9 %, 72.2 %, 82.9 %, and 4.88 × 10⁻³ mm2/sec (Table 5 and Figure 6B).
Inter-reader variability for ADCmb, D, D*, and f values
As shown in Table 6, the inter-observer ICC value for ADCmb was close to 1 (0.917, P < 0.001), and the ICC values for D and D* were higher than 0.75 (0.821 and 0.786, respectively, P <0.001), suggesting that these quantitative MRI parameters could be measured with a high degree of reliability. In contrast, inter-observer ICC for f values was 0.662, indicating relatively poor reliability for this measure.
Table 6: Reliability analysis between the first and second parameter measurements
Parameters |
ICC |
P value |
95% CI |
|---|---|---|---|
ADCmb (×10−3 mm2/sec) |
.917 |
< 0.001 |
0.873 - 0.947 |
D (×10−3 mm2/sec) |
.821 |
< 0.001 |
0.732 - 0.882 |
D* (×10−3 mm2/sec) |
.786 |
< 0.001 |
0.682 - 0.858 |
f (%) |
.662 |
< 0.001 |
0.515 - 0.771 |
ICC = intraclass correlation; 95% CI = 95% confidence interval; ADCmb = ADC calculated using mono-exponential model DWI (multi b-values: 0 - 1200 sec/mm2); D = ADCslow or pure diffusion coefficient; D* = ADCfast or pseudo-diffusion coefficient; f = perfusion fraction.
DISCUSSION
In the present study, we evaluated whether IVIM DWI predicted the histological type and Masaoka stage of TETs. We found that the ADCmb, D, and D* parameters differed between patients with LRT and those with HRT or TC. We also determined optimal cutoff values for and analyzed the reliability of these parameters to determine their potential utility in clinical evaluation of TETs before treatment.
Conventional MRI parameters are helpful in differentiating different TET subtypes [13, 16, 25]. As in previous studies, we found here that low-signal foci on T2WIs and pericardial or pleural effusion were more common in TCs than in low- and high-risk thymomas, and high-signal foci on T2WIs were more common in LRTs. In addition, the maximum diameters of LRTs were smaller than those of HRTs and TCs.
DWI has also been used to differentiate the different TET histological types and clinical stages [16, 17]. Enlarged nuclei, hyperchromatism, angulation of nuclear contour, and hypercellularity, in which the extracellular matrix and intra- and extracellular diffusion space for water molecules, and in turn ADC values, are reduced due to histologic characteristics, occur more frequently in HRT, TC, and advanced stage TETs than in LRT and early stage TETs [16, 17]. Similarly, we also detected a decrease in ADCmb and D values in HRT, TC, and advanced stage TETs compared to LRT and early stage TETs. Interestingly, we confirmed that the D value achieved a higher diagnostic efficacy than the ADCmb value in differentiating LRT from HRT and TC. It is possible that the D value reflects pure molecular diffusion more accurately than other measures. However, both D and ADCmb might be useful as predictive markers when evaluating TETs.
A previous study identified a correlation between tumor angiogenesis and invasiveness in TET patients [26]. Theoretically, the D* value derived from the IVIM model is influenced by microvessel density (MVD) within the tumor and should be higher in individuals with higher risk or more advanced tumor stages [27]. In contrast, our results suggest that D* values were higher in those with LRT and early stage TETs than in those with HRT or TC and advanced stage TETs. Interestingly, these findings are consistent with the results of a CT contrast enhancement study in which maximal contrast-enhanced ranges (CEmax) were higher in low risk subtypes of thymoma (type A and AB) than in other TETs [11]. Similarly, this unique perfusion or blood supply feature of TETs may be explained by a study which demonstrated that the short-spindled variant (57% histologic patterns of thymoma type A and AB) was composed of oval to short spindle cells typically arranged in a hemangiopericytic or microcystic pattern [28]. Those findings, together with our results, indicate that D* might be valuable for accurate prediction of TET type and stage.
Interestingly, f values did not differ among the different patient groups. Acquiring multiple b value DWIs of the chest remains technically challenging, and images may be influenced by motion artifacts related to breathing and cardiovascular pulsation and susceptibility artifacts associated with air-tissue interfaces [15]; here, we used an echo planar imaging (EPI) sequence with array spatial sensitivity encoding technique (ASSET) and respiratory trigger to reduce these artifacts. However, additional studies are needed to examine these issues.
In this study, we also evaluated the diagnostic efficacy of IVIM parameters in differentiating TET types and stages. D and D*, with AUCs of 0.933 and 0.919, respectively, performed relatively well, while the binary logistic regression analysis of both D and D* had the highest efficacy, with an AUC of 0.959, in differentiating LRT from HRT and TC. IVIM DWI may therefore be a useful supplement to conventional MRI parameters in TET typing.
As in a previous study [17], we also found that neither ADCmb nor IVIM parameters performed particularly well in differentiating early from advanced TETs. However, TETs of all types can follow an aggressive clinical course [2], which might explain at least in part this relatively low performance.
An ICC analysis was performed to examine the reliability of the measurements performed by two independent radiologists in this study. The ICC value for ADCmb was close to 1 (0.917), and the ICC value for D was higher than 0.75 (0.821), suggesting that the measurements were reliable. However, the ICC values of 0.786 for D* and 0.662 for f reveal that consistency in the measurement of these two parameters was relatively poor.
Both full and segmented fitting algorithms are frequently used in studies employing IVIM. The results of a recent study suggest that segmented fitting, which was used here, is preferable to full fitting, especially when the number of b-values is limited and SNR is lower [29]. Unlike several previous studies, we used D* rather than D+D* in first exponent of equation 1 in our IVIM model. We justify this approximation by noting that, because D* is usually larger than D by an order of magnitude, the slow diffusion represented by D contributes very little to the signal when b values are low.
Some limitations of this study should be considered when interpreting the results. First, we did not compare our findings to tumor perfusion data acquired using dynamic contrast enhanced images. Second, twelve advanced stage TET patients did not undergo surgery owing to widespread invasion or hematogenous metastasis identified by puncture biopsies and staged based on imaging findings; this may have introduced bias into our analysis. Third, ROIs were drawn manually, which might have introduced a sampling bias; the application of histogram analysis may improve diagnostic efficacy in future studies. Finally, negative results were obtained for some f value measurements; the meaning of these values is unclear and should be examined further.
In conclusion, our results suggest that several parameters from IVIM DWI, including ADCmb, D, and D*, may be useful in predicting TET pathological classification and, together with routine MRI parameters, might help surgeons preoperatively stage TET patients.
MATERIALS AND METHODS
Subjects
This retrospective single-center study was approved by the Ethics Committee of Tangdu Hospital of the Fourth Military Medical University, and informed consent was waived. The study was conducted in accordance with the Declaration of Helsinki. Between December 2014 and May 2016, 157 consecutive patients with suspected TETs underwent routine MRI evaluation and IVIM DWI of the chest. Of these, 36 patients who were not diagnosed with TETs based on pathological evaluation, 15 patients for whom neither surgery nor biopsy were performed, 9 patients for whom images were of poor image quality or had motion artifacts, 12 patients with solid tumor portions < 2.0 cm in size, and 8 patients who received corticosteroid therapy before MRI examination were excluded. The final study population was comprised of 77 patients (53 men, 24 women; mean age, 52 years; age range, 19-77 years) newly diagnosed with TETs according to the inclusion and exclusion criteria (Table 1 and Figure 7).
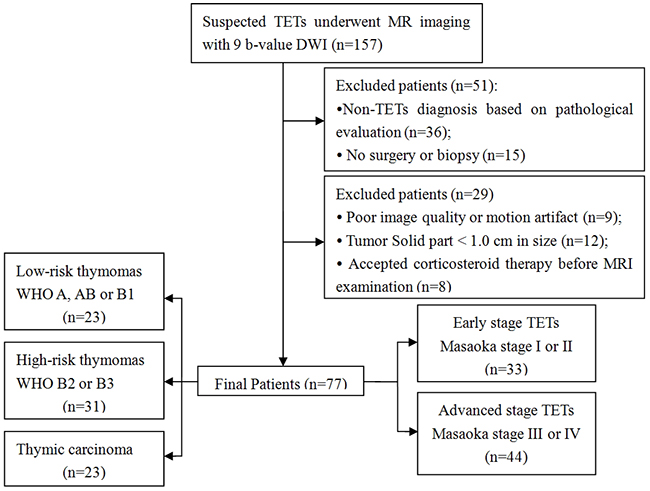
Figure 7: Flow diagram showing patient selection strategy and inclusion and exclusion criteria.
Thorax MRI protocol
All MR examinations of the thorax were performed using a 3.0-T whole-body system (MR750, GE Healthcare, Milwaukee, WI) with a 40-mT/m maximum gradient capability and a standard 8 channel torso coil. Conventional MRI and multi-b value DWI were performed in the same sequence during the same examination. The conventional MRI protocol included respiratory and electrocardiographic gating, T1-weighted spin-echo in the axial plane (repetition time (TR)/echo time (TE), 857 ms/8 ms; matrix size, 288×160; field of view (FOV), 40 cm × 40 cm; number of excitations (NEX), 1; slice thickness, 5 mm; gap, 0.5 mm), T2-weighted fast spin echo in the axial (TR/TE, 4,000 ms/81 ms; matrix size, 288 × 288; FOV, 40 cm × 40 cm; NEX, 1; slice thickness, 5 mm; gap, 0.5 mm) and coronal planes (TR/TE, 4200 ms/78 ms; matrix size, 288×288; field of view, 40 cm × 40 cm; number of excitations, 2; slice thickness, 5 mm; gap, 1.0 mm), and axial T2-weighted turbo spin-echo images with fat suppression (TR/TE, 10,000 ms/182 ms; matrix size, 320×320; field of view, 40 cm × 40 cm; number of excitations, 2; slice thickness, 5 mm; gap, 0.5 mm).
Subsequently, IVIM DWI sequences with 9 b values (0, 25, 50, 100, 150, 200, 500, 800, 1000, and 1200 sec/mm2) were performed with a single-shot diffusion-weighted spin-echo echo-planar sequence. We used the respiratory and electrocardiographic triggering and chemical shift selective fat-suppression techniques to reduce artifacts. The lookup table of gradient directions was modified to allow multiple b value measurements in one series. Parallel imaging was used with an acceleration factor of 2. A local shim box covering the whole thorax was applied to minimize susceptibility to artifacts. Other parameters were as follows: TR/TE, 6,000 ms/51 ms; matrix size, 96 × 128; field of view, 40 cm × 40 cm; slice thickness, 5 mm; gap, 0.5 mm. As b values increased, the NEX was also increased from one to six to ensure a good signal-to-noise ratio (SNR). The total scan time was approximately 5 - 6 minutes.
IVIM DW MRI analysis
According to IVIM, the relationship between signal variation and b values can be expressed using Equation (1) [27]:
Sb/S0 = f exp(-b D*) + (1-f) exp(-b D) (1)
where S0 and Sb are the signal intensities at a b value of 0 sec/mm2 and each b value other than 0 sec/mm2, respectively; D is the true diffusion coefficient that reflects random motion of intra- and intercellular water molecules (slow component of diffusion); f is the fraction of the diffusion linked to microcirculation, and D* is the diffusion parameter representing incoherent microcirculation within the voxel (perfusion-related diffusion, or fast component of diffusion).
Considering that D* is significantly greater than D [19, 27], the influence of D* on signal decay can be neglected for b values greater than 200 sec/mm2. Equation (1) can then be simplified, and the estimation of D can be obtained using only b values greater than 200 sec/mm2, with a simple linear fit as described in Equation (2):
Sb/S0 =exp(-b D) (2)
Hence, for high b values (500, 800, 1000, and 1200 sec/mm2), Sb was first fitted to Equation (2) using a linear model, and the true diffusion coefficient D was calculated. The f and D* values were calculated using a nonlinear regression algorithm based on Equation (1).
The ADCmb value was calculated by fitting the b0 image and DW images at each b value other than 0 sec/mm2 into the conventional ADC equation (Eq. (3)) [27]:
Sb/S0 = exp(-b ADC) (3)
MRI data processing and quantitative analysis
All data were analyzed and processed on a GE ADW4.6 workstation. Routine MRI features were analyzed by a single experienced radiologist, G.-F.L., with 8 years of experience in thoracic MR imaging. The observer was aware that the patients had TETs, but he was blinded to the histological subtypes of the tumors. The routine MR images were analyzed to determine the longest and mean diameter of tumor, shape, homogeneity, and presence of pericardial or pleural effusion. The longest diameter of the tumor was measured at the level where the tumor appeared largest on the cross-sectional image. Based on this, tumors were divided into three groups: < 6.0 cm, 6 - 9 cm, and ≥ 9.0 cm. Mean diameters were calculated as (a + b + c) /3, and the maximal cross-section was used to measure the long and short diameters [11]. Tumor shape was evaluated based on the ratio of the long axis diameter to the short one and was classified as round if the long- to short-axis ratio was less than or equal to 1.5, oval if the ratio was greater than 1.5 but less than 2.0, or plaque if the ratio was greater than or equal to 2.0. The overall signal intensity homogeneity of the tumors was recorded as homogeneous or heterogeneous. The presence of high- and low-signal foci was assessed as a partial signal intensity within a tumor on T2-weighted images [25]. The presence of pericardial or pleural effusions was also evaluated.
The mean values of all IVIM parameters were measured independently by two experienced radiologists, Y.-C.H. and G.-F. L, with 12 and 8 years of experience in thoracic MR imaging, respectively. First, they reviewed the conventional MR images carefully to locate the solid part of each tumor. Next, multi-b-value data were analyzed. A freehand region of interest (ROI) was traced using an electronic cursor and was placed to include the solid tumor elements based on the relative maximum signal intensity on the DW image (bright area, b=1000 sec/mm2, as shown in Figure 1B, Figure 2B and Figure 3B) and the relative minimum ADC value in the ADC map (deep-blue area, as shown in Figure 1C, Figure 2C, and Figure 3C), avoiding large vessels and hemorrhagic, calcified, cystic, and necrotic areas. The mean ROI area was 65.2 ± 24.6 mm2 (range, 26.0 - 120.0 mm2). The IVIM parameter maps were generated automatically (as shown in Figure 1C-E, Figure 2C-E, and Figure 3C-E) and the mean ADC, D, D*, and f values within the ROIs were obtained. The intra-class correlations (ICC) of the two measurements were analyzed to evaluate the consistency of the measurements taken by the two experimenters. The subsequent investigation of diagnostic efficacy was based on the first readings.
Pathologic diagnosis
Final diagnoses were determined by surgical or puncture biopsy specimens and confirmed by histopathological examination. Pathologic analysis was performed by an expert in the pathology department who was blinded to the clinical and MR findings. Tissue samples obtained from the specimens were processed and stained for hematoxylin and eosin (H&E) using standard protocols. TETs were divided into the following three subgroups based on the criteria of the 2004 World Health Organization (WHO) histological classification guidelines and the Jeong simplified classification of thymic tumors [30, 31]: LRT (types A, AB, and B1), HRT (types B2 and B3), and TC.
TETs were staged according to the following Masaoka-Koga clinical staging system [3]: Stage I: the capsule is intact and microscopic pleural involvement is absent; stage II: the tumor involves surrounding pleura or mediastinal fat, or microscopic pleural involvement is present; stage III: the tumor involves surrounding tissues (pericardium, major blood vessels, or lung); stage IV: the tumor diffuses into the pleura or pericardium (stage IVa), or lymphatic or hematogenous metastasis (stage IVb).
Statistical analysis
Numerical variables are shown as means with standard deviation. The Kolmogorov–Smirnov (K–S) test was used to assess the normality of data distributions. Binary logistic regression analysis was used to evaluate the effects of multiple parameters in combination. Between-group comparisons of conventional MRI features (including tumor shape, homogeneity, and the presence of pericardial or pleural effusions) were conducted using the chi-square test or Fisher’s exact test. Between-group comparisons of tumor mean diameter and maximum diameter were conducted using ANOVAs and Kruskal-Wallis tests, respectively. Differences in the values of the ADCmb, D, D*, and f parameters for TETs were compared among LRT, HRT and TC groups using one-way ANOVA, and multiple post hoc comparisons were performed using the Bonferroni (equal variances assumed) and Dunnett’s T3 (equal variances not assumed) tests. Differences in the values of the ADCmb, D, D*, and f parameters between early (Masaoka stage I and II) and advanced (Masaoka stage III and IV) stage TETs were evaluated using independent sample t-tests. Receiver operating characteristic curve (ROC) analyses were performed to determine optimum thresholds for differentiating the defined groups based on various parameters and to calculate sensitivity, specificity, and area under the curve (AUC) values. ICC was used to estimate the agreement between two readings and was interpreted as poor if it was less than 0.4, moderate when it was ≥ 0.4 but < 0.75, and good when it was > 0.75. P < 0.05 indicated a statistically significant difference; P < 0.05/3 was used for post-hoc tests. IBM SPSS 20.0 software (IBM Corp, Chicago, IL, USA) was used for statistical analysis.
ACKNOWLEDGMENTS
We would like to thank Dr. Xiaocheng Wei at GE Healthcare China for providing technical support regarding the appropriate application of the multiple b-value DWI sequence.
This work was supported by the Tangdu Hospital Development Foundation for Science and Technology Innovation (No. 2015JCYJ010) and Shaanxi Provincial Social Development Science and Technology Project (No. 2016SF-211).
CONFLICTS OF INTEREST
The authors declare no conflicts of interest.
REFERENCES
1. Engels EA. Epidemiology of thymoma and associated malignancies. J Thorac Oncol. 2010; 5:S260-265.
2. Weis CA, Yao X, Deng Y, Detterbeck FC, Marino M, Nicholson AG, Huang J, Strobel P, Antonicelli A, Marx A, Contributors to the IRD. The impact of thymoma histotype on prognosis in a worldwide database. J Thorac Oncol. 2015; 10:367-372.
3. Masaoka A, Monden Y, Nakahara K, Tanioka T. Follow-up study of thymomas with special reference to their clinical stages. Cancer. 1981; 48:2485-2492.
4. Ried M, Marx A, Gotz A, Hamer O, Schalke B, Hofmann HS. State of the art: diagnostic tools and innovative therapies for treatment of advanced thymoma and thymic carcinoma. Eur J Cardiothorac Surg. 2016; 49:1545-1552.
5. Huang J, Detterbeck FC, Wang Z, Loehrer PJ Sr. Standard outcome measures for thymic malignancies. J Thorac Oncol. 2010; 5:2017-2023.
6. Falkson CB, Bezjak A, Darling G, Gregg R, Malthaner R, Maziak DE, Yu E, Smith CA, McNair S, Ung YC, Evans WK, Lung Cancer Disease Site Group of Cancer Care Ontario’s Program in Evidence-Based Care. The management of thymoma: a systematic review and practice guideline. J Thorac Oncol. 2009; 4:911-919.
7. Okuma Y, Hosomi Y, Watanabe K, Yamada Y, Horio H, Maeda Y, Okamura T, Hishima T. Clinicopathological analysis of thymic malignancies with a consistent retrospective database in a single institution: from Tokyo Metropolitan Cancer Center. BMC Cancer. 2014; 14:349.
8. Kondo K. Tumor-node metastasis staging system for thymic epithelial tumors. J Thorac Oncol. 2010; 5:S352-356.
9. Fujii Y. Published guidelines for management of thymoma. Thorac Surg Clin. 2011; 21:125-129.
10. Marom EM. Advances in thymoma imaging. J Thorac Imaging. 2013; 28:69-80.
11. Hu YC, Wu L, Yan LF, Wang W, Wang SM, Chen BY, Li GF, Zhang B, Cui GB. Predicting subtypes of thymic epithelial tumors using CT: new perspective based on a comprehensive analysis of 216 patients. Sci Rep. 2014; 4:6984.
12. Ozawa Y, Hara M, Shimohira M, Sakurai K, Nakagawa M, Shibamoto Y. Associations between computed tomography features of thymomas and their pathological classification. Acta Radiol. 2016; 57:1318-1325.
13. Sadohara J, Fujimoto K, Muller NL, Kato S, Takamori S, Ohkuma K, Terasaki H, Hayabuchi N. Thymic epithelial tumors: comparison of CT and MR imaging findings of low-risk thymomas, high-risk thymomas, and thymic carcinomas. Eur J Radiol. 2006; 60:70-79.
14. Moon JW, Lee KS, Shin MH, Kim S, Woo SY, Lee G, Han J, Shim YM, Choi YS. Thymic epithelial tumors: prognostic determinants among clinical, histopathologic, and computed tomography findings. Ann Thorac Surg. 2015; 99:462-470.
15. Razek AA. Diffusion magnetic resonance imaging of chest tumors. Cancer Imaging. 2012; 12:452-463.
16. Abdel Razek AA, Khairy M, Nada N. Diffusion-weighted MR imaging in thymic epithelial tumors: correlation with World Health Organization classification and clinical staging. Radiology. 2014; 273:268-275.
17. Priola AM, Priola SM, Giraudo MT, Gned D, Fornari A, Ferrero B, Ducco L, Veltri A. Diffusion-weighted magnetic resonance imaging of thymoma: ability of the Apparent Diffusion Coefficient in predicting the World Health Organization (WHO) classification and the Masaoka-Koga staging system and its prognostic significance on disease-free survival. Eur Radiol. 2015; 26:2126-2138.
18. Le Bihan D, Breton E, Lallemand D, Grenier P, Cabanis E, Laval-Jeantet M. MR imaging of intravoxel incoherent motions: application to diffusion and perfusion in neurologic disorders. Radiology. 1986; 161:401-407.
19. Le Bihan D, Breton E, Lallemand D, Aubin ML, Vignaud J, Laval-Jeantet M. Separation of diffusion and perfusion in intravoxel incoherent motion MR imaging. Radiology. 1988; 168:497-505.
20. Federau C, Maeder P, O’Brien K, Browaeys P, Meuli R, Hagmann P. Quantitative measurement of brain perfusion with intravoxel incoherent motion MR imaging. Radiology. 2012; 265:874-881.
21. Hu YC, Yan LF, Wu L, Du P, Chen BY, Wang L, Wang SM, Han Y, Tian Q, Yu Y, Xu TY, Wang W, Cui GB. Intravoxel incoherent motion diffusion-weighted MR imaging of gliomas: efficacy in preoperative grading. Sci Rep. 2014; 4:7208.
22. Woo S, Lee JM, Yoon JH, Joo I, Han JK, Choi BI. Intravoxel incoherent motion diffusion-weighted MR imaging of hepatocellular carcinoma: correlation with enhancement degree and histologic grade. Radiology. 2014; 270:758-767.
23. Kang KM, Lee JM, Yoon JH, Kiefer B, Han JK, Choi BI. Intravoxel incoherent motion diffusion-weighted MR imaging for characterization of focal pancreatic lesions. Radiology. 2014; 270:444-453.
24. Bourillon C, Rahmouni A, Lin C, Belhadj K, Beaussart P, Vignaud A, Zerbib P, Pigneur F, Cuenod CA, Bessalem H, Cavet M, Boutekadjirt A, Haioun C, Luciani A. Intravoxel incoherent motion diffusion-weighted imaging of multiple myeloma lesions: correlation with whole-body dynamic contrast agent-enhanced MR imaging. Radiology. 2015; 277:773-783.
25. Inoue A, Tomiyama N, Fujimoto K, Sadohara J, Nakamichi I, Tomita Y, Aozasa K, Tsubamoto M, Murai S, Natsag J, Sumikawa H, Mihara N, Honda O, et al. MR imaging of thymic epithelial tumors: correlation with World Health Organization classification. Radiat Med. 2006; 24:171-181.
26. Tomita M, Matsuzaki Y, Edagawa M, Maeda M, Shimizu T, Hara M, Onitsuka T. Correlation between tumor angiogenesis and invasiveness in thymic epithelial tumors. J Thorac Cardiovasc Surg. 2002; 124:493-498.
27. Luciani A, Vignaud A, Cavet M, Nhieu JT, Mallat A, Ruel L, Laurent A, Deux JF, Brugieres P, Rahmouni A. Liver cirrhosis: intravoxel incoherent motion MR imaging--pilot study. Radiology. 2008; 249:891-899.
28. Pan CC, Chen WY, Chiang H. Spindle cell and mixed spindle/lymphocytic thymomas: an integrated clinicopathologic and immunohistochemical study of 81 cases. Am J Surg Pathol. 2001; 25:111-120.
29. Park HJ, Sung YS, Lee SS, Lee Y, Cheong H, Kim YJ, Lee MG. Intravoxel incoherent motion diffusion-weighted MRI of the abdomen: the effect of fitting algorithms on the accuracy and reliability of the parameters. J Magn Reson Imaging. 2017; 45:1637-1647.
30. Travis WD, Brambilla E, Müller-Hermelink HK, Harris CC. World Health Organization classification of tumours. Pathology and genetics of tumours of the lung, thymus and heart. Lyon: IARC Press. 2004:152-153.
31. Jeong YJ, Lee KS, Kim J, Shim YM, Han J, Kwon OJ. Does CT of thymic epithelial tumors enable us to differentiate histologic subtypes and predict prognosis? AJR Am J Roentgenol. 2004; 183:283-289.