
INTRODUCTION
Lung cancer is the leading cause of cancer death in China and worldwide for both men and women. Small cell lung cancer (SCLC) accounts for approximately 13%-15% of lung cancer cases [1, 2]. SCLC is an aggressive neuroendocrine tumor with clinical and pathological characteristics distinct from other histological types. Its 5-year overall survival rate is a mere 6.3%, and there has been little progress in several decades [3]. Moreover, for advanced stage SCLC, the median survival time is only about 9-10 months [4, 5]. Clearly, therefore, only early diagnosis with timely appropriate treatment has the potential to provide a more favorable outcome for SCLC patients.
Neuron-specific enolase (NSE) is a glycolytic neurospecific isozyme of enolase [6]. This enzyme is a well-established marker whose serum levels are used to support an initial diagnosis of SCLC [7]. Several studies have shown that NSE has a high diagnostic capacity for SCLC patients [8–10]. Likewise, a meta-analysis [11] showed that NSE has a high index for diagnosis of SCLC. It is therefore recommended by the European Group on Tumor Markers guidelines that NSE be used for differential diagnosis in patients with lung tumors of unknown origin.
At present, enzyme linked immunosorbent assays (ELISA), electro-chemiluminescence immunoassays (ECSIA) and radioimmunoassay assays (RIA) are all used to determine serum NSE levels. This raises uncertainty as to whether the diagnostic efficacy of NSE may differ among the various detecting methods. In addition, there is also uncertainty as to whether tumor location influences the sensitivity and specificity of NSE. Finally the reported cut-off levels vary, so an optimal clinical threshold level for NSE needs to be determined. We therefore conducted a systematic review and meta-analysis to assess the efficacy of serum NSE levels for early detection of SCLC in patients with benign lung diseases and healthy individuals.
RESULTS
Literature research and characteristics of studies
As showed in Figure 1, 1325 literature citations were identified from database searches, and 8 citations were identified from reference lists. Ultimately, 33 studies [8-10, 12-41] met the inclusion criteria and were included in our review. Among the 9546 samples studied, 2990 were diagnosed as SCLC.
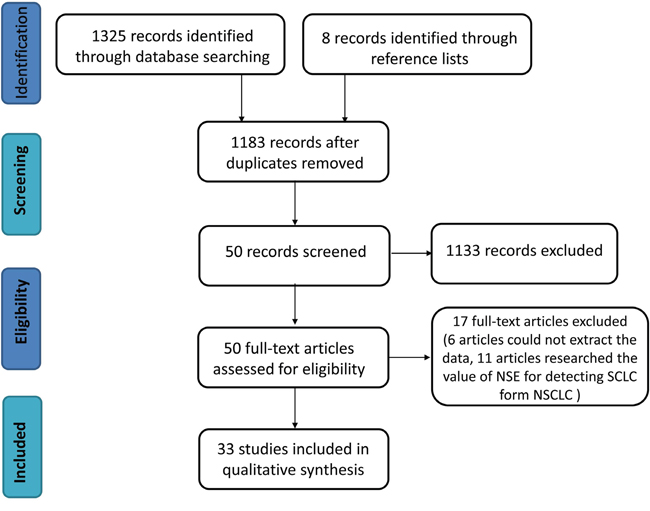
Figure 1: Flow chart of the systematic review process.
All studies were published between 1985 and 2013, Body et al. [14] and STIEBER et al. [25] each had two different NSE cut-off levels for detecting SCLC. Nineteen studies were from Europe, and 14 were form Asia. The NSE cut-off levels reported in those studies ranged from 7.5 ng/ml to 35 ng/ml. No NSE cut-off level was reported in two studies [40, 41]. Three different methods were used to detect NSE: ELISA was available in 15 trials with 3498 samples; 14 trials with 3838 samples used RIA; and 6 trials with 2210 samples used ECISA. The characteristics of the included studies are shown in Table 1.
Table 1: The characteristics of the included studies
Study |
Year |
Country |
TP |
FP |
FN |
TN |
Detection Method |
Cut-off (ng/ml) |
|---|---|---|---|---|---|---|---|---|
Body(a) |
1992 |
Belgium |
79 |
6 |
18 |
94 |
RIA |
11.7 |
Body(b) |
1992 |
Belgium |
86 |
11 |
11 |
89 |
RIA |
9.2 |
Burghuber |
1990 |
Austria |
63 |
53 |
18 |
299 |
RIA |
12.3 |
Dienemann |
1994 |
Germany |
42 |
26 |
13 |
163 |
ELISA |
13.7 |
Dilmaghani-Marand |
2013 |
Germany |
50 |
0 |
0 |
90 |
ELISA |
29.5 |
Ebert |
1996 |
Germany |
95 |
34 |
35 |
348 |
RIA |
13.8 |
ESSCHER |
1985 |
Sweden |
74 |
4 |
29 |
368 |
RIA |
25 |
Feng |
2010 |
China |
4 |
72 |
4 |
192 |
ECSIA |
15.2 |
FRANJEBIC |
2012 |
Croatia |
201 |
10 |
127 |
195 |
ECSIA |
NA |
Gruber |
2008 |
Germany |
78 |
2 |
116 |
316 |
RIA |
35 |
Han |
1994 |
China |
10 |
14 |
8 |
31 |
ELISA |
20 |
HOLDENRIEDER |
2010 |
Germany |
44 |
2 |
9 |
38 |
ECSIA |
NA |
Jaques |
1993 |
Japan |
75 |
0 |
146 |
87 |
RIA |
25 |
Keller |
1998 |
Germany |
52 |
50 |
8 |
302 |
ELISA |
18 |
Lamy |
2000 |
France |
110 |
4 |
36 |
55 |
ELISA |
17 |
Li |
2003 |
China |
18 |
5 |
12 |
55 |
ELISA |
8 |
Molina |
2008 |
Spain |
78 |
32 |
18 |
385 |
ELISA |
25 |
Molina |
2009 |
Spain |
114 |
50 |
61 |
577 |
ELISA |
25 |
Muley |
2003 |
Germany |
138 |
71 |
50 |
744 |
ECSIA |
21.6 |
Niklinski |
1993 |
Poland |
30 |
0 |
18 |
15 |
ELISA |
15 |
NISMAN |
2009 |
Japan |
18 |
15 |
19 |
110 |
ELISA |
22 |
Pan |
2002 |
China |
19 |
51 |
5 |
99 |
ELISA |
13 |
Pinson |
1997 |
Belgium |
47 |
20 |
17 |
96 |
RIA |
12.5 |
Poposka |
2004 |
Macedonia |
24 |
11 |
9 |
79 |
RIA |
16.6 |
Scagliotti |
1989 |
Italy |
44 |
5 |
18 |
42 |
RIA |
12 |
Shibayama |
2001 |
Japan |
49 |
3 |
65 |
103 |
ELISA |
7.5 |
Stieber |
1993 |
Germany |
34 |
14 |
28 |
259 |
RIA |
18 |
STIEBER(a) |
1999 |
Japan |
39 |
4 |
48 |
70 |
RIA |
11.9 |
STIEBER(b) |
1999 |
Japan |
25 |
1 |
61 |
73 |
RIA |
23.1 |
Takada |
1996 |
Japan |
73 |
6 |
28 |
108 |
ELISA |
10.6 |
Yang |
2000 |
China |
18 |
5 |
12 |
55 |
ELISA |
8 |
Yang(a) |
2005 |
China |
14 |
41 |
7 |
103 |
ECSIA |
16.3 |
Yang(b) |
2005 |
China |
40 |
16 |
23 |
65 |
ECSIA |
16.3 |
Zhang |
2002 |
China |
6 |
22 |
2 |
106 |
RIA |
20 |
Zhou |
1995 |
China |
16 |
13 |
4 |
72 |
ELISA |
20.8 |
ELISA: enzyme linked immunosorbent assay; ECSIA: electro-chemiluminescence; Immunoassay assay; RIA= radioimmunoassay assay; TP=true positive; FP: false positive; FN: false negative; TN=true negative.
Quality assessment
Quality Assessment of Diagnostic Accuracy Studies 2 (QUADAS-2) tool was used to assess the methodological quality of included studies. Patient selection showed high bias in 15 studies. Ten studies were designated as having unclear bias in their index tests, and 19 studies were allocated as low bias in their flow and timing. Regarding applicability concerns, 9 studies showed high bias in patient selection, 2 studies had applicability concerns as high bias, and 30 studies were allocated as low bias in reference standard. As shown in Figures 2 and Figure 3, some studies were rated as high risk, and the item flow and timing for risk of bias may have impacted the pooled effects (Supplementary Data 2).
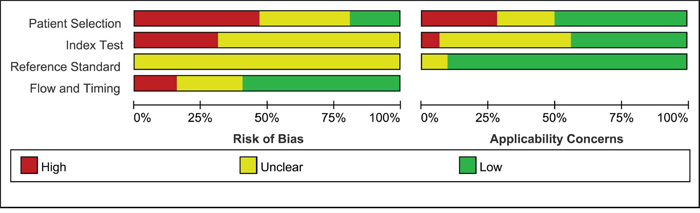
Figure 2: Risk of bias and applicability concerns summary.
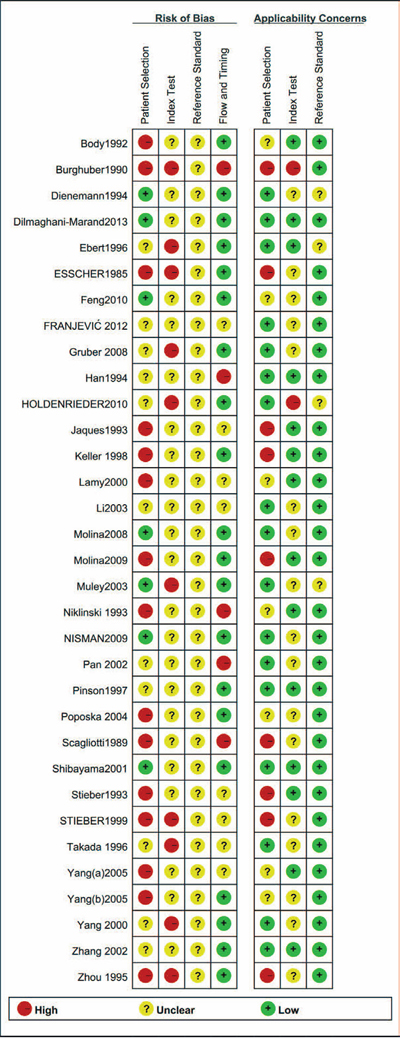
Figure 3: Risk of bias and applicability concerns graph.
Diagnostic performance
The pooled sensitivity of NSE for detecting SCLC was 0.688 (95%CI: 0.627-0.743) (Figure 4), the specificity was 0.921(95%CI: 0.890-0.944) (Figure 5), the positive likelihood ratio (PLR) was 8.744 (6.308-12.121), the negative likelihood ratio (NLR) was 0.339 (95%CI: 0.283, 0.405), and diagnostic odds ratio (DOR) was 25.827 (95%CI: 17.490- 38.136). A bivariate boxplot (Figure 6) showed that significant heterogeneity was present in our review. The summary LRP and LRN for NSE was on the right, under quadrant (LUQ) (Figure 7), and the exclusion and confirmation of NSE for detecting SCLC was not bad. The summary receiver operator characteristic (SROC) curve area under the curve (AUC) was 0.88 (95%CI: 0.85-0.91), and high diagnostic performance was indicated (Figure 8). The clinical utility of NSE for early SCLC screening was good, and Fagan's nomogram (Figure 9) showed that the post-test probability (PLR: 70%, NLR: 7%) differed substantially from the pretest probability (20%).
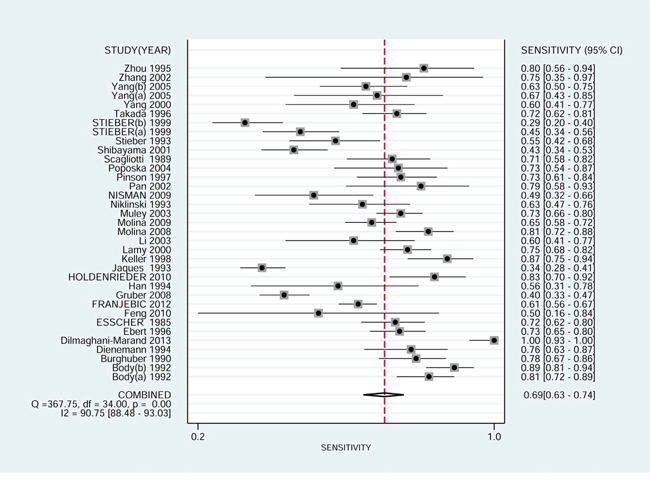
Figure 4: Forest plot estimating the sensitivity of NSE in SCLC patients in the selected studies (Point estimates for sensitivity and 95% CIs are shown with pooled estimates; NSE = neuron-specific enolase; SCLC = small cell lung cancer; CI = confidence interval; Q = Cochran Q statistic).
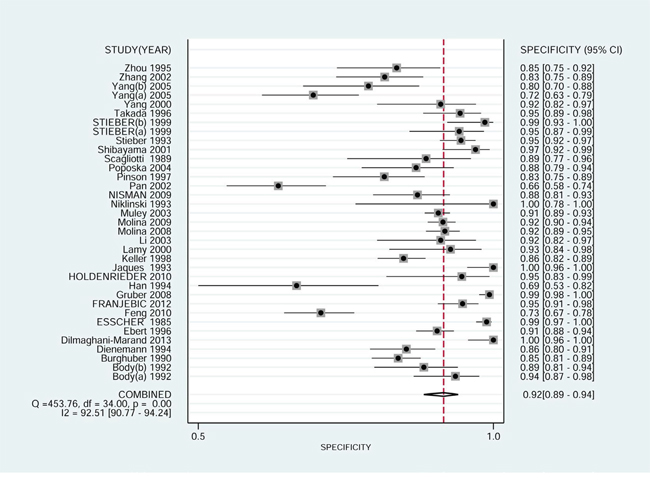
Figure 5: Forest plot estimating the specificity of NSE in SCLC patients in the selected studies (Point estimates for specificity and 95% CIs are shown along with pooled estimates; NSE = neuron-specific enolase; SCLC = small cell lung cancer; CI = confidence interval; Q = Cochran Q statistic).
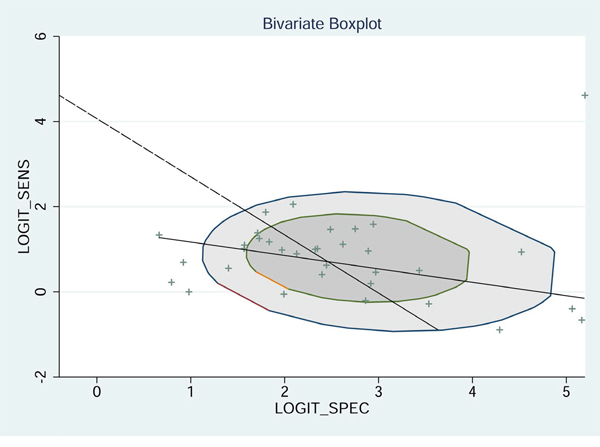
Figure 6: Bivariate boxplot of sensitivity and specificity in the 33 included trials.
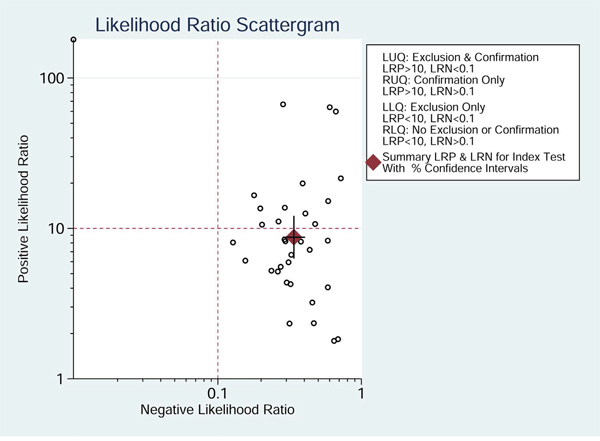
Figure 7: Likelihood ratio scattergram evaluating the positive likelihood ratios of NSE in the diagnosis of SCLC (Point estimates for positive likelihood ratio and 95% CIs are shown along with pooled estimates; NSE = neuron-specific enolase; SCLC = small cell lung cancer).
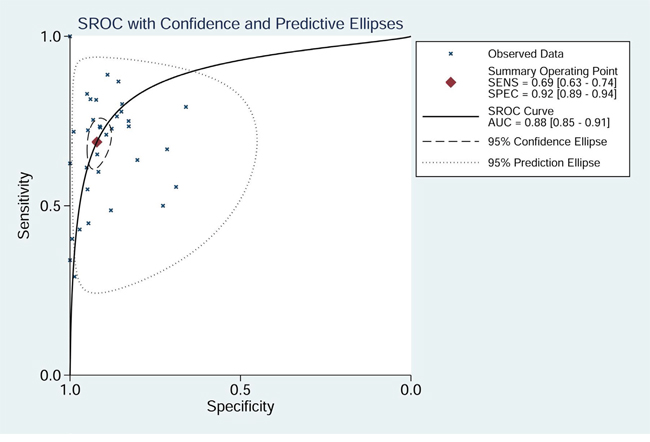
Figure 8: SROC curve for NSE in the diagnosis of SCLC (AUC = area under the curve; NSE = neuron-specific enolase; SCLC = small cell lung cancer; SROC = summary receiver-operating characteristic).
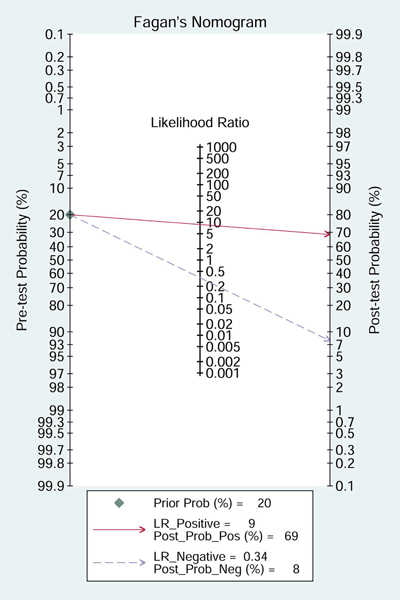
Figure 9: Fagan diagram evaluating the overall value of SCLC for the diagnosis of SCLC (NSE = neuron-specific enolase; SCLC = small cell lung cancer).
Meta-regression analysis
Because the I2 of 99.25 (95%CI: 98.91-99.59) and boxplot (Figure 6) showed that heterogeneity existed in our review, meta-regression analysis was conducted to investigate potential sources of heterogeneity. Detection method, study region, cut-off level and sample size (n ≥ 150 vs n < 150) were included in the meta-regression analysis of sensitivity, specificity and joint models. The results (Table 2) indicated that region may be the source of the heterogeneity in the sensitivity and joint models, while cut-off value was a likely source in the joint model.
Table 2: The result of meta-regression
Sensitivity |
||||
Parameter |
Estimate(95%CI) |
Coef |
Z |
P>|z| |
Detection method |
0.68 [0.62 - 0.74] |
0.76 |
-0.52 |
0.60 |
Region |
0.58 [0.49 - 0.67] |
0.34 |
-2.82 |
0.00* |
Cut-off |
0.68 [0.62 - 0.74] |
0.77 |
-0.05 |
0.96 |
Sample size# |
0.71 [0.62 - 0.78] |
0.87 |
0.65 |
0.51 |
Specificity |
||||
Parameter |
Estimate(95%CI) |
Coef |
Z |
P>|z| |
Detection method |
0.92 [0.89 - 0.94] |
2.44 |
-0.29 |
0.77 |
Region |
0.89 [0.83 - 0.94] |
2.13 |
-1.40 |
0.16 |
Cut-off |
0.92 [0.89 - 0.95] |
2.50 |
0.30 |
0.77 |
Sample size# |
0.90 [0.84 - 0.93] |
2.15 |
-1.75 |
0.08 |
Joint model |
||||
Parameter |
I-squared(95%CI) |
LRTChi |
P Value |
|
Detection method |
0.00 [0.00 - 100.00] |
0.82 |
0.66 |
|
Region |
85.04 [68.84- 100.00] |
13.37 |
0.00* |
|
Cut-off |
94.18 [89.24 - 99.13] |
34.38 |
0.00* |
|
Sample size# |
32.77 [0.00 - 100.00] |
2.97 |
0.23 |
|
#Total patient <150 cases or ≥150 cases;* P<0.05.
Subgroup analysis
The results of subgroup analysis of the different regions and detection methods are shown in Table 3. For regions, the sensitivity and specificity were 0.740 (95%CI: 0.676-0.795) and 0.932 (95%CI: 0.904-0.953) in Europe, which were much higher than in Asia [sensitivity=0.590 (95%CI: 0.496- 0.678); specificity=0.901 (95%CI: 0.819-0.948)]. Regarding detection methods, when ELISA was used to detect NSE, the sensitivity was 0.722 (95%CI: 0.623-0.803) and specificity was 0.910 (95%CI: 0.858-0.944); when RIA was used, the sensitivity was 0.655 (95%CI: 0.545-0.751) and specificity was 0.949 (95%CI: 0.904-0.973); when ECISA was used, the sensitivity was 0.674 (95%CI: 0.584-0.753) and specificity was 0.869 (95%CI: 0.766-0.931). In Europe, ELISA had the highest sensitivity (0.792, 95%CI: 0.617- 0.900), while RIA had the highest specificity (0.936, 95%CI: 0.882-0.966). Likewise, in Asia, the highest sensitivity (0.410, 95%CI: 0.523- 0.729) was obtained when ELISA was used for detection, and the highest specificity (0.970, 95%CI: 0.870- 0.994) was obtained when RIA was used.
Table 3: Subgroup analysis of study region and detection method
Subgroup |
No. of Trials |
No. of Patients |
Sensitivity |
Specificity |
|
|---|---|---|---|---|---|
Region |
Europe |
21 |
7243 |
0.740 (95%CI: 0.676- 0.795) |
0.932 (95%CI: 0.904-0.953) |
Asia |
14 |
2303 |
0.590 (95%CI: 0.496- 0.678) |
0.901 (95%CI: 0.819-0.948) |
|
Detection method |
ELISA |
15 |
3498 |
0.722 (95%CI: 0.623- 0.803) |
0.910 (95%CI: 0.858- 0.944) |
RIA |
14 |
3838 |
0.655 (95%CI: 0.545- 0.751) |
0.949 (95%CI: 0.904- 0.973) |
|
ECISA |
6 |
2210 |
0.674 (95%CI: 0.584- 0.753) |
0.869 (95%CI: 0.766- 0.931) |
|
Europe |
ELISA |
8 |
2541 |
0.792 (95%CI: 0.617- 0.900) |
0.922 (95%CI: 0.866-0.955) |
RIA |
10 |
3073 |
0.720 (95%CI: 0.632- 0.794) |
0.936 (95%CI: 0.882-0.966) |
|
ECISA |
3 |
1629 |
0.673(95%CI: 0.633- 0.712) |
0.922 (95%CI: 0.904-0.937) |
|
Asia |
ELISA |
7 |
957 |
0.653 (95%CI: 0.543- 0.750) |
0.886 (95%CI: 0.783- 0.944) |
RIA |
4 |
765 |
0.655 (95%CI: 0.299- 0.532) |
0.970 (95%CI: 0.870- 0.994) |
|
ECISA |
3 |
581 |
0.630 (95%CI: 0.523- 0.729) |
0.736 (95%CI: 0.695- 0.775) |
|
ELISA: enzyme linked immunosorbent assay; ECSIA: electro- chemiluminescence immunoassay; RIA= radioimmunoassay assay.
Different NSE cut-off levels were also analyzed (Table 4), and different sensitivities and specificities were found. Taking all countries into consideration, the highest sensitivity (0.733, 95%CI: 0.416-0.914) and specificity (0.986, 95%CI: 0.943-0.997) were found when the NSE cut-off level was 25 ng/ml; when cut-off level was 12.5 ng/ml, the sensitivity (0.684, 95%CI: 0.605- 0.754) and specificity (0.919, 95%CI: 0.689- 0.951) were the lowest. Consistent with the values of all countries, in Europe the sensitivity (0.803, 95%CI: 0.460-0.951) and specificity (0.983, 95%CI: 0.924-0.996) were highest when the NSE cut-off level was 25 ng/ml. The sensitivity (0.723, 95%CI: 0.636-0.796) and specificity (0.940, 95%CI: 0.900- 0.964) were lowest when NSE cut-off level was 12.5 ng/ml. In Asia, by contrast, the lowest sensitivity (0.527, 95%CI: 0.345-0.701) and highest specificity (0.938, 95%CI: 0.750-0.987) were obtained when the NSE cut-off level was 20 ng/ml; the lowest specificity (0.861, 95%CI: 0.718-0.938) was obtained when cut-off level was 12.5 ng/ml; and the highest sensitivity (0.603, 95%CI: 0.488-0.707) was obtained when cut-off level was 10 ng/ml.
Table 4: The sensitivity and specificity of different cut-off levels
Cut-off (ng/ml) |
No. of trials |
No. of patients |
Sensitivity |
Specificity |
|---|---|---|---|---|
All |
35 |
9546 |
0.688(95%CI: 0.627- 0.743) |
0.922(95%CI: 0.890- 0.944) |
10 |
29 |
8323 |
0.688(95%CI: 0.621- 0.748) |
0.918(95%CI: 0.879- 0.946) |
12.5 |
24 |
7208 |
0.684(95%CI: 0.605- 0.754) |
0.919(95%CI: 0.689- 0.951) |
15 |
20 |
6098 |
0.668(95%CI: 0.570- 0.753) |
0.933(95%CI: 0.880- 0.963) |
20 |
12 |
4379 |
0.663(95%CI: 0.498- 0.797) |
0.958(95%CI: 0.897- 0.983) |
25 |
6 |
2750 |
0.733(95%CI: 0.416- 0.914) |
0.986(95%CI: 0.943- 0.997) |
Europe |
||||
10 |
18 |
6420 |
0.730(95%CI: 0.661- 0.790) |
0.933(95%CI: 0.899- 0.956) |
12.5 |
15 |
5681 |
0.723(95%CI: 0.636- 0.796) |
0.940(95%CI: 0.900- 0.964) |
15 |
12 |
4745 |
0.723(95%CI: 0.604- 0.817) |
0.953(95%CI: 0.912- 0.975) |
20 |
7 |
3607 |
0.745(95%CI: 0.511- 0.891) |
0.969(95%CI: 0.908- 0.990) |
25 |
5 |
2442 |
0.803(95%CI: 0.460-0.951) |
0.983(95%CI: 0.924- 0.996) |
Asia |
||||
10 |
11 |
1903 |
0.603(95%CI: 0.488- 0.707) |
0.886(95%CI: 0.772- 0.947) |
12.5 |
9 |
1527 |
0.594(95%CI: 0.474- 0.704) |
0.861(95%CI: 0.718- 0.938) |
15 |
8 |
1353 |
0.564(95%CI: 0.442- 0.678) |
0.881(95%CI: 0.731- 0.953) |
20 |
5 |
772 |
0.527(95%CI: 0.345- 0.701) |
0.938(95%CI: 0.750- 0.987) |
ELISA |
||||
10 |
12 |
3098 |
0.759(95%CI: 0.653- 0.840) |
0.901(95%CI: 0.831- 0.944) |
12.5 |
11 |
2883 |
0.765(95%CI: 0.644- 0.855) |
0.895(95%CI: 0.816- 0.942) |
15 |
9 |
2465 |
0.769(95%CI: 0.603- 0.879) |
0.912(95%CI: 0.837- 0.955) |
20 |
6 |
1785 |
0.783(95%CI: 0.484- 0.933) |
0.925(95%CI: 0.788- 0.976) |
25 |
3 |
1455 |
0.754(95%CI: 0.703- 0.800) |
0.928(95%CI: 0.911- 0.942) |
RIA |
||||
10 |
13 |
3641 |
0.628(95%CI: 0.521- 0.725) |
0.953(95%CI: 0.906- 0.977) |
12.5 |
9 |
2741 |
0.592(95%CI: 0.459- 0.712) |
0.966(95%CI: 0.907- 0.988) |
15 |
7 |
2049 |
0.542(95%CI: 0.390- 0.687) |
0.978(95%CI: 0.925- 0.994) |
20 |
5 |
1591 |
0.504(95%CI: 0.311- 0.696) |
0.988(95%CI: 0.941- 0.998) |
25 |
3 |
1295 |
0.438(95%CI: 0.395- 0.482) |
0.992(95%CI: 0.983- 0.997) |
ECISA |
||||
10 |
4 |
1584 |
0.700(95%CI: 0.643- 0.753) |
0.847(95%CI: 0.826- 0.866) |
12.5 |
4 |
1584 |
0.700(95%CI: 0.643- 0.753) |
0.847(95%CI: 0.826- 0.866) |
15 |
4 |
1584 |
0.700(95%CI: 0.643- 0.753) |
0.847(95%CI: 0.826- 0.866) |
Two studies did not report the cut-off positive value of NSE; the cut-off value greater than or equal to 25 ng/ml were only found in one study, so this subgroup analysis could not conducted in Asian; ELISA: enzyme linked immunosorbent assay; ECSIA: electro- chemiluminescence immunoassay; RIA= radioimmunoassay assay. As for ECISA, when cut-off value was 20 ng/ml, only one studies was involved.
No single NSE cut-off level achieved both the highest sensitivity and specificity for ELISA, RIA or ECISA. When NSE cut-off level was 25 ng/ml, ELISA had the highest specificity, and when cut-off level was 20 ng/ml, the sensitivity was highest. For RIA, the highest sensitivity was obtained at 10 ng/ml, and the highest specificity was obtained at 25 ng/ml. For ECSIA, when the cut-off level was 10 ng/ml, 12.5 ng/ml or 15 ng/ml, the sensitivity was 0.700 (95%CI: 0.643-0.753) and specificity was 0.847 (95%CI: 0.826-0.866) across 4 trials. However when cut-off value was 20 ng/ml, only one study was involved.
Publication bias
To assess the publication bias for the diagnostic tests, we used Deek’s funnel plots of lnDOR against 1/ESS1/2 or, equivalently, against (1/n1 + 1/n2)1/2, which is proportional to 1/ESS1/2 [42]. The p value obtained from the funnel plot was 0.001, indicating the presence of publication bias in this meta-analysis (Figure 10).
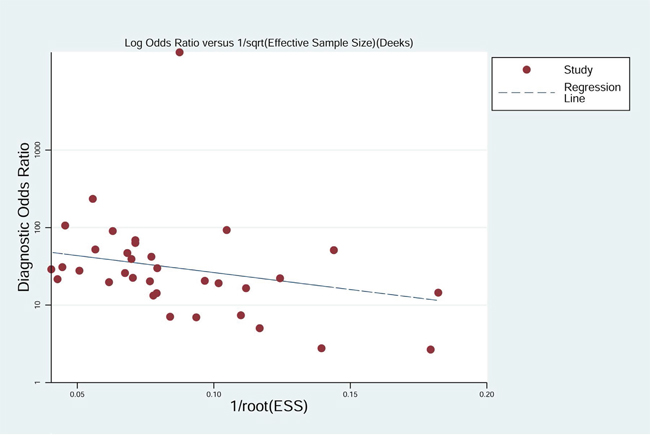
Figure 10: Deek’s funnel plot evaluating publication bias in the included studies.
DISCUSSION
NSE, a traditional tumor biomarker, has been well studied over the years [43–45], and it is commonly used in the diagnosis of SCLC. Although NSE cannot replace histological results, it can be particularly helpful in cases where it is not possible to establish a final diagnosis through biopsy. But to precisely determine the diagnostic efficacy of NSE levels, they should be subjected to pool analysis, and the precise impact of the tumor site and detection method must be determined. Moreover, the most suitable NSE cut-off level should also be established. Our study addressed these issues to a degree.
This systematic review indicated that NSE levels are highly useful for detecting SCLC in patients with benign lung diseases and in healthy individuals. NSE showed high specificity with lower sensitivity. However, the diagnostic performance was much better in Europe than in Asia. The diagnostic performance also differed depending on whether ELISA, RIA and ECISA were used to screen for SCLC. For all countries, ELISA had the highest sensitivity, while RIA had the highest specificity. Likewise, when considered separately in Europe and Asia, the highest sensitivity and specificity were obtained with ELISA and RIA, respectively, when using NSE levels in the diagnosis of SCLC.
There is currently doubt about the appropriate cut-off level for NSE. Normal levels of NSE are less than 12.5 ng/ml. Nonetheless, when cut-off levels were 10 ng/ml or 12.5 ng/ml, the sensitivity and specificity were similar to those obtained in some studies with higher cut-off levels. The best diagnostic performance was obtained with a NSE cut-off level of 25 ng/ml, while the lowest diagnostic performance was obtained at a cut-off level of 12.5 ng/ml. Consistent with all studies, in Europe, the highest and lowest diagnostic performances were obtained at 25 ng/ml and 12.5 ng/ml, respectively. In Asia, however, the highest sensitivity and specificity were obtained at 10 ng/ml and 20 ng/ml, and the lowest sensitivity and specificity were at 20 ng/ml and 12.5 ng/ml. In Europe, therefore, 25 ng/ml may be the most suitable cut-off level. In Asia, however, no single cut-off value had highest sensitivity and specificity, suggesting more studies are warranted.
Our meta-analysis included 33 studies with 9546 samples obtained through a comprehensive search strategy. Meta-regression and subgroup analyses for different regions, detection methods, cut-off levels, and sample sizes were conducted to investigate sources of heterogeneity. Nonetheless, our review has several limitations. First, only papers in English or Chinese were included in our review, so studies in other languages may have been excluded. Second, significant publication bias exists in this review, which may reduce the power of our analysis. Finally, some studies were rated “high risk”, and the item flow and timing may have impacted the pooled effects. In clinical practice, because it is difficult to completely fit flow and timing while guaranteeing a sufficient sample size, there is eventually an inappropriate interval between the index test and reference standard.
In sum, our analysis indicates that NSE levels provide high diagnosis accuracy for early detection of SCLC in patients with benign lung diseases and healthy individuals, though the diagnostic performance is better in Europe than in Asia. ELISA had the highest sensitivity and RIA had the highest specificity. In the clinic, NSE should be considered together with the clinical symptoms, image results and histopathology.
MATERIALS AND METHODS
This is not primary research; no ethical approval or informed consent was necessary for this meta-analysis. Our review was conducted according to the guidelines of the Cochrane Handbook for Diagnostic Test Accuracy Reviews, available at http://srdta.cochrane.org. The protocol is registered with the Centre for Reviews and Dissemination PROSPERO database (available at: https://www.crd.york.ac.uk/PROSPERO/display_record.asp?ID=CRD42014010777).
Search strategy
A comprehensive search of the PubMed, EMBASE, Web of Science, Cochrane library, and Chinese biomedical literature databases was conducted to identify studies published through September 2016. Search terms included neuron-specific enolase and small cell lung cancer. Papers published in English and Chinese were included in our review. Reference lists of the reports selected in the original search were also examined. The strategy used for PubMed is summarized in Supplementary Data 1.
Study inclusion and exclusion criteria
Titles, abstracts, and full texts were independently screened by two reviewers, and a third reviewer acted to resolve any disagreements. Studies included in our review met the following criteria: 1) NSE was used to detect SCLC in patients with benign lung diseases and healthy individuals; 2) data such as true positive (TP), false positive (FP), false negative (FN), and true negative (TN) were available in the studies; 3) diagnostic tests was designed in the studies. Excluded were the following: 1) reviews and meeting abstracts; 2) papers from which the extracted data was not sufficient; 3) case reports.
Data extraction and quality assessment
Study features (last name of the first author, year of publication, and country), number of samples and outcome data (TP, FP, FN, and TN) were extracted by two reviewers. The methodological quality of the included studies was assessed using the QUADAS-2 tool and Review Manager 5.3 (The Nordic Cochrane Centre, The Cochrane Collaboration, 2014). With respect to the Cochrane guidelines, we assigned low, high, or unclear risk of bias values to the patient selection; index tests, reference standards, and item flow and timing domains were also evaluated. Applicability concerns were evaluated in the first three domains.
Statistical analysis
Pooled sensitivity, specificity, PLR, NLR, DOR, and AUC and associated 95% confidence intervals (CIs) were calculated using a bivariate regression model. Heterogeneity was assessed using a bivariate boxplot, Chi-square test, and inconsistency index (I2). If I2 was greater than 50%, significant heterogeneity would be considered to exist in the studies. In addition, meta-regression and subgroup analyses were used to investigate potential sources of heterogeneity. A likelihood ratio scattergram was used to evaluate the exclusion and confirmation capacities of the index test. Finally, clinical utility and publication bias were assessed using a Fagan diagram and Deek’s plot. The statistical analysis was conducted using STATA version 12.0 (Stata Crop, college Station, TX).
Abbreviations
NSE=serum neuron-specific enolase, SCLC=small cell lung cancer, QUADAS-2=Quality Assessment of Diagnostic Accuracy Studies, ELISA=enzyme linked immunosorbent assays, ECSIA=electro-chemiluminescence immunoassays, RIA=radioimmunoassay assays, SROC= summary receiver operator characteristic, PLR=positive likelihood ratio, NLR=negative likelihood ratio, DOR=diagnostic odds ratio, AUC=area under the curve, TP=true positive, FP=false positive, FN=false negative, TN=true negative.
Author contributions
HM conceived and designed the experiments. LH, J-GZ and W-XY performed the experiments. HM, LH and XT analysed the data. LH, S-PL and T-YZ contributed materials/analysis tools. HM, LH, J-GZ, W-XY, S-HJ and Y-JB wrote the first draft of the manuscript. All authors contributed to the writing of the manuscript. All authors reviewed the ICMJE criteria for authorship and agreed with manuscript results and conclusions.
ACKNOWLEDGMENTS
The authors thank the reviewers for their helpful comments on this article.
CONFLICTS OF INTEREST
There is no conflicts of interest for any author regarding the publication of this manuscript.
FUNDING
This research was supported by the NSFC (Natural Science Foundation of China) (81360351, 1660512), The Postgraduate Workstation of Oncology of Guizhou Province (Grant No. Qian Jiao Ke He GZZ [2016] 06), the High-level Innovative Talents Cultivation Program of Guizhou Province, the Start-Up Fund for Doctors of Zunyi Medical University, and the Social Practice Program for Postgraduates of Zunyi Medical University (Grant No.zy-yjs2015004), Applied Basic Research Programs of Science and Technology Commission Foundation of Sichuan Province (Grant No. 2012JY0058). The funders had no role in study design, data collection and analysis, decision to publish, or preparation of the manuscript.
REFERENCES
1. Siegel RL, Miller K, D, Jemal A. Cancer Statistics, 2017. Ca A Cancer Journal for Clinicians. 2017; 67. doi:10.3322/caac.21387.
2. Chen W, Zheng R, Baade PD, Zhang S, Zeng H, Bray F, Jemal A, Yu XQ, He J. Cancer statistics in China, 2015. Ca A Cancer Journal for Clinicians. 2016; 66:115. doi: 10.3322/caac.21338.
3. Kalemkerian GP, Schneider BJ. Advances in Small Cell Lung Cancer. Hematol Oncol Clin North Am. 2017; 31:143-56. doi: 10.1016/j.hoc.2016.08.005.
4. Micke P, Faldum A, Metz T, Beeh KM, Bittinger F, Hengstler JG, Buhl R. Staging small cell lung cancer: Veterans Administration Lung Study Group versus International Association for the Study of Lung Cancer—what limits limited disease? Lung Cancer. 2002; 37:271. doi: http://dx.doi.org/10.1016/S0169-5002(02)00072-7.
5. Anna N, Bunn PA, Jr., Langer C, Einhorn L, Guthrie T, Jr., Beck T, Ansari R, Ellis P, Byrne M, Morrison M, Hariharan S, Wang B, Sandler A. Randomized phase III trial comparing irinotecan/cisplatin with etoposide/cisplatin in patients with previously untreated extensive-stage disease small-cell lung cancer. J Clin Oncol. 2006; 24: 2038-43. doi: 10.1200/jco.2005.04.8595.
6. Carney DN, Marangos PJ, Ihde DC, Bunn PA, Jr., Cohen MH, Minna JD, Gazdar AF. Serum neuron-specific enolase: a marker for disease extent and response to therapy of small-cell lung cancer. Lancet. 1982; 1:583-5. doi: http://dx.doi.org/10.1016/S0140-6736(82)91748-2.
7. Trapé J, Franquesa J, Sala M, Bernadich O, Martín E, Perich D, Marquilles E, Pérez C, Ros S, Arnau A, Catot S, Montesinos J. Utility of tumor markers in the rapid diagnosis of lung cancer unities. Clinical Chemistry and Laboratory Medicine. 2015; 53:S419.
8. Dilmaghani-Marand BB, Oremek GM. Tumor markers in patients with benign and malignant pulmonary diseases; competitive evaluation of ProGRP, NSE and Cyfra 21-1. Recent Patents on Biomarkers. 2013; 3:145-52. doi: 10.2174/2210309011303030006.
9. Molina R, Augé JM, Bosch X, Escudero JM, Viñolas N, Marrades R, Ramírez J, Carcereny E, Filella X. Usefulness of serum tumor markers, including progastrin-releasing peptide, in patients with lung cancer: Correlation with histology. Tumor Biology. 2009; 30:121-9. doi: 10.1159/000224628.
10. Burghuber OC, Worofka B, Schernthaner G, Vetter N, Neumann M, Dudczak R, Kuzmits R. Serum neuron-specific enolase is a useful tumor marker for small cell lung cancer. Cancer. 1990; 65:1386-90. doi: 10.1002/1097-0142(19900315)65:6<1386.
11. Wang J, Gao J, He J. Diagnostic value of ProGRP and NSE for small cell lung cancer: a meta-analysis. Zhongguo Fei Ai Za Zhi. 2010; 13:1094-100. doi: 10.3779/j.issn.1009-3419.2010.12.03.
12. Esscher T, Steinholtz L, Bergh J, Nou E, Nilsson K, Pahlman S. Neurone specific enolase: a useful diagnostic serum marker for small cell carcinoma of the lung. Thorax. 1985; 40:85-90.
13. Scagliotti GV, Piani M, Gatti E, Gozzelino F, Albera C, Pozzi E. Combined measurements of neuron specific enolase and bombesin/gastrin releasing peptide in lung cancer. Eur Respir J. 1989; 2:746-50.
14. Body JJ, Paesmans M, Sculier JP, Dabouis G, Bureau G, Libert P, Berchier MC, Raymakers N, Klastersky J. Monoclonal immunoradiometric assay and polyclonal radioimmunoassay compared for measuring neuron-specific enolase in patients with lung cancer. Clin Chem. 1992; 38:748-51.
15. Jaques G, Auerbach B, Pritsch M, Wolf M, Madry N, Havemann K. Evaluation of serum neural cell adhesion molecule as a new tumor marker in small cell lung cancer. Cancer. 1993; 72:418-25. doi: 10.1002/1097-0142(19930715)72:2<418.
16. Niklinski J, Chyczewska E, Furman M, Kowal E, Laudanski J, Chyczewski L. Usefulness of a multiple biomarker assay in bronchoalveolar lavage (BAL) and serum for the diagnosis of small cell lung cancer. Neoplasma. 1993; 40:305-8.
17. Stieber P, Dienemann H, Hasholzner U, Muller C, Poley S, Hofmann K, Fateh-Moghadam A. Comparison of cytokeratin fragment 19 (CYFRA 21-1), tissue polypeptide antigen (TPA) and tissue polypeptide specific antigen (TPS) as tumour markers in lung cancer. Eur J Clin Chem Clin Biochem. 1993; 31:689-94. doi: 10.1515/cclm.1993.31.10.689.
18. Ebert W, Dienemann H, Fateh-Moghadam A, Scheulen M, Konietzko N, Schleich T, Bombardieri E. Cytokeratin 19 fragment CYFRA 21-1 compared with carcinoembryonic antigen, squamous cell carcinoma antigen and neuron-specific enolase in lung cancer. Results of an international multicentre study. Eur J Clin Chem Clin Biochem. 1994; 32:189-99. doi: 10.1515/cclm.1994.32.3.189.
19. Han B-H, Gao Y-Y, Jian Y-M, Zhou M. The Clinical Efficacy of Detecting Serum NSE, CIC and CEA for Small Cell Lung Cancer. [Article in Chinese]. Acta Atademiae Medicinae Shanghai. 1994; 21:187-90.
20. Zhou J-J, Xiong Q-K. The Clinical Value of Serum Creatine Kinase Isoenzyme BB and Neuron-Specific Enolase for Small Cell Lung Cancer. [Article in Chinese]. Journal of Sichuan University (Medical Sciences). 1995:90-3.
21. Ebert W, Ryll R, Muley T, Hug G, Drings P. Do neuron-specific enolase levels discriminate between small-cell lung cancer and mediastinal tumors? Tumour Biol. 1996; 17:362-8. doi: 10.1159/000218001.
22. Takada M, Kusunoki Y, Masuda N, Matui K, Yana T, Ushijima S, Iida K, Tamura K, Komiya T, Kawase I, Kikui N, Morino H, Fukuoka M. Pro-gastrin-releasing peptide (31-98) as a tumour marker of small-cell lung cancer: comparative evaluation with neuron-specific enolase. Br J Cancer. 1996; 73:1227-32. doi: 10.1038/bjc.1996.235 www.bjcancer.com.
23. Pinson P, Joos G, Watripont P, Brusselle G, Pauwels R. Serum neuron-specific enolase as a tumor marker in the diagnosis and follow-up of small-cell lung cancer. Respiration. 1997; 64:102-7. doi: 10.1159/000196651.
24. Keller T, Bitterlich N, Hilfenhaus S, Bigl H, Loser T, Leonhardt P. Tumour markers in the diagnosis of bronchial carcinoma: new options using fuzzy logic-based tumour marker profiles. J Cancer Res Clin Oncol. 1998; 124:565-74. doi: 10.1007/s004320050216.
25. Stieber P, Dienemann H, Schalhorn A, Schmitt UM, Reinmiedl J, Hofmann K, Yamaguchi K. Pro-gastrin-releasing peptide (ProGRP)—a useful marker in small cell lung carcinomas. Anticancer Res. 1999; 19:2673-8.
26. Lamy PJ, Grenier J, Kramar A, Pujol JL. Pro-gastrin-releasing peptide, neuron specific enolase and chromogranin A as serum markers of small cell lung cancer. Lung Cancer. 2000; 29:197-203. doi: 10.1016/S0169-5002(00)00113-6.
27. Yang J, Li R, Li A. Clinical Significance of ProGRP31-98 in Patients with Small-Cell Lung Cancer. [Article in Chinese]. Zhonghua Zhong Liu Za Zhi. 2000; 22:216-8.
28. Shibayama T, Ueoka H, Nishii K, Kiura K, Tabata M, Miyatake K, Kitajima T, Harada M. Complementary roles of pro-gastrin-releasing peptide (ProGRP) and neuron specific enolase (NSE) in diagnosis and prognosis of small-cell lung cancer (SCLC). Lung Cancer. 2001; 32:61-9. doi: http://dx.doi.org/10.1016/S0169-5002(00)00205-1.
29. Pan Q-R, Zhang X, Xu Z-F, Zheng S. Significance of Combined Determination of CK19mRNA, Carcinoembryanic Antigen, Neuron-Specific Enolase, and Tissue Polypeptide Antigen in Peripheral Blood of Patients with Lung Cancer. [Article in Chinese]. Chinese Journal of Cancer. 2002; 21:196-9.
30. Zhang L, Li L-Y, Li H, Zhou C-W. Clinical Significance of Tumor Markers in the Diagnosis of Lung Cancer. [Article in Chinese]. Chin J Lung Cancer. 2002; 5:214-6. doi:10.3779/j.issn.1009-3419.2002.03.17.
31. Li A, Yang J, Li X, Li R, Wang Y, Si L. Diagnostic value of serum ProGRP31-98 in patients with small-cell lung cancer. [Article in Chinese]. Academic Journal of Xi'an Jiaotong University. 2003; 15:44-6.
32. Muley T, Ebert W, Stieber P, Raith H, Holdenrieder S, Nagel D, Fürst H, Roth HJ, Luthe H, Blijenberg BG, Gurr E, Uhl W, von Pawel J. Technical performance and diagnostic utility of the new elecsys® neuron-specific enolase enzyme immunoassay. Clinical Chemistry and Laboratory Medicine. 2003; 41:95-103. doi: https://doi.org/10.1515/CCLM.2003.017.
33. Poposka BI, Spirovski M, Trajkov D, Stefanovski T. Neuron specific enolase - Selective marker for small-cell lung cancer. Radiology & Oncology. 2004; 38:21-6.
34. Yang S-Y, Zhang W-G, Shun X-Z, Zhao H-X, Zhu J-H, Yang C-D. Significance and correlation between serum proGRP and NSE in the early diagnosis of small cell lung cancer. [Article in Chinese]. Journal of Xi'an Jiaotong University (Medical Sciences). 2005; 26:247-9.
35. Zhou J-G, Zhang Y-G, Shun X-Z, He Z-Y, Li Y-L, Liu Y, Zhang J, Donf X-L, Yang C-D. A preliminary evaluation of diagnostic value of five serum tumor markers for lung cancer. [Article in Chinese]. Journal of Xi'an Jiaotong University (Medical Sciences). 2005; 26:352-4.
36. Gruber C, Hatz R, Reinmiedl J, Nagel D, Stieber P. CEA, CYFRA 21-1, NSE, and ProGRP in the diagnosis of lung cancer: A multivariate approach. LaboratoriumsMedizin. 2008; 32:361-71. doi: 10.1515/JLM.2008.050.
37. Molina R, Auge JM, Escudero JM, Marrades R, Vinolas N, Carcereny E, Ramirez J, Filella X. Mucins CA 125, CA 19.9, CA 15.3 and TAG-72.3 as tumor markers in patients with lung cancer: comparison with CYFRA 21-1, CEA, SCC and NSE. Tumour Biol. 2008; 29:371-80. doi: 10.1159/000181180.
38. Nisman B, Biran H, Ramu N, Heching N, Barak V, Peretz T. The diagnostic and prognostic value of ProGRP in lung cancer. Anticancer Res. 2009; 29:4827-32.
39. Feng X-M, Wang G-Q, Chen Y, Wang R, Gu Y-J, Liu Y-D. Diagnostic value of Serum Tumor Marker for Lung Cancer. [Article in Chinese]. Chinese Journal of Clinical Oncology. 2010; 37:331-4. doi: 10.3969/j.issn.1000-8179.2010.06.009.
40. Holdenrieder S, Von Pawel J, Duell T, Feldmann K, Raith H, Schollen A, Nagel D, Stieber P. Clinical relevance of thymidine kinase for the diagnosis, therapy monitoring and prognosis of non-operable lung cancer. Anticancer Res. 2010; 30:1855-62.
41. Franjevic A, Pavicevic R, Bubanovic G. Differences in initial NSE levels in malignant and benign diseases of the thoracic wall. Clin Lab. 2012; 58:245-52.
42. Ma H, Yao WX, Huang L, Jin SH, Liu DH, Liu Y, Tian X, Tian JH, Zhou JG. Efficacy of D5F3 IHC for detecting ALK gene rearrangement in NSCLC patients: a systematic review and meta-analysis. Oncotarget. 2016; 7:70128-42. doi: 10.18632/oncotarget.11806.
43. Barlesi F, Gimenez C, Torre JP, Doddoli C, Mancini J, Greillier L, Roux F, Kleisbauer JP. Prognostic value of combination of Cyfra 21-1, CEA and NSE in patients with advanced non-small cell lung cancer. Respir Med. 2004; 98:357-62. doi: http://dx.doi.org/10.1016/j.rmed.2003.11.003.
44. Paone G, De Angelis G, Munno R, Pallotta G, Bigioni D, Saltini C, Bisetti A, Ameglio F. Discriminant analysis on small cell lung cancer and non-small cell lung cancer by means of NSE and CYFRA-21.1. Eur Respir J. 1995; 8:1136-40. doi: 10.1183/09031936.95.08071136.
45. Cooper EH, Splinter TAW. Neuron-specific enolase (NSE): A useful marker in small cell lung cancer. Lung Cancer. 1987; 3:61-6. doi: http://dx.doi.org/10.1016/S0169-5002(87)80001-6.