
INTRODUCTION
Epithelial ovarian cancer (EOC) is the most lethal gynecological cancer and the fifth most common cause of cancer-related death among women in the United States [1]. Serous ovarian cancer (SOC), peritoneal carcinoma, carcinosarcoma, and mixed carcinoma with serous component account for 78% of all cases and 87% of advanced stage cases of EOC [2]. SOC is the most common histological subtype of EOC. Due to latent symptoms and lack of reliable early screening methods, most SOCs are diagnosed at an advanced stage (stage III-IV; International Federation of Gynecology and Obstetrics, FIGO) [3]. As advanced-stage or high-grade SOCs are more likely to have a poor prognosis [4], discovering gene expression signatures associated with SOC stage and grade outcomes is crucial.
Previous integrated genomic analyses of ovarian carcinoma subdivided SOCs into multiple molecular subtypes and attempted to explain their association with prognosis [5–7]. However, some of the SOC subtypes proposed by Tothill et al. were mixed with endometrioid ovarian cancers [6], while those defined by Verhaak et al. contained only high-grade SOCs [7]. In the above studies, researchers established tumor subtypes based on inherent gene expression profiles and then explored their relationship to clinical features, but few direct correlations were detected. From a clinical point of view, an applicable subtype system based on gene-related prognosis that can guide clinical therapeutic strategies is desirable. Recent advances in gene interaction network methodologies encouraged researchers to investigate possible intrinsic links between functional gene clusters (i.e. functional modules) and prognostic factors. Identification of meaningful modules related to grade and stage could be beneficial for inferring tumor mechanism, predicting patient survival, and establishing novel diagnostic or therapeutic targets. A weighted gene co-expression network analysis (WGCNA) was proposed to reconstruct robust gene co-expression networks (modules). These modules were constructed in terms of large-scale gene expression profiles and the distinction of centrally located genes (hub genes) that drive key cellular signaling pathways [8, 9]. The WGCNA approach has provided functional interpretation tools in systems biology and led to new insights into the pathophysiology of breast cancer and endometrial cancer [9–14]. Although WGCNA has been applied to detect TP53 missense or null mutations in ovarian cancer [15], there are no reports applying WGCNA to systematically identify gene co-expression networks associated with clinical-pathological factors in SOCs.
To fulfill this gap, we conducted a WGCNA and calculated module-trait correlations based on three public microarray datasets (GSE26193, GSE9891, and TCGA), which included 788 samples and 10402 genes. This approach identified meaningful co-expression modules significantly related to tumor grade and stage, and revealed hub genes contributing to extracellular matrix interactions and mitosis in SOC. Our study provides a novel and broad application platform for the identification of SOC gene signatures, and may be useful to characterize new molecular targets and develop effective therapeutic strategies.
RESULTS
Construction of gene co-expression network
WGCNA was performed to identify gene co-expression networks associated with SOC clinical-pathological factors. Three SOC datasets, namely, GSE26193, GSE9891, and TCGA, were adopted from the curatedOvarianData Bioconductor package (Table 1) [16, 17]. In total, 788 samples and 10402 genes were included, and ten arbitrary datasets, each containing 50% of all samples, were built through random sampling. Gene co-expression networks were then built among these ten datasets (d1 to d10). As 3 is the lowest value that allows achieving more than 90% similarities in topology models of ten datasets (Figure 1A), a soft threshold of 3 was implemented, resulting in the detection of 54 significant modules (Figure 1B).
Table 1: General information of involved three modeling and five validation datasets
datasets |
platform |
Involved samples |
Grade (I/II/III) |
Stage (I/II/III/IV) |
Recurrence Status (N/Y) |
Vital status (N/Y) |
|---|---|---|---|---|---|---|
Modeling datasets |
||||||
GSE26193 |
hgu133plus2 |
79 |
4/19/56 |
11/6/48/14 |
16/63 |
19/60 |
GSE9891 |
hgu133plus2 |
237 |
7/86/144 |
11/9/195/21 |
62/175 |
126/111 |
TCGA |
hthgu133a |
472 |
6/58/408 |
13/24/365/68 |
225/247 |
218/254 |
Validation datasets |
||||||
GSE17260 |
hgug4112a |
110 |
26/41/43 |
0/0/93/17 |
34/76 |
64/46 |
TCGA.RNASeqV2 |
RNASeq |
261 |
1/28/226 |
0/18/209/33 |
123/138 |
114/143 |
GSE20565 |
hgu133plus2 |
140 |
6/27/63 |
18/9/52/15 |
- |
- |
PMID15897565 |
hgu133a |
63 |
2/35/25 |
7/4/48/4 |
- |
- |
GSE49997 |
ABI Human Genome Survey Microarray V2 |
204 |
0/50/143 |
0/9/154/31 |
70/124 |
137/57 |
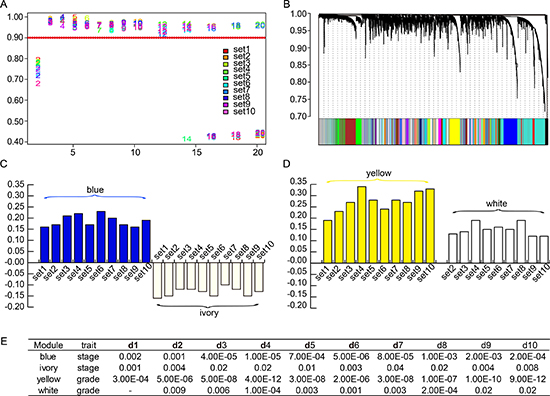
Figure 1: Weighted gene co-expression network of SOC. (A) Network topology analysis was employed to choose a soft-thresholding power to achieve scale-free topology in all modeling sets. (B) Fifty-four significant co-expression gene modules shared in ten random sampling sets were detected with WGCNA. Consensus gene dendrogram and module colors denote correspondence. (C) Correlation values of blue and ivory module-trait relationships across ten random sampling datasets. (D) Correlation values of yellow and white module-trait relationships across ten random sampling datasets. (E) P values of module-trait relationships of two stage-associated and two grade-associated modules across ten random sampling datasets (p < 0.05).
Calculation of module-trait correlations in SOCs
For each module, we calculated correlations between gene expression and clinical features such as tumor stage, grade, recurrence time, vital time, recurrence status, and vital status. The last four features were regarded as prognostic traits. Consensus module-trait relationships across the ten sets were also presented as mutually significant correlations (p < 0.05). We noticed that there were multiple modules associated with one or more traits. In particular, there were consistent correlations among the ten sets in four modules, each named after their representative color: blue, ivory, yellow, and white. For instance, the blue and the ivory modules were related to tumor stage; the yellow module was related to grade; and the white module was related to grade in nine out of ten sets. Besides, correlations between gene expression patterns and prognostic traits were found in a minority of the ten sets. In short, two stage-associated and two grade-associated gene modules were identified in SOCs using WGCNA. The correlation indexes are shown in Supplementary Figure 1, and the significance of module-trait relationships is shown in Figure 1C–1E).
Module preservation analysis
A summarized Z score was calculated to determine universal module preservation using WGCNA R software. Modules with a Z score > 10 were regarded as highly preserved. As recommended by the WGCNA author, all uncharacterized genes were assigned to the gray module, which should have a Z score lower than that of most other modules [18]. We could assert that 36/54 modules were highly conserved (Supplementary Table 1). The Z scores of the gray module and the four stage-associated or grade-associated modules were 78.82 (blue), 61.51 (yellow), 30.3 (white), 30.0 (gray) and 27.41 (ivory). The blue module was regarded as a representative stage-associated module and the yellow module as a grade-associated module, because they both contained higher conservation and consistent association with stage or grade. Supplementary Table 2 contains gene symbols inside these four modules.
Identification of universal hub genes in the blue and yellow modules
The blue and yellow modules comprised 884 and 561 genes, respectively. Genes with the top 200 strongest connections within the blue and yellow modules from each set were extracted to show their connections and identify hub genes (Supplementary Figures 2 and 3). Within each network, node sizes, font sizes, and color depth are proportional to their connectivity (sum of in-module degrees). Shared hub genes were readily discernible in all ten sets.
To compare and integrate our gene co-expression networks with protein interaction data, we extracted a high-quality protein interaction network from the Search Tool for the Retrieval of Interacting Genes (STRING), which only contains interactions with a combined score above 600. The retrieved STRING network contained 16771 nodes and 392611 edges. Nodes were defined as individual genes in the network, and edges were defined as the interactions between genes. Subsequently, we found mutual genes in each module and in the STRING network gene set and extracted them from the respective subnetworks. As shown in Figures 2A and 3A, the blue module subnetwork contained 505 nodes and 2093 edges, while the yellow module subnetwork contained 313 nodes and 2215 edges. Since the subnetworks were extracted from a high-quality STRING protein interaction database section, derived from traceable interaction experiments, the data suggest that a tight regulatory relationship exists for these module genes in nature.
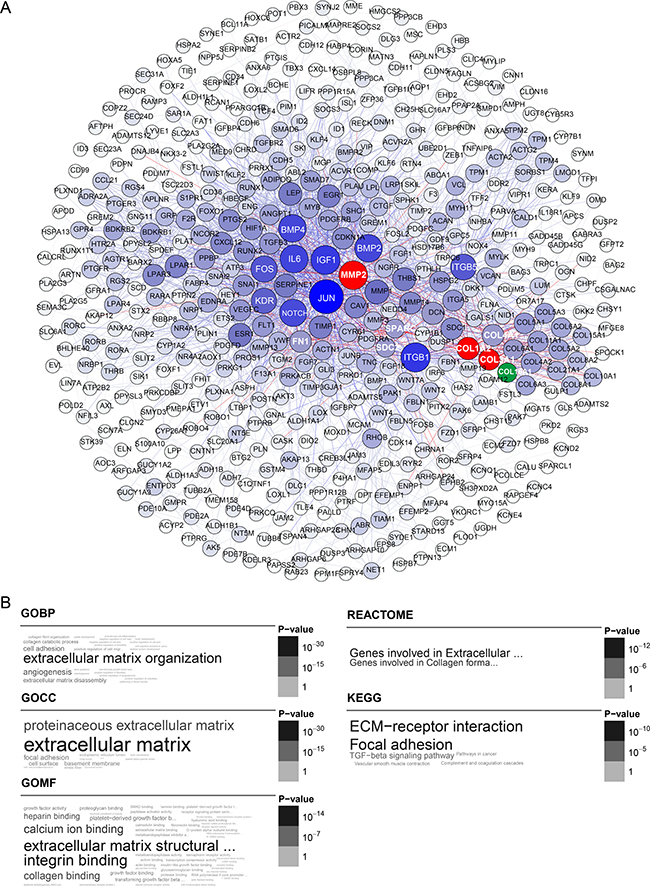
Figure 2: Blue module gene network and enrichment analysis. (A) Top hub genes of the blue module are shown in blue; gene importance was assigned according to circle diameter and color depth, in descending order. Intersection of the top 25 hub genes with the high-quality STRING network is shown in red. COL16A1 is shown in green as a node connected to MMP2 and COL. (B) Gene ontology and pathway enrichment analysis of blue module genes.
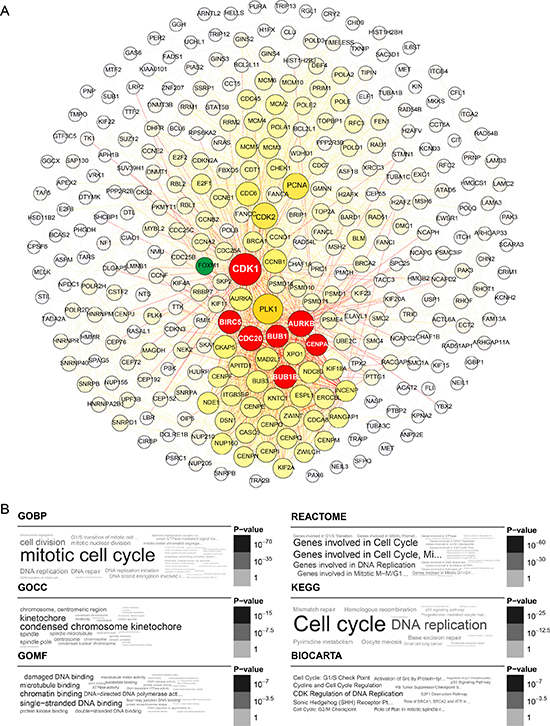
Figure 3: Yellow module gene network and enrichment analysis. (A) Top hub genes of the yellow module are shown in yellow; gene importance was assigned according to circle diameter and color depth, in descending order. Intersection of the top 25 hub genes with the high-quality STRING network is shown in red. FOXM1 is shown in green as a node connected to CDK1 and CENPA. (B) Gene ontology and pathway enrichment analysis of yellow module genes.
A comparison of the top 25 hub genes throughout the co-expression network among the ten datasets, and mutual subnetwork genes, is summarized in Table 2 (blue module) and Table 3 (yellow module). In the blue module co-expression network, MMP2, COL1A2, and COL3A1 were hub genes with tight relationships. MMP2 interacted with COL1A2 or COL3A1 through COL16A1 (Figure 2A). In the yellow module co-expression network, CDK1 interacted with CENPA through FOXM1, while CENPA, CDC20, AURKB, BUB1, BUB1B, and BIRC5 interacted with each other directly (Figure 3A). The regulatory networks among these hub genes, although complex, were organized in a similar topology.
Table 2: The top 25 hub genes of the blue module through ten datasets and the high-quality STRING subnetwork
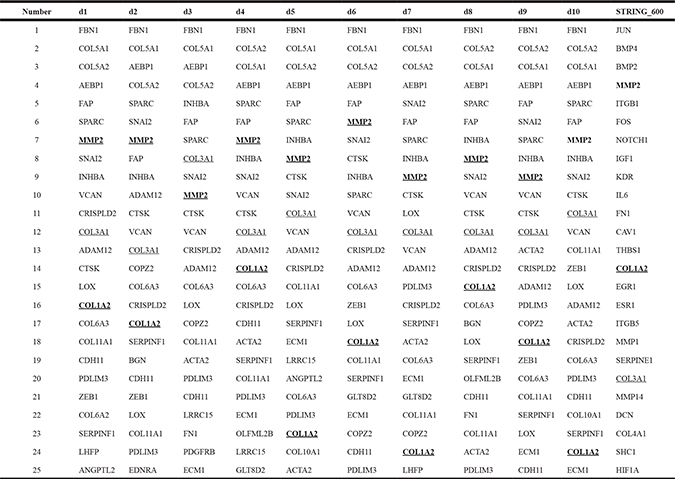
d1–d10: ten datasets sampled from the modeling datasets.
GO and pathway enrichment analysis of blue and yellow module genes
To explore the biological functions of the blue and yellow modules, we performed Gene Ontology (GO) term enrichment analysis, as well as pathway ontology analyses from the KEGG, BIOCARTA, and REACTOME databases. All significant terms enriched in the above annotation systems are represented as a word cloud to facilitate comparison of the relative significance of enriched terms, where the grayscale and font size of each term are proportional to the adjusted p value derived from the enrichment analysis. For the blue module, the top enriched terms in GO and REACTOME pathway ontology were “extracellular matrix (ECM) organization” or “ECM structural constituent”. On KEGG pathway analysis, the top enriched terms were “focal adhesion” (adjP = 6.9e-11) and “ECM-receptor interaction” (adjP = 1.0e-10) (Figure 2B).
For yellow module genes, the top enriched terms in the GO and pathway databases were “mitotic cell cycle,” “DNA binding or replication” and “condensed chromosome kinetochore” (Figure 3B). Thus, the enriched terms in the annotation systems were mostly related to mitosis. These findings corroborate previous research implicating extensive cell proliferation and accelerated DNA replication as fundamental characteristics of tumor cells.
Validation of the robust correlation between blue module eigengene expression and SOC stages
For a more intuitive depiction of the the expression distribution of module genes related to SOC stages, we calculated statistical significance via Kruskal-Wallis tests and plotted the module eigengene expression distribution for stages in each modeling dataset (i.e. GSE26193, GSE9891, and TCGA). For the above cases, eigengene expression showed significant differences between stages [Benjamini-Hochberg (BH) adjusted p < 0.05]. Meanwhile, positive correlations between eigengene expression and stages were universally demonstrated in all boxplots (Figure 4).
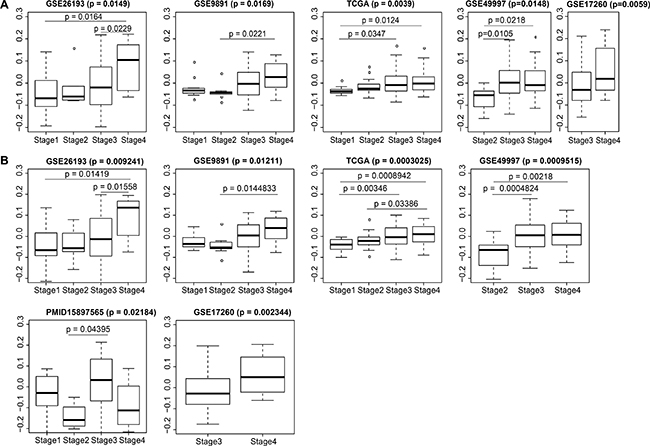
Figure 4: Distributions of blue module eigengene expression among traits in modeling and validation datasets. Overall p-values and pairwise p values are shown. (A) 884 genes; (B) top 7 genes.
Since this co-expression network was identified in three public datasets and the correlation of its eigengene expression with stages in each dataset was validated, we determined if this correlation would be a universal rule across SOCs by perusing the other five independent SOC datasets from the curatedOvarianData package (GSE49997, GSE17260, TCGA.RNASeqV2, GSE20565, and PMID15897565). General information for the eight modeling or validation datasets examined is shown in Table 1. We calculated the eigengene expressions of module genes in these five validation datasets, and estimated the expression distribution among different stages using nonparametric tests. The distribution, mean value, and statistical results are shown in Figure 4A. From the boxplot, we found that the eigengene expression of the blue module genes showed a statistically significant distribution within stage III and stage IV patients in GSE17260 (p = 0.0059) and GSE49997 (p = 0.0148). There were significant differences between stage II and stage III (p = 0.0105), as well as between stage II and stage IV (p = 0.0218). In the other three datasets, the p values were greater than 0.05 (data not shown). As fewer numbers of module genes are likely needed for clinical transformation, we attempted to use the top seven hub genes to replace the 884 blue module genes. These hub genes included MMP2, COL3A1, COL1A2, FBN1, COL5A1, COL5A2, and AEBP1. There were significant differences (with lower p values) between eigengene expression of the top seven hub genes and tumor stages in the three modeling datasets (p = 0.0003025–0.01211) and in four validation datasets (p = 0.0009515–0.02184) (Figure 4B).
Validation of the robust correlation between yellow module eigengene expression and SOC grades
Significant differences were found between the yellow module eigengene expression values and different tumor grades in all modeling and validation datasets. Similarly, positive correlations between eigengene expression and tumor grades were demonstrated in all boxplots. There were significant differences between any pair of grade 1, grade 2, and grade 3 SOC in GSE9891 (p = 6.43e-09) and TCGA (p = 7.259e-06). Meanwhile, in GSE26193 (p = 0.0014), GSE20565 (p = 0.0002), TCGA.RNASeqV2 (p = 8.613e-05), and PMID15897565 (p = 0.0065), differences appeared between grade 1 and grade 2, as well as between grade 1 and grade 3. Additionally, significant differences in eigengene expressions between grade 2 and grade 3 tumors were found in GSE17260 (p = 0.0329) and GSE49997 (p = 0.04619). We next used the top seven hub genes: CDK1, BUB1, BUB1B, BIRC5, AURKB, CENPA, and CDC20 to replace 561 yellow module genes. There were significant differences between the eigengene expression values of the top seven hub genes and tumor grades in the three modeling datasets and in four validation datasets (Figure 5B).
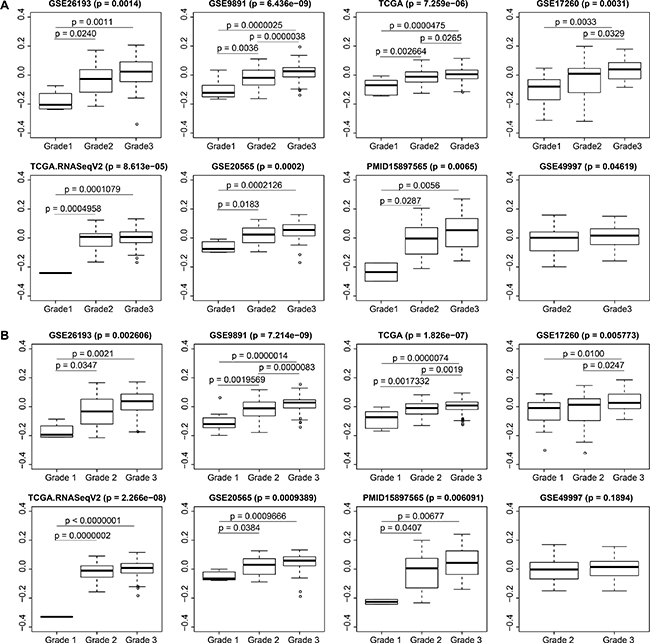
Figure 5: Distributions of yellow module eigengene expression among traits in modeling and validation datasets. Overall p-values and pairwise p values are shown. (A) 561 genes; (B) top 7 genes.
DISCUSSION
In this study we integrated large-scale transcriptional profiling, incorporating three modeling datasets with 788 SOC samples, to identify robust co-expression modules associated with cancer characteristics. Our long-term goal was to provide insights into disease biology and diagnostic classification, which may cover the shortage of objectivity in postoperative pathological diagnosis and guide early-phase clinical therapeutic applications. We also determined that co-expression networks reflect causative relationships between gene-gene interactions. First, this study constructed two SOC-stage-specific (blue and ivory) and two grade-specific (yellow and white) modules based on ten random datasets sampled from 788 SOC samples. Second, we identified the shared hub genes in these ten datasets and found mutual subnetwork hub genes from the high-quality STRING protein interaction database for the blue and yellow modules. Third, we illustrated hub gene interactions and performed gene enrichment analysis on GO and pathway terms. Extracellular matrix organization genes were enriched for stage-related modules (blue), while cell cycle genes were enriched for grade-related modules (yellow). Then, we validated the correlations between module eigengene expression and tumor stages or grades in modeling datasets and other public validation datasets that were not used to build co-expression networks but showed ideal robustness.
The top hub genes within the blue module included FBN1, COL5A1, COL5A2, and AEBP1. A gene intersection set of the top 25 hub genes among the ten random sampling datasets and the high-quality STRING database contained MMP2, COL3A1, and COL1A2. The last two collagen (COL) proteins interacted with each other directly and with MMP2 through COL16A1. According to previous studies on ovarian cancer biomarkers, FBN1 and MMP2 were found to be metastasis-promoting markers that were stimulated or suppressed by Aurora-A or BRCA2. Clinically, high expression of FBN1 indicated poor disease-free survival [19] and overall survival [20]. COL5A1 and AEBP1 were also reported as metastatic signatures associated with poor overall survival in SOC [21]. The expression of COL3A1, COL5A2, and COL1A2 was also studied by immunocytochemistry and western blot analysis and found to be associated to drug-resistance in ovarian cancer [22]. ECM-receptor interaction was enriched based on the KEGG pathway in our study, while COL3A1, COL5A2, and COL2A1 were regarded as potential ECM components associated with cytostatic drug resistance in ovarian cancer cells [23]. Consequently, both top hub genes and intersection set genes all had close relationships with ovarian cancer, however, the exact roles of these hub genes in ovarian tumorigenesis, metastasis or drug resistance remain unknown. Our gene module co-expression network may provide clues to the complex regulatory networks between these various molecular components. Additionally, the blue module was related to different tumor stages and its eigengene expression values can be utilized as a more objective staging system to improve current clinical-pathological staging systems.
The gene intersection set of the yellow module hub genes and the high-quality STRING database contained CDK1, BUB1, BUB1B, BIRC5, AURKB, CENPA, and CDC20. The last six genes interacted with each other directly, while CDK1 interacted with CENPA through FOXM1. Cytoplasmic CDK1 overexpression was correlated with cancer growth and poor overall survival in 249 EOCs [24]. CDK1 was also found to be a potential target of transcription factors to regulate paclitaxel resistance in EOC patients [25]. While a few EOC studies implicated BUB1, BUB1B, BIRC5, AURKB, CENPA, and CDC20, multiple studies in contrast identified aberrantly increased expression of FOXM1 and its regulatory factors [26–29]. Overexpression of BUB1 was reported in non-small cell lung cancer [30] and breast cancer [31]. TPX2 (Targeting Protein for Xklp2), CENPA, and KIF4A were the top three hub genes in most of the ten sets. Although the function of TPX2 in EOC pathology is unknown, it was reported as a biomarker of poor survival in 143 EOC patients [32]. In cervical cancer, the expression of TPX2 was correlated with histological grading, FIGO staging, and lymph node metastasis [33]. Additionally, TPX2 was verified as a target gene of microRNA-491 in esophageal cancer and played a critical role in cancer cell invasion in both esophageal [34] and colon cancer [35]. Moreover, TPX2 was found to be a binding partner and activator of AURKA [36]. KIF4A, on the other hand, is critical for mitotic regulation, including chromosome condensation, spindle organization, and cytokinesis [37]. Abnormal expression of KIF4A induced apoptosis in breast cancer [38] and metastatic invasion in lung cancer [39]. In summary, compared with blue module hub genes, much less is known about the molecular actions of the yellow module hub genes. Research on these hub genes is imperative to fully uncover how alterations in cell differentiation relate to SOC.
Due to the high heterogeneity of gene expression profiles, it is more difficult to find shared co-expression networks across databases of ovarian cancers than it is for other types of tumors. Although some significant modules were detected among very few datasets, these modules may not provide accurate information on actual biological characteristics of tumors. In one network analysis of ovarian cancer, COL5A2, TPX2, and BIRIC5 were also identified as hub genes using the joint sparse regression model [40]. Another study built a Bayesian network model, which used only the TCGA dataset and 68 seed genes reported in the literature [41]. In another publication, WGCNA was performed based on TCGA RNA-sequencing data and only studied TP53 mutations [15]. To the best of our knowledge, our study is the first to construct a thorough and weighted co-expression network analysis of gene expression relationships with prognostic factors and outcome. Moreover, 788 SOC patients were used to build the WGCNA model and another 778 patients were used to validate it. Since the yellow module eigengene expression showed a negative correlation with cell differentiation and its distribution showed significant differences among distinct tumor grades, we conclude that there is some regulatory causality between hub genes expression profiles and tumor grades. This is relevant, inasmuch as high-grade SOCs entail significantly higher risk of death than low-grade ones, while the existing grading system does not reliably differentiate grade 2 from grade 1 or grade 3 patients. We speculated that hub gene expression could be used to represent a true continuum from grade 1 to 3 and reliably divide grade 2 SOCs into low-grade and high-grade groups. Our future work will further refine and validate the above classification method in multicenter prospective studies including SOC patients with various tumor grades.
MATERIALS AND METHODS
Datasets filtering
The ovarian cancer datasets were adopted from the curatedOvarianData Bioconductor package [16]. This package represents a manually curated data collection for gene expression meta-analysis of patients with ovarian cancer, and includes both uniformly prepared microarray data and curated and documented clinical metadata. According to our special rules, only datasets and samples that contain tumor stage and grade information, as well as survival data (recurrence status, vital status, recurrence time, and vital time) were reserved. Accordingly, GSE17260, TCGA.RNASeqV2, and GSE49997 datasets were excluded from the validation sets due to absence of stage I or stage II patient data. GSE20565 and PMID15897565 were added into the validation sets as they contained complete grade and stage information. All the datasets were originated from both microarrays platforms (hthgu133a, hgu133plus2, and hgug4112a) and RNA-seq technologies. We finally kept three modeling and five validation datasets (Table 3). To adapt to gene co-expression network analysis, only the common genes in all 3 modeling datasets were kept. Adjustment for batch effects was performed using the ComBat method [42], and 788 patients were randomly sampled to form ten datasets, extracting half of the total samples each time. These ten sets were used to construct a gene co-expression network.
Table 3: The top 25 hub genes of the yellow module through ten datasets and the high-quality STRING subnetwork
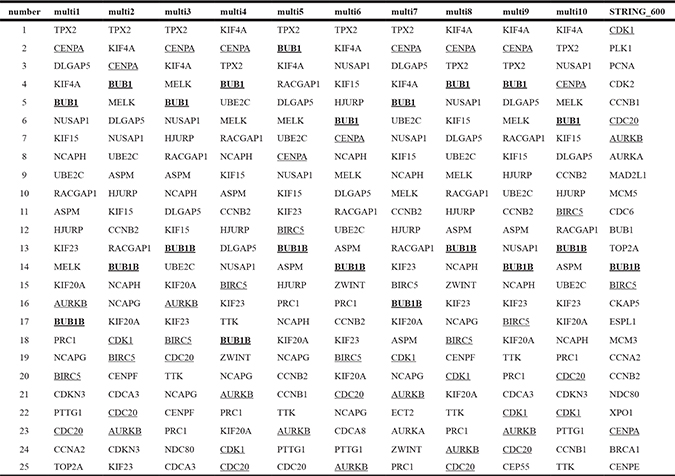
d1–d10: ten datasets sampled from the modeling datasets.
Gene co-expression network construction
Gene co-expression network analysis was performed using the R package WGCNA [9]. The process is summarized as follows. First, a matrix of pairwise correlations between all pairs of genes across all selected samples was constructed. Second, we chose 3 as the proper soft-thresholding power to which co-expression similarity is raised to achieve consistent scale-free topology in multiple datasets (Figure 1A). Third, with the chosen power value, we performed automatic network construction and module detection with the following major parameters: maxBlockSize of 20000, minModuleSize of 40, deepSplit of 4, and mergeCutHeight of 0.25. This procedure comprised calculation of network adjacencies and topological overlap dissimilarities, followed by scaling of topological overlap matrices and calculation of consensus topological overlap. Then, we built a hierarchical clustering dendrogram of gene expression data for each dataset, and performed adaptive branch cutting to identify shared functional modules. Some modules with similar expression profiles were merged, according to pre-defined parameters (Figure 1B) [43].
Calculation of module-trait correlations and module preservation
Next, we determined correlations among gene expression modules and clinical traits for each of the above ten data sets. Tumor stage and grade, as well as survival data (recurrence status, vital status, recurrence time, and vital time) were chosen as clinical traits. Modules having significant relationships with one or more traits are shown in Supplementary Figure 1. After the above procedures, modules shared in ten or nine sets were detected (Figure 1C–1E). Modules were labeled using a conventional color scheme.
A WGCNA integrated function (modulePreservation) was used to calculate module preservation statistics and the Z summary score (Z score) was applied to evaluate whether a module was conserved or not [19].
Calculation of eigengene expression
In the co-expression network, the first principal component (PC) of each module’s gene expression matrix is referred to as the module eigengene (ME), a single value that represents the highest percent of variance for expression values for all module genes in a sample [44]. Thus, the expression profiles of module genes can be summarized as the expression profile of MEs. For convenience, ME expressions were used to discuss the correlation of gene expression modules with clinical traits. Moreover, module similarities can be measured with MEs, and some modules with high similarities can be merged according to a predefined threshold. Expression distribution differences in ME among multiple tumor grades or stages were calculated via nonparametric Kruskal-Wallis tests based on a null distribution inferred from permutation. If statistical significance existed among grades or stages, pairwise differences were estimated by Tukey’s HSD tests, and pairwise p values adjusted by the BH method (Figures 4–5).
Hub gene identification
To evaluate the interactions of module genes and identify hub genes in each dataset, we calculated their in-module connectivity from the scale-free, weighted gene co-expression networks established in the ten sets as defined above. The connectivity of one node was defined as the sum of correlation coefficients with other nodes in a ‘signed’ topological overlap matrix (TOM) based on an adjacency matrix. For illustration purposes, we only extracted the top 200 strongest connections within the blue and yellow modules from each set to show the distribution of hub genes (Supplementary Figures 2 and 3).
Furthermore, we extracted a subnetwork with module genes from the high quality STRING protein interaction database (combined score ≥ 600) (Figures 2A and 3A) [45]. Since the STRING database weights and integrates information from numerous sources, including experimental repositories, computational prediction methods and public text collections, we only parsed the high-quality part of it, hoping to get a convincing interaction subnetwork of our module genes. The subnetwork was illustrated with Gephi [46].
Enrichment analysis
Enrichment analysis was based on either Fisher’s exact test or hypergeometric test using the R package dnet [47]. We employed the hypergeometric test to estimate enrichment significance in our modules, and the p values were batch-adjusted with the BH method. All the enriched terms are represented as word clouds, whit font grayscales and sizes proportional to their enrichment significance [48] (Figures 2B and 3B).
CONFLICTS OF INTEREST
The authors indicate no potential conflicts of interest.
FUNDING
This study was supported by the National Basic Research Program of China (973 Program, 2015CB553903), the National Science-technology Support Plan Projects 2015BAI13B05, and Nature and Science Foundation of China (81472783, 81630060, 81502258, 81272859, 30801340, 81230038, 81202061, 81402163, 81402164, 81472444, 81302266, 81572725, G30973184, WJ2015MA001).
REFERENCES
1. Siegel RL, Miller KD, Jemal A. Cancer statistics, 2015. CA Cancer J Clin. 2015; 65:5–29. doi: 10.3322/caac.21254.
2. Seidman JD, Horkayne-Szakaly I, Haiba M, Boice CR, Kurman RJ, Ronnett BM. The histologic type and stage distribution of ovarian carcinomas of surface epithelial origin. Int J Gynecol Pathol. 2004; 23:41–4. doi: 10.1097/01.pgp.0000101080.35393.16.
3. Jayson GC, Kohn EC, Kitchener HC, Ledermann JA. Ovarian cancer. Lancet. 2014; 384:1376–88. doi: 10.1016/S0140-6736(13)62146-7.
4. Hannibal CG, Vang R, Junge J, Kjaerbye-Thygesen A, Kurman RJ, Kjaer SK. A binary histologic grading system for ovarian serous carcinoma is an independent prognostic factor: a population-based study of 4317 women diagnosed in Denmark 1978-2006. Gynecol Oncol. 2012; 125:655–60. doi: 10.1016/j.ygyno.2012.02.028.
5. Cancer Genome Atlas Research Network. Integrated genomic analyses of ovarian carcinoma. Nature. 2011; 474:609–15. doi: 10.1038/nature10166.
6. Tothill RW, Tinker AV, George J, Brown R, Fox SB, Lade S, Johnson DS, Trivett MK, Etemadmoghadam D, Locandro B, Traficante N, Fereday S, Hung JA, et al. Novel molecular subtypes of serous and endometrioid ovarian cancer linked to clinical outcome. Clin Cancer Res. 2008; 14:5198–208. doi: 10.1158/1078-0432.CCR-08-0196.
7. Verhaak RG, Tamayo P, Yang JY, Hubbard D, Zhang H, Creighton CJ, Fereday S, Lawrence M, Carter SL, Mermel CH, Kostic AD, Etemadmoghadam D, Saksena G, et al. Prognostically relevant gene signatures of high-grade serous ovarian carcinoma. J Clin Invest. 2013; 123:517–25. doi: 10.1172/JCI65833.
8. Miller JA, Horvath S, Geschwind DH. Divergence of human and mouse brain transcriptome highlights Alzheimer disease pathways. Proc Natl Acad Sci USA. 2010; 107:12698–703. doi: 10.1073/pnas.0914257107.
9. Langfelder P, Horvath S. WGCNA: an R package for weighted correlation network analysis. BMC Bioinformatics. 2008; 9:559. doi: 10.1186/1471-2105-9-559.
10. Horvath S, Dong J. Geometric interpretation of gene coexpression network analysis. PLoS Comput Biol. 2008; 4:e1000117. doi: 10.1371/journal.pcbi.1000117.
11. Shi Z, Derow CK, Zhang B. Co-expression module analysis reveals biological processes, genomic gain, and regulatory mechanisms associated with breast cancer progression. BMC Syst Biol. 2010; 4:74. doi: 10.1186/1752-0509-4-74.
12. Ma S, Huang Y, Huang J, Fang K. Gene network-based cancer prognosis analysis with sparse boosting. Genet Res (Camb). 2012; 94:205–21. doi: 10.1017/S0016672312000419.
13. Levine AJ, Miller JA, Shapshak P, Gelman B, Singer EJ, Hinkin CH, Commins D, Morgello S, Grant I, Horvath S. Systems analysis of human brain gene expression: mechanisms for HIV-associated neurocognitive impairment and common pathways with Alzheimer’s disease. BMC Med Genomics. 2013; 6:4. doi: 10.1186/1755-8794-6-4.
14. Chou WC, Cheng AL, Brotto M, Chuang CY. Visual gene-network analysis reveals the cancer gene co-expression in human endometrial cancer. BMC Genomics. 2014; 15:300. doi: 10.1186/1471-2164-15-300.
15. Oros Klein K, Oualkacha K, Lafond MH, Bhatnagar S, Tonin PN, Greenwood CM. Gene Coexpression Analyses Differentiate Networks Associated with Diverse Cancers Harboring TP53 Missense or Null Mutations. Front Genet. 2016; 7:137. doi: 10.3389/fgene.2016.00137.
16. Ganzfried BF, Riester M, Haibe-Kains B, Risch T, Tyekucheva S, Jazic I, Wang XV, Ahmadifar M, Birrer MJ, Parmigiani G, Huttenhower C, Waldron L. curatedOvarianData: clinically annotated data for the ovarian cancer transcriptome. Database (Oxford). 2013; 2013: bat013. doi: 10.1093/database/bat013.
17. Gentleman RC, Carey VJ, Bates DM, Bolstad B, Dettling M, Dudoit S, Ellis B, Gautier L, Ge Y, Gentry J, Hornik K, Hothorn T, Huber W, et al. Bioconductor: open software development for computational biology and bioinformatics. Genome Biol. 2004; 5:R80. doi: 10.1186/gb-2004-5-10-r80.
18. Langfelder P, Luo R, Oldham MC, Horvath S. Is my network module preserved and reproducible? PLoS Comput Biol. 2011; 7:e1001057. doi: 10.1371/journal.pcbi.1001057.
19. Zhang W, Ota T, Shridhar V, Chien J, Wu B, Kuang R. Network-based survival analysis reveals subnetwork signatures for predicting outcomes of ovarian cancer treatment. PLoS Comput Biol. 2013; 9:e1002975. doi: 10.1371/journal.pcbi.1002975.
20. Wang Z, Liu Y, Lu L, Yang L, Yin S, Wang Y, Qi Z, Meng J, Zang R, Yang G. Fibrillin-1, induced by Aurora-A but inhibited by BRCA2, promotes ovarian cancer metastasis. Oncotarget. 2015; 6:6670–83. doi: 10.18632/oncotarget.3118.
21. Cheon DJ, Tong Y, Sim MS, Dering J, Berel D, Cui X, Lester J, Beach JA, Tighiouart M, Walts AE, Karlan BY, Orsulic S. A collagen-remodeling gene signature regulated by TGF-beta signaling is associated with metastasis and poor survival in serous ovarian cancer. Clin Cancer Res. 2014; 20:711–23. doi: 10.1158/1078-0432.CCR-13-1256.
22. Januchowski R, Swierczewska M, Sterzynska K, Wojtowicz K, Nowicki M, Zabel M. Increased Expression of Several Collagen Genes is Associated with Drug Resistance in Ovarian Cancer Cell Lines. J Cancer. 2016; 7:1295–310. doi: 10.7150/jca.15371.
23. Januchowski R, Zawierucha P, Rucinski M, Zabel M. Microarray-based detection and expression analysis of extracellular matrix proteins in drugresistant ovarian cancer cell lines. Oncol Rep. 2014; 32:1981–90. doi: 10.3892/or.2014.3468.
24. Wookyeom Y, Hanbyoul C, Ha-Yeon S, Joon-Yong C, Kang ES, Eun-Ju L, Jae-Hoon K. Accumulation of cytoplasmic Cdk1 is associated with cancer growth and survival rate in epithelial ovarian cancer. Oncotarget. 2016; 7:49481–49497. doi: 10.18632/oncotarget.10373.
25. Bae T, Weon KY, Lee JW, Eum KH, Kim S, Choi JW. Restoration of paclitaxel resistance by CDK1 intervention in drug-resistant ovarian cancer. Carcinogenesis. 2015; 36:1561–71. doi: 10.1093/carcin/bgv140.
26. Wang Y, Yun Y, Wu B, Wen L, Wen M, Yang H, Zhao L, Liu W, Huang S, Wen N, Li Y. FOXM1 promotes reprogramming of glucose metabolism in epithelial ovarian cancer cells via activation of GLUT1 and HK2 transcription. Oncotarget. 2016; 7:47985–97. doi: 10.18632/oncotarget.10103.
27. Barger CJ, Zhang W, Hillman J, Stablewski AB, Higgins MJ, Vanderhyden BC, Odunsi K, Karpf AR. Genetic determinants of FOXM1 overexpression in epithelial ovarian cancer and functional contribution to cell cycle progression. Oncotarget. 2015; 6:27613–27. doi: 10.18632/oncotarget.4546.
28. Chan DW, Hui WW, Wang JJ, Yung MM, Hui LM, Qin Y, Liang RR, Leung TH, Xu D, Chan KK, Yao KM, Tsang BK, Ngan HY. DLX1 acts as a crucial target of FOXM1 to promote ovarian cancer aggressiveness by enhancing TGF-beta/SMAD4 signaling. Oncogene. 2016; 36:1404–1416. doi: 10.1038/onc.2016.307.
29. Fan Q, Cai Q, Xu Y. FOXM1 is a downstream target of LPA and YAP oncogenic signaling pathways in high grade serous ovarian cancer. Oncotarget. 2015; 6:27688–99. doi: 10.18632/oncotarget.4280.
30. Zhang C, Min L, Zhang L, Ma Y, Yang Y, Shou C. Combined analysis identifies six genes correlated with augmented malignancy from non-small cell to small cell lung cancer. Tumour Biol. 2015; 37:2193–207. doi: 10.1007/s13277-015-3938-5.
31. Mukherjee A, Joseph C, Craze M, Chrysanthou E, Ellis IO. The role of BUB and CDC proteins in low-grade breast cancers. Lancet. 2015; 385:S72. doi: 10.1016/S0140-6736(15)60387-7.
32. Caceres-Gorriti KY, Carmona E, Barres V, Rahimi K, Letourneau IJ, Tonin PN, Provencher D, Mes-Masson AM. RAN nucleo-cytoplasmic transport and mitotic spindle assembly partners XPO7 and TPX2 are new prognostic biomarkers in serous epithelial ovarian cancer. PLoS One. 2014; 9:e91000. doi: 10.1371/journal.pone.0091000.
33. Chang H, Wang J, Tian Y, Xu J, Gou X, Cheng J. The TPX2 gene is a promising diagnostic and therapeutic target for cervical cancer. Oncol Rep. 2012; 27:1353–9. doi: 10.3892/or.2012.1668.
34. Niu H, Gong L, Tian X, Fang L, Wang C, Zhu Y. Low Expression of miR-491 Promotes Esophageal Cancer Cell Invasion by Targeting TPX2. Cell Physiol Biochem. 2015; 36:2263–73. doi: 10.1159/000430190.
35. Wei P, Zhang N, Xu Y, Li X, Shi D, Wang Y, Li D, Cai S. TPX2 is a novel prognostic marker for the growth and metastasis of colon cancer. J Transl Med. 2013; 11:313. doi: 10.1186/1479-5876-11-313.
36. Anderson K, Yang J, Koretke K, Nurse K, Calamari A, Kirkpatrick RB, Patrick D, Silva D, Tummino PJ, Copeland RA, Lai Z. Binding of TPX2 to Aurora A alters substrate and inhibitor interactions. Biochemistry. 2007; 46:10287–95. doi: 10.1021/bi7011355.
37. Wu G, Chen PL. Structural requirements of chromokinesin Kif4A for its proper function in mitosis. Biochem Biophys Res Commun. 2008; 372:454–8. doi: 10.1016/j.bbrc.2008.05.065.
38. Wang H, Lu C, Li Q, Xie J, Chen T, Tan Y, Wu C, Jiang J. The role of Kif4A in doxorubicin-induced apoptosis in breast cancer cells. Mol Cells. 2014; 37:812–8. doi: 10.14348/molcells.2014.0210.
39. Taniwaki M, Takano A, Ishikawa N, Yasui W, Inai K, Nishimura H, Tsuchiya E, Kohno N, Nakamura Y, Daigo Y. Activation of KIF4A as a prognostic biomarker and therapeutic target for lung cancer. Clin Cancer Res. 2007; 13:6624–31. doi: 10.1158/1078-0432.CCR-07-1328.
40. Hong S, Dong H, Jin L, Xiong M. Gene co-expression network and functional module analysis of ovarian cancer. Int J Comput Biol Drug Des. 2011; 4:147–64. doi: 10.1504/IJCBDD.2011.041008.
41. Zhang Q, Burdette JE, Wang JP. Integrative network analysis of TCGA data for ovarian cancer. BMC Syst Biol. 2014; 8:1338. doi: 10.1186/s12918-014-0136-9.
42. Leek JT, Johnson WE, Parker HS, Fertig EJ, Jaffe AE, Storey JD. sva: Surrogate Variable Analysis. R package version 3.24.0. 2017.
43. Langfelder P, Horvath S. Fast R Functions for Robust Correlations and Hierarchical Clustering. J Stat Softw. 2012; 46.
44. Langfelder P, Horvath S. Eigengene networks for studying the relationships between co-expression modules. BMC Syst Biol. 2007; 1:54. doi: 10.1186/1752-0509-1-54.
45. Jensen LJ, Kuhn M, Stark M, Chaffron S, Creevey C, Muller J, Doerks T, Julien P, Roth A, Simonovic M, Bork P, von Mering C. STRING 8—a global view on proteins and their functional interactions in 630 organisms. Nucleic Acids Res. 2009; 37:D412–6. doi: 10.1093/nar/gkn760.
46. Bastian M, Heymann S, Jacomy M. Gephi: an open source software for exploring and manipulating networks. ICWSM. 2009; 8:361–2.
47. Fang H, Gough J. The ‘dnet’ approach promotes emerging research on cancer patient survival. Genome Med. 2014; 6:64. doi: 10.1186/s13073-014-0064-8.
48. Kolde R. GOsummaries: Word cloud summaries of GO enrichment analysis. R package version 220. 2014.