
INTRODUCTION
Prostate cancer (PCa) is the most common cancer and the third leading cause of cancer-related deaths among males in developed countries [1]. Approximately 233,000 new cases were expected to be diagnosed with 29,480 estimated deaths in the USA in 2014 [2]. However, the underlying etiology of PCa is poorly understood. The most recognized factors associated with PCa risk include age, ethnicity, cigarette smoking, and alcohol consumption and so on. In addition, it was suggested that several genetic polymorphisms could influence an individual’s susceptibility to PCa [3, 4]
Distinguishing the genetic variants that increase the risk of more advanced disease is important for improving regimens for screening, diagnosis, and the treatment of prostate cancer [5, 6]. A region on chromosome - 8q24 was first shown to confer a PCa risk in a genome-wide linkage scan of 871 Icelandic men [6, 7]. Subsequently multiple independent studies with compelling evidence demonstrated that the risk of PCa was influenced by the genetic variations in the region of 8q24 independently [6, 7].
One polymorphism in region of 8q24, rs1447295 (A/C, A was considered as risk allele), has been reported a genome-wide association studies (GWAS) association with PCa risk [7, 8]. It was reported that rs1447295 polymorphism was associated with greater tumor aggressivenessin African Americans [9] and American Whites [10], advanced stage diseases in Eastern Whites [11] and African American [9, 12]. Although there were numerous studies investigating the association between rs1447295 and the risk of PCa, the results were incomplete and cursory. Amundadottir et al. [7] showed that the rs1447295 riskallele tended to be more strongly associated with Gleason score 7–10 tumors than with Gleason score 2–6 tumors in African Americans and American Whites. However, this trend did not appear to translate to Eastern White populations [7, 13]. The relationship between PCa risk and this SNP did not appear to be affected by PSA level in Eastern Whites [11, 14]. Besides, Zheng et al. [11] showed that this allele was associated with a younger age at onset in Eastern Whites, but Schumacher et al. [15] and Zheng et al. [16] didn’t show such evidence. Those contradictory results make it imperative to do a comprehensive analysis to clear up the confusion.
To meet this demand, we did a pilot study to analyze the association of rs1447295 polymorphism and different prostate cancer clinical characteristics, including Gleason score, tumor stage and PSA level. Meanwhile, we also performed a meta-analysis to offer a more comprehensive estimation of the association between rs1447295 and PCa susceptibility in three different ethic subgroups – American, Asian and European descents.
RESULTS
Characteristics of studies
A total of 208 articles were retrieved after the first search, among which 81 articles contained case-control studies targeting at prostate cancer. We removed the articles without the exact quantity information about the genotypes of rs1447295 and those studies with overlapping samples. To simplify the analysis, we restricted our study subjects only as American descent, Asian descent and European descent. Finally, 27 case-control studies from 20 articles were suitable for our meta-analysis as shown in Table 1 [Among these, 12 studies were about American descent, 7 studies were about European descent and 8 studies were about Asian descent]. All the data in these studies were related to association between 8q24 rs1447295 A/C polymorphism and human PCa susceptibility. The flow chart of selecting studies and the reasons for exclusion were presented in Figure 1. Table 1 presented the following characteristics collected from each study: year of publication and first author, race or ethnicity of samples, exact quantity of each genotype for cases and controls, HWE (Hardy-Weinberg equilibrium) p value and genotyping method. We also collected the clinical characteristic of cases, including Gleason score, tumor stage and PSA (prostate level).
Table 1: Characteristics of studies on association between rs1447295 polymorphism and prostate cancer included in our meta-analysis
Literature |
Race/ethnic group |
Case |
Control |
HWE p value |
Genotyping method |
|||||
|---|---|---|---|---|---|---|---|---|---|---|
CC |
AC |
AA |
CC |
AC |
AA |
Case |
Control |
|||
2014, Cropp [29] |
African-Barbadian |
223 |
224 |
68 |
226 |
215 |
66 |
0.35 |
0.34 |
Infinium Human 1M-Duo |
2014, Oskina [19] |
Russian |
291 |
93 |
8 |
292 |
50 |
1 |
0.858 |
0.454 |
Real-time PCR |
2009, Meyer [25] |
Caucasian German |
365 |
107 |
14 |
370 |
90 |
2 |
0.079 |
0.157 |
TaqMan |
2009, Beuten [18] |
Caucasian |
452 |
117 |
8 |
668 |
139 |
6 |
0.891 |
0.674 |
The Gold Gate Assay |
2008, Salinas [17] |
Caucasian American |
937 |
288 |
27 |
994 |
225 |
14 |
0.382 |
0.752 |
ABI 3730xl DNA Analyzer |
2008, Cheng [5] |
European American |
318 |
97 |
2 |
344 |
69 |
4 |
0.058 |
0.795 |
TaqMan Assay |
2007, Zheng [11] |
European American |
1169 |
346 |
31 |
485 |
82 |
4 |
0.365 |
0.794 |
PCR |
2007, Yeager(a) [8] |
European American, PLCO |
864 |
283 |
25 |
929 |
218 |
10 |
0.747 |
0.476 |
NA |
2007, Yeager(b) [8] |
European American, ACS |
891 |
236 |
23 |
973 |
169 |
9 |
0.117 |
0.579 |
NA |
2007, Yeager(c) [8] |
European, ATBC |
564 |
291 |
39 |
614 |
256 |
26 |
0.85 |
0.912 |
NA |
2007, Yeager(d) [8] |
European, FPCC |
351 |
98 |
6 |
394 |
63 |
2 |
0.775 |
0.759 |
NA |
2007, Yeager(e) [8] |
European American, HPFS |
469 |
147 |
9 |
526 |
106 |
4 |
0.509 |
0.59 |
NA |
2007, Suuriniemi [26] |
Caucasian American |
435 |
136 |
11 |
427 |
107 |
4 |
0.922 |
0.333 |
TaqMan Assay |
2007, Schumacher(a) [15] |
Caucasian, EPIC |
551 |
169 |
12 |
869 |
233 |
12 |
0.816 |
0.407 |
TaqMan Assay |
2007, Schumacher(b) [15] |
Caucasian, PHS |
760 |
190 |
19 |
1054 |
196 |
14 |
0.084 |
0.156 |
TaqMan Assay |
2007, Severi [27] |
European Australian |
595 |
212 |
14 |
586 |
135 |
11 |
0.322 |
0.319 |
TaqMan |
2007, Haiman(a) [6] |
European American |
893 |
257 |
18 |
770 |
160 |
8 |
0.920 |
0.922 |
Illumina BeadStudio, Sequenom MassArray, hME or ABI TaqMan |
2006, Amundadottir(a) [7] |
European, Iceland |
873 |
352 |
37 |
766 |
172 |
15 |
0.833 |
0.142 |
TaqMan or Centaurus platforms or by sequencing |
2006, Amundadottir(b) [7] |
European American |
324 |
91 |
7 |
204 |
39 |
0 |
0.834 |
0.174 |
TaqMan or Centaurus platforms or by sequencing |
2013, Chan [13] |
Singaporean Chinese |
180 |
92 |
17 |
94 |
44 |
5 |
0.260 |
0.957 |
Illumina human 1M BeadChip and Affymetrix Genome Wide Human SNP Array or PCR |
2012, Joung [22] |
Korean |
114 |
67 |
12 |
127 |
38 |
3 |
0.611 |
0.936 |
MassArray |
2011, Liu [21] |
Han Chinese |
514 |
252 |
38 |
946 |
378 |
28 |
0.323 |
0.168 |
MassArray |
2010, Zheng [24] |
Han Chinese |
173 |
96 |
15 |
110 |
35 |
6 |
0.725 |
0.147 |
MassArray |
2012, Liu [28] |
Han Chinese |
150 |
102 |
8 |
197 |
86 |
4 |
0.057 |
0.111 |
PCR and genotyped by LightScanner TMHR-I 96 |
2009, Liu [20] |
Native Japanese |
288 |
183 |
32 |
218 |
89 |
16 |
0.686 |
0.088 |
TaqMan assay |
2008, Terada [9] |
Native Japanese |
310 |
172 |
25 |
254 |
122 |
11 |
0.856 |
0.421 |
PCR-RFLP |
2007, Haiman(b) [6] |
Japanese American |
428 |
252 |
41 |
493 |
209 |
25 |
0.628 |
0.625 |
Illumina BeadStudio, Sequenom MassArray, hME or ABI TaqMan |
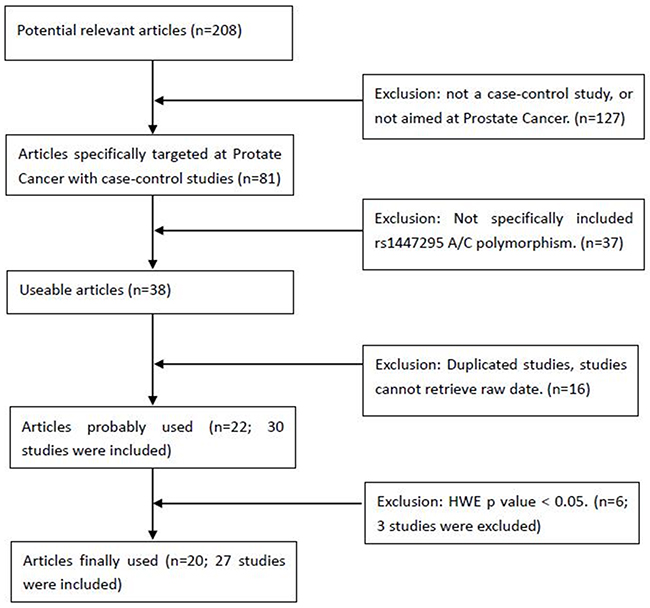
Figure 1: Flow chart of selecting studies with specific reasons for exclusion from the meta-analysis of rs1447295. 208 articles were searched for the first-round exclusion, and 27 studies were included in the final meta-analysis for rs1447295.
Evaluation of association between prostate cancer and rs1447295 polymorphism
Although many studies found the association between rs1447295 polymorphism and prostate cancer risk, the correlation of prostate cancer susceptibility and rs1447295 polymorphism is inconsistent. Therefore, we collected all the relevant studies with clear information of rs1447295 genotypes to address this question. Totally 27 case-control studies about association between prostate cancer and rs1447295 polymorphism were included in our analysis. For overall data, low heterogeneity was observed under all four rs1447295 gene models (for dominant model, I2 = 26.9%, p value = 0.100; for recessive model, I2 = 1.4%, p value = 0.443; for homozygote model, I2 = 3.1%, p value = 0.418; for additive model, I2 = 34.9%, p value = 0.039). Considering the low heterogeneity, M-H model was appropriate to apply. Detailed results were shown in Table 2. In general, significant prostate cancer risk was associated with rs1447295 polymorphism in all four models when all eligible studies were pooled together. For dominant model, the overall OR was 1.440 [95%CI 1.371 - 1.511; p value < 0.001]; for recessive model, the overall OR was 1.753 [95%CI 1.520 - 2.023, p value < 0.001]; for homozygote model, the overall OR was 1.913 [95%CI 1.567 - 2.606, p value < 0.001]; for additive model, the overall OR was 1.402 [95%CI 1.343 - 1.464, p value < 0.001]. The forest plots of four models were shown in Figure 2(A-D). The results indicated that there’s a strong association between prostate cancer susceptibility and rs1447295 polymorphism and this was consistently observed under different genetic models.
Table 2: The summary results of total group, American Descent, European descent and Asian descent from dominant model (AA + AC vs. CC), recessive model (AA vs. AC + CC), homozygote model (AA vs. CC) and additive model (A vs. C) of rs1447295 A/C polymorphism
Analysis model |
Pooling model |
Heterogeneity |
OR (95% CI) |
Publication bias |
|||||
|---|---|---|---|---|---|---|---|---|---|
I2 |
p value |
Overall |
Lower |
Upper |
p value |
Begg’s test(p value) |
Egger’s test(p value) |
||
Total Group |
|||||||||
Dominant |
M-H |
26.9% |
0.100 |
1.440 |
1.371 |
1.511 |
< 0.001 |
0.113 |
0.156 |
Recessive |
M-H |
1.4% |
0.443 |
1.753 |
1.520 |
2.023 |
< 0.001 |
0.017 |
0.031 |
Homozygote |
M-H |
3.1% |
0.418 |
1.913 |
1.567 |
2.606 |
< 0.001 |
0.016 |
0.033 |
Additive |
M-H |
34.9% |
0.039 |
1.402 |
1.343 |
1.464 |
< 0.001 |
0.067 |
0.057 |
American Descent |
|||||||||
Dominant |
M-H |
23.6% |
0.212 |
1.390 |
1.299 |
1.488 |
< 0.001 |
0.048 |
0.876 |
Recessive |
M-H |
24.6% |
0.202 |
1.634 |
1.323 |
2.017 |
< 0.001 |
0.837 |
0.046 |
Homozygote |
M-H |
26.7% |
0.182 |
1.754 |
1.414 |
2.175 |
< 0.001 |
0.784 |
0.057 |
Additive |
M-H |
44.7% |
0.047 |
1.360 |
1.279 |
1.446 |
< 0.001 |
0.176 |
0.445 |
European Descent |
|||||||||
Dominant |
M-H |
38.9% |
0.133 |
1.560 |
1.417 |
1.716 |
< 0.001 |
0.063 |
0.194 |
Recessive |
M-H |
16.4% |
0.305 |
1.915 |
1.406 |
2.609 |
< 0.001 |
0.536 |
0.738 |
Homozygote |
M-H |
16% |
0.308 |
2.105 |
1.543 |
2.871 |
< 0.001 |
0.386 |
0.614 |
Additive |
M-H |
40.9% |
0.118 |
1.505 |
1.382 |
1.640 |
< 0.001 |
0.063 |
0.242 |
Asian Descent |
|||||||||
Dominant |
M-H |
7.6% |
0.371 |
1.421 |
1.286 |
1.570 |
< 0.001 |
0.368 |
0.457 |
Recessive |
M-H |
0 |
0.799 |
1.825 |
1.419 |
2.348 |
< 0.001 |
0.072 |
0.042 |
Homozygote |
M-H |
0 |
0.831 |
2.021 |
1.567 |
2.606 |
< 0.001 |
0.051 |
0.037 |
Additive |
M-H |
0 |
0.512 |
1.386 |
1.273 |
1.510 |
< 0.001 |
0.230 |
0.214 |
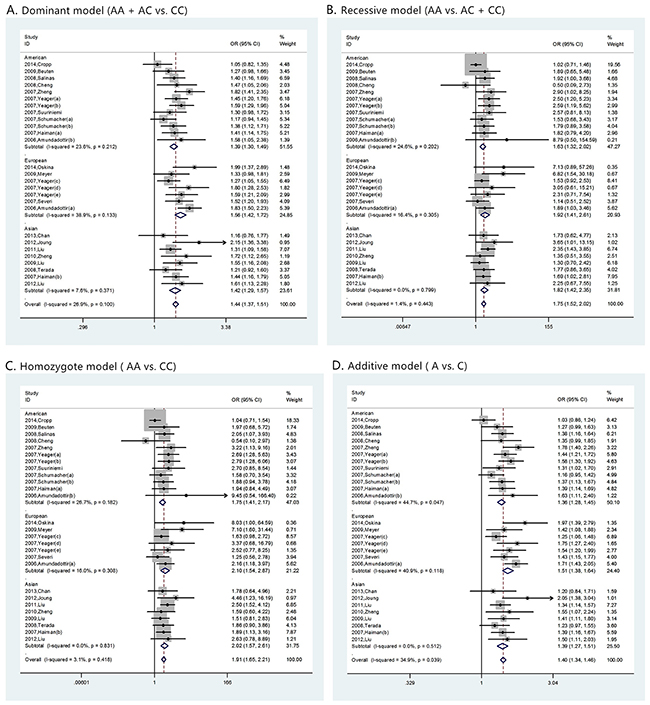
Figure 2: The forest plots of prostate cancer in different genetic models. (A) dominant model (AA + AC vs. CC); (B) recessive model (AA vs. AC + CC); (C) homozygote model (AA vs. CC); and (D) additive model (A vs. C). For each genetic model, the analysis was performed in Asian, American and European subgroups.
Meanwhile, we performed the similar analysis for the ethic subgroup database (Table 2). For American descent subgroup which included 12 studies, the M-H model was also applied in all four models considering the low heterogeneity (for dominant model, I2 = 23.6%, p value = 0.212; for recessive model, I2 = 24.6, p value = 0.202; for homozygote model, I2 = 26.7 p value = 0.182; for additive model, I2 = 44.7%, p value = 0.047). A significant prostate cancer risk associated with rs1447295 polymorphism was also found in all four models. For dominant model, the overall OR was 1.390 [95%CI 1.299 - 1.488; p value < 0.001]; for recessive model, the overall OR was 1.634 [95%CI 1.323 -2.017, p value < 0.001]; for homozygote model, the overall OR was 1.754 [95%CI 1.414 - 2.175, p value < 0.001]; for additive model, the overall OR was 1.360 [95%CI 1.279 - 1.446, p value < 0.001]. Corresponding forest plots of four models were shown in Figure 2(A-D).
For European descent subgroup which included 7 studies, the M-H model was also applied in all four models considering the low heterogeneity. (for dominant model, I2 = 38.9%, p value = 0.133; for recessive model, I2 = 16.4%, p value = 0.305; for homozygote model, I2 = 16%, p value = 0.308; for additive model, I2 = 40.9%, p value = 0.118). A significant prostate cancer risk associated with rs1447295 polymorphism was also found in all four models. For dominant model, the overall OR was 1.560 [95%CI 1.417 - 1.716; p value < 0.001]; for recessive model, the overall OR was 1.915 [95%CI 1.406 -2.609, p value < 0.001]; for homozygote model, the overall OR was 2.105 [95%CI 1.543 - 2.871, p value < 0.001; for additive model, the overall OR was 1.505 [95%CI 1.382 - 1.640, p value < 0.001]. Corresponding forest plots of four models were shown in Figure 2(A-D). For Asian descent subgroup which included 8 studies, the M-H model was also applied in all four models considering the low heterogeneity (for dominant model, I2 = 7.6%, p value = 0.371; for recessive model, I2 =0, p value = 0.799; for homozygote model, I2 = 0, p value = 0.831; for additive model, I2 = 0, p value = 0.512). A significant prostate cancer risk associated with rs1447295 polymorphism was also found in all four models. For dominant model, the overall OR was 1.421 [95%CI 1.286 - 1.570; p value < 0.001]; for recessive model, the overall OR was 1.825 [95%CI 1.419 - 2.348, p value < 0.001]; for homozygote model, the overall OR was 2.021 [95%CI 1.567 - 2.606, p value < 0.001; for additive model, the overall OR was 1.386 [95%CI 1.273 - 1.510, p value < 0.001]. Corresponding forest plots of four models were shown in Figure 2(A-D). The result indicated that rs1447295 had strong association with prostate cancer susceptibility regardless of American, European or Asian descent.
Evaluation of association between rs1447295 polymorphismand prostate cancer clinical characteristics
Prostate cancer clinical characteristics, such as Gleason score, tumor stage and PSA, are important indexes for evaluating the progress of this disease. Correlation between rs1447295 polymorphismand prostate cancer clinical characteristics has been touched before but not in systematic study. Clarification of the correlation is essential to assess the diagnosis value of rs1447295 polymorphism in different prostate cancer status. Therefore, in addition to overall and subgroup analyses, we evaluated the risk of rs1447295 with different prostate cancer clinical characteristics, including Gleason score, tumor stage and PSA level, and detailed results were shown in Table 3 and 4. As for the PCa cases with Gleason score not more than 7, in dominant model, the overall OR was 1.391 [95%CI 1.279 - 1.514; p value < 0.001]; in recessive model, the overall OR was 1.968 [95%CI 1.516 - 2.555, p value < 0.001]; in homozygote model, the overall OR was 2.039 [95%CI 1.566 - 2.654, p value < 0.001]; in additive model, the overall OR was 1.341 [95%CI 1.241 - 1.449, p value < 0.001]. For cases with Gleason score more than 7, in dominant model, the overall OR was 1.520 [95%CI 1.329 - 1.738; p value < 0.001]; in recessive model, the overall OR was 2.176 [95%CI 1.491 – 3.175, p value < 0.001]; in homozygote model, the overall OR was 2.295 [95%CI 1.563 – 3.370, p value < 0.001]; in additive model, the overall OR was 1.446 [95%CI 1.281 - 1.631, p value < 0.001]. Because of the limit of the clinical characteristics data, we only did the ethic subgroup analyses in American descent and Asian descent for Gleason score (Figure 3 and 4). As for the PCa cases with tumor stage 1 to 2, the risk allelic OR was 1.287 (95% CI 1.182 – 1.402; p value < 0.001); for cases with tumor stage 3 to 4, the risk allelic OR was 1.554 (95% CI 1.362 – 1.774; p value < 0.001). As for cases with PSA level not more than 10 ng/mL, the risk allelic OR was 1.274 (95% CI 1.034 – 1.568; p value = 0.023), for cases with PSA level more than 10 ng/mL, the risk allelic OR was 1.243 (95% CI 1.019 – 1.515; p value = 0.032). Due to the limited sample size, we were not able to perform detailed ethic subgroup analyses for tumor stage and PSA level. Corresponding forest plots were shown as Figure 5 and 6. These results suggested that rs1447295 polymorphism was associated with prostate cancer risk by different clinical characteristic stratifications and might serve as a solid and sensitive marker for prostate cancer diagnosis even in the early stage.
Table 3: Meta-analysis of rs1447295 with Gleason score
Analysis model |
Gleason score <= 7 |
Gleason score > 7 |
||||||||||||||
|---|---|---|---|---|---|---|---|---|---|---|---|---|---|---|---|---|
Heterogeneity |
OR (95% CI) |
Publication bias |
Heterogeneity |
OR (95% CI) |
Publication bias |
|||||||||||
I2 |
p value |
Overall |
Lower |
Upper |
p value |
Begg’s test (p value) |
Egger’s test (p value) |
I2 |
p value |
Overall |
Lower |
Upper |
p value |
Begg’s test (p value) |
Egger’s test (p value) |
|
Dominant |
||||||||||||||||
American |
0 |
0.665 |
1.420 |
1.292 |
1.560 |
< 0.001 |
0.317 |
0.245 |
8.6% |
0.296 |
1.497 |
1.271 |
1.761 |
< 0.001 |
0.327 |
0.106 |
Asian |
0 |
0.549 |
1.285 |
1.064 |
1.551 |
0.009 |
0.602 |
0.756 |
0 |
0.646 |
1.567 |
1.237 |
1.986 |
< 0.001 |
0.296 |
0.460 |
Total |
0 |
0.693 |
1.391 |
1.279 |
1.514 |
< 0.001 |
0.643 |
0.343 |
0 |
0.725 |
1.520 |
1.329 |
1.738 |
< 0.001 |
0.643 |
0.679 |
Recessive |
||||||||||||||||
American |
0 |
0.653 |
2.080 |
1.522 |
2.844 |
< 0.001 |
0.317 |
0.780 |
16.3% |
0.274 |
1.917 |
1.121 |
3.277 |
0.017 |
0.317 |
0.570 |
Asian |
0 |
0.407 |
1.728 |
1.074 |
2.782 |
0.024 |
0.602 |
0.831 |
19.0% |
0.130 |
2.458 |
1.435 |
4.210 |
0.001 |
0.602 |
0.360 |
Total |
0 |
0.676 |
1.968 |
1.516 |
2.555 |
< 0.001 |
0.355 |
0.393 |
21.8% |
0.223 |
2.176 |
1.491 |
3.175 |
< 0.001 |
0.520 |
0.741 |
Homozygote |
||||||||||||||||
American |
0 |
0.652 |
2.151 |
1.571 |
2.947 |
< 0.001 |
0.317 |
0.790 |
19.5% |
0.265 |
2.003 |
1.166 |
3.440 |
0.012 |
0.317 |
0.530 |
Asian |
0 |
0.379 |
1.792 |
1.103 |
2.909 |
0.018 |
0.602 |
0.806 |
17.2% |
0.151 |
2.626 |
1.512 |
4.562 |
0.001 |
0.602 |
0.360 |
Total |
0 |
0.654 |
2.039 |
1.566 |
2.654 |
< 0.001 |
0.355 |
0.376 |
23.2% |
0.240 |
2.295 |
1.563 |
3.370 |
< 0.001 |
0.520 |
0.739 |
Additive |
||||||||||||||||
American |
0 |
0.654 |
1.373 |
1.257 |
1.498 |
< 0.001 |
0.317 |
0.860 |
2.6% |
0.311 |
1.433 |
1.233 |
1.665 |
< 0.001 |
0.317 |
0.139 |
Asian |
0 |
0.574 |
1.235 |
1.047 |
1.456 |
0.012 |
0.602 |
0.872 |
0 |
0.557 |
1.468 |
1.198 |
1.799 |
< 0.001 |
0.286 |
0.410 |
Total |
0 |
0.643 |
1.341 |
1.241 |
1.449 |
< 0.001 |
0.462 |
0.419 |
0 |
0.693 |
1.446 |
1.281 |
1.631 |
< 0.001 |
0.643 |
0.708 |
Table 4: Meta-analysis of rs1447295 with tumor stage and PSA level, *represented allelic OR comparing case to control
Study |
Control |
Case |
||||||||||||
|---|---|---|---|---|---|---|---|---|---|---|---|---|---|---|
A |
C |
A |
C |
I2 p value |
Allelic OR* (95% CI) p value |
Publication bias |
A |
C |
I2 p value |
Allelic OR* (95% CI) p value |
Publication bias |
|||
Begg’s test > (p value) |
Egger’s test (p value) |
Begg’s test (p value) |
Egger’s test (p value) |
|||||||||||
Tumor stage 1-2 |
Tumor stage 3-4 |
|||||||||||||
2007, Schumacher [21] |
1178 |
9776 |
827 |
5327 |
0 0.474 |
1.287 (1.182-1.402) <0.001 |
0.573 |
0.699 |
237 |
1189 |
34.4% 0.206 |
1.554 (1.362-1.774) <0.001 |
0.473 |
0.249 |
2008, Terada [13] |
144 |
630 |
135 |
513 |
44 |
120 |
||||||||
2013, Chan [17] |
54 |
232 |
85 |
281 |
35 |
153 |
||||||||
2012, Liu [23] |
94 |
480 |
37 |
109 |
20 |
76 |
||||||||
PSA level <= 10ng/mL |
PSA level > 10ng/mL |
|||||||||||||
2008, Terada [13] |
144 |
630 |
84 |
330 |
18.5% 0.293 |
1.274 (1.034-1.568) 0.023 |
0.674 |
0.512 |
128 |
432 |
0 0.785 |
1.243 (1.019-1.515) 0.032 |
0.658 |
0.513 |
2013, Chan [17] |
54 |
232 |
56 |
192 |
53 |
209 |
||||||||
2012, Liu [23] |
94 |
480 |
47 |
145 |
40 |
160 |
||||||||
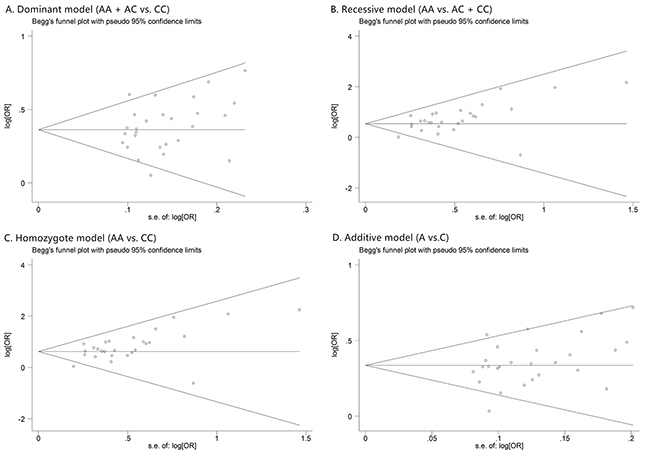
Figure 3: The forest plots of prostate cancer that has Gleason score <= 7 in different genetic models. (A) dominant model (AA + AC vs. CC); (B) recessive model (AA vs. AC + CC); (C) homozygote model (AA vs. CC); and (D) additive model (A vs. C). For each genetic model, the analysis was performed in Asian and American subgroups.
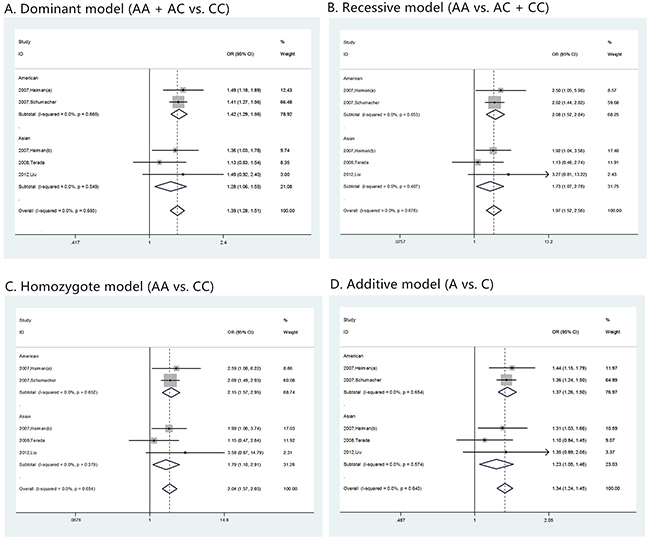
Figure 4: The forest plots of prostate cancer that has Gleason score > 7 in different genetic models. (A) dominant model (AA + AC vs. CC); (B) recessive model (AA vs. AC + CC); (C) homozygote model (AA vs. CC); and (D) additive model (A vs. C). For each genetic model, the analysis was performed in Asian and American subgroups.

Figure 5: Risk evaluation of prostate cancer in different tumor stages. (A) tumor stage 1-2, (B) tumor stage 3-4. The Begg’s funnel plot with pseudo 95% confidence limits of prostate cancer Gleason score. (C) tumor stage 1-2; (D) tumor stage 3-4.
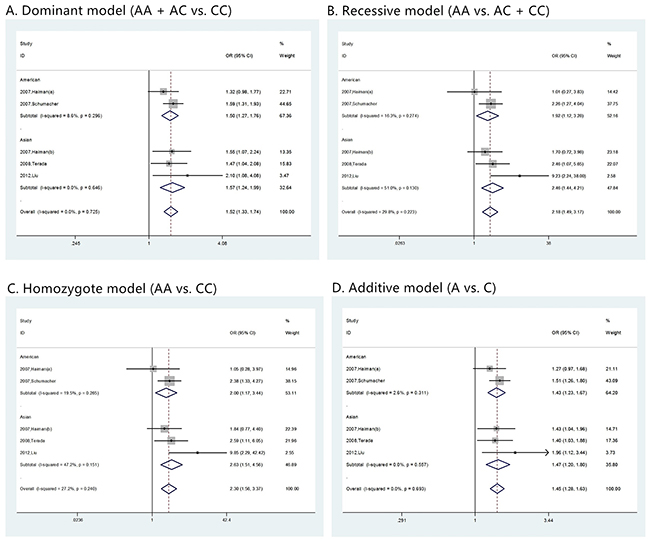
Figure 6: Risk evaluation of prostate cancer with different PSA levels. (A) PSA level ≤ 10 ng/mL; (B). PSA level > 10 ng/mL. The Begg’s funnel plot with pseudo 95% confidence limits of prostate cancer Gleason score. (C) PSA level ≤ 10 ng/mL, (D) PSA level > 10 ng/mL.
Publication bias
Funnel plots were inspected to evaluate the possibility of reporting a publication bias for skewness. For the most part these did not suggest the presence of significant reporting bias (Figure 7). To test the publication bias of the literature, both Begg’s test and Egger’s test were performed. Results of publication bias were shown in Table 2. No publication bias was observed under any model (all p values of Egger’s test and Begg’s test were over 0.01).
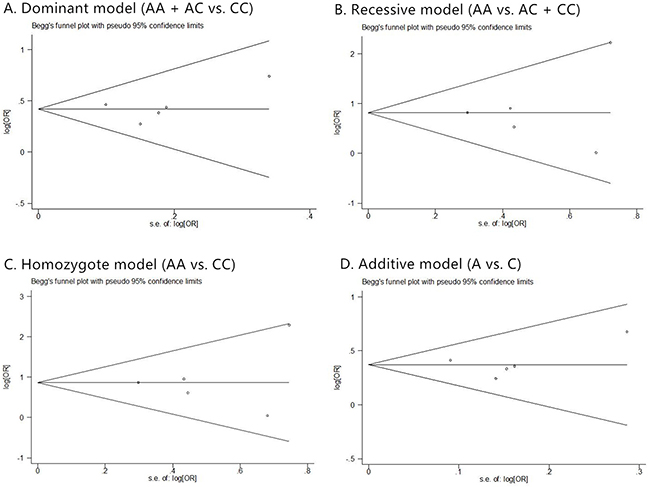
Figure 7: The Begg’s funnel plot of prostate cancer in different genetic models. (A) dominant model (AA + AC vs. CC); (B) recessive model (AA vs. AC + CC); (C) homozygote model (AA vs. CC); and (D) additive model (A vs. C).
Similar evaluation was also conducted in analysis of clinical characteristics, and no publication bias was observed too. Corresponding funnel plots were shown as Figure 8, 9, 5(C, D), and 6(C, D).
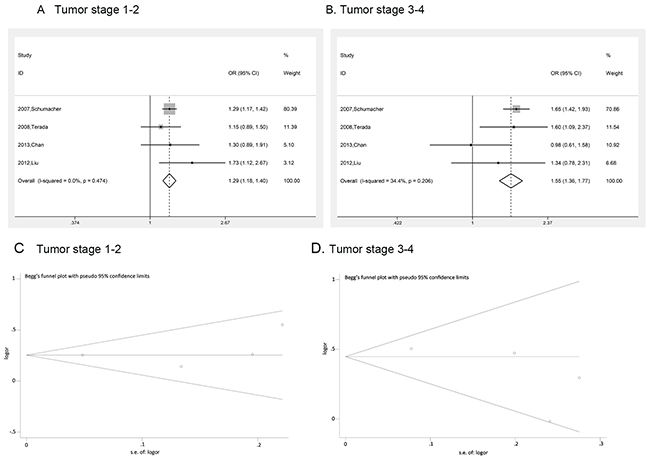
Figure 8: The Begg’s funnel plot of prostate cancer that has Gleason score <= 7 in different genetic models. (A) dominant model (AA + AC vs. CC); (B) recessive model (AA vs. AC + CC); (C) homozygote model (AA vs. CC); and (D) additive model (A vs. C).
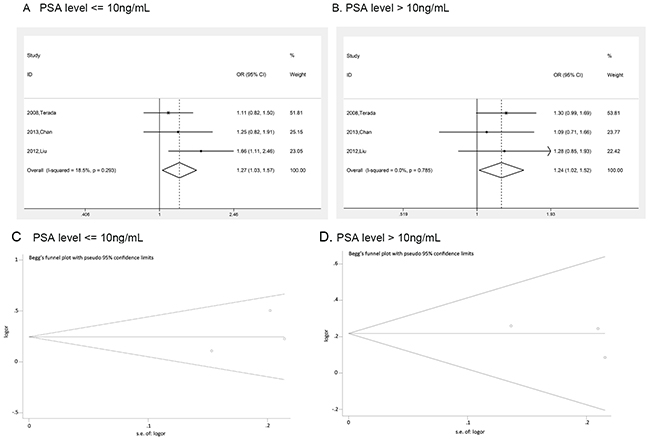
Figure 9: The Begg’s funnel plot of prostate cancer that has Gleason score > 7 in different genetic models. (A) dominant model (AA + AC vs. CC); (B) recessive model (AA vs. AC + CC); (C) homozygote model (AA vs. CC); and (D) additive model (A vs. C).
DISCUSSION
Even though there had been meta-analysis related to association between rs1447295 and prostate cancer before, we performed a more detailed analysis. We removed replicated cohort data in previous study and enlarged the data pool with the mostly recent research (2006 to 2016) in our analysis which made the conclusion more scientific and reliable. Most importantly, we found significant association between rs1447295 polymorphism and the risk of prostate cancer in total groups and also in both European descent and Asian descent. Meanwhile, our results also showed that rs1447295 polymorphism was associated with different prostate cancer clinical characteristics, providing an important evidence to use rs1447295 polymorphism as a useful marker for prostate cancer diagnosis even in the early stage.
The most recent meta-analysis for rs1447295 and PCa risk was done in 2012 [17], our analysis updated the data collected from 2006 to 2016 and focus on European descent, American descent and Asian descent. Compared with the previous meta-analysis [17], we incorporated three new articles in our analysis of Asian group. Distinct from previous analysis which only included the case and control number as the dataset but did not analyze the correlation according to rs1447295 genotypes, our study analyzed the correlation of PCa risk with rs1447295 in four different genotypes. In the four different gene models of rs1447295, the frequency of PCa significantly increased in European descent, American descent and Asian descent.
Analysis of the association between risk allele at rs1447295 and PCa clinical features showed rs1447295 polymorphism tends to correlate with advanced prostate cancer risk. For example, rs1447295 polymorphism may be associated with greater tumor aggressiveness in African Americans [9] and American Whites [10], advanced stage diseases in Eastern Whites [11] and African American [9, 12]. The rs1447295 risk allele tended to be more strongly associated with Gleason score 7–10 tumors than with Gleason score 2–6 tumors in African Americans and American Whites [7]. However, this trend was not observed in Eastern White populations [7, 13]. In addition, the correlation between rs1447295 polymorphism and PCa risk did not appear to be affected by PSA level in Eastern Whites [11, 14]. Zheng et al. [11] showed that this allele was associated with a younger age at onset in Eastern Whites, but Schumacher et al. [15] and Zheng et al. [16] didn’t show such evidence. It looks like that the risk allele is only associated with a younger age at onset in African Americans populations. To clear up the confusion, we evaluated the association between rs1447295 and PCa risk for cases with different clinical characteristics including Gleason score, tumor stage and PSA (prostate specific antigen) level. Our result turned out that rs1447295 polymorphism was associated with different prostate cancer clinical characteristics in American, descent, European descent and Asian descent. The interesting results suggested that risk allele at rs1447295 might be a sensitive marker for prostate cancer diagnosis. However, a more detailed study with larger sample size and more diverse population is needed to further confirm this observation in the future.
MATERIALS AND METHODS
Literature search and data extraction
We searched related articles through six databases, including “PubMed”, “Science Direct”, “Karger”, “Web of Science”, “Wiley Online Library” and “Springer”. To avoid omitting related literatures, “8q24” or “rs1447295” and “prostate cancer” were set as key words. The search coverage was those published in English before November, 2016. We exclude the books and other literatures that were not related with case-control study or not aimed at prostate cancer research. Then full texts of the left articles were carefully checked and we removed articles which didn’t contain the exact quantity information about the genotypes of rs1447295. Finally, we noticed there’re some studies with overlapping samples so that we picked out adequate ones, and here we restricted our study subjects as American descents, Asian descents and European descents.
All data were extracted independently by two reviewers. Preliminary evaluation was conducted based on the titles and abstracts, and then full texts of potentially relevant with our studies were obtained and re-evaluated for the inclusion. The following characteristics were collected from each study: year of publication and first author, race or ethnicity of samples, exact quantity of each genotype for cases and controls, HWE (Hardy-Weinberg equilibrium) p value and genotyping method. In addition, clinical characteristic of cases such as Gleason score, tumor stage and PSA (prostate specific antigen) level were also collected, especially those with detailed genotype.
Statistical methods
The statistical analysis was conducted with STATA 12 (Stata Corp LP, College Station, Texas, United States). In the whole process, p value less than 0.05 was considered to be statistically significant. Hardy-Weinberg equilibrium in cases or controls was evaluated by the Chi-Square test, and p value over 0.05 was considered as significant equilibrium. HWE was also taken as a data-extraction factor and those studies with HWE p value over 0.05 were chosen for further analysis.
To get a more reasonable result, four genetic models of inheritance were adopted in our analysis: dominant model (AA + AC vs. CC; A was considered as risk allele), recessive model (AA vs. AC + CC), homozygote model (AA vs. CC) and additive model (A vs. C). In dominant model, we investigated the distribution of genotype AA and AC comparing to genotype CC; as for recessive model, the distribution of genotype AA comparing to genotype AC and CC was analyzed; in homozygote model we used CC as reference genotype and investigated the distribution of AA; as for additive model the distribution of allele A comparing to C was analyzed.
For each study, the quantities of four genotypes in cases and control groups were used as pooled data. As for pooling analysis, Mantel-Haenszel (M-H) fixed-effect model was applied to analyze datasets with insignificant heterogeneity, and DerSimonian and Laird (D-L) random-effect model was suitable for datasets with obvious heterogeneity. In our analysis, the heterogeneity among studies was evaluated using I2 index. The higher I2 was, the more significant the heterogeneity was. To be specific, when I2 was less than 50%, we could believe there was no significant heterogeneity among pooled data, and then M-H model is applied; for I2 more than 75%, an obvious heterogeneity existed and D-L model should be adopted; otherwise both models could be applied. For each analysis, M-H model was used firstly to test the heterogeneity, and then an adequate model was chosen based on the test result of I2 value. Pooled odds ratio (OR) and 95% confidence interval were calculated with correspondent model, and corresponding forest plot was generated to summarize the result.
As for the elaborated evaluation, factors, like Gleason score, tumor stage and PSA level, were chosen and corresponding genotypes were collected, and risk allelic OR of comparing cases with controls was calculated to see whether there were differences between cases with distinct clinical characteristics.
To evaluate publication bias, Begg’s funnel plot was generated based on the analysis result and database size. The more asymmetry the funnel plot looked, the more publication bias was introduced. Meanwhile, Egger’s test was also performed for further investigation. For the Egger’s test, the significance level was set as p value <0.01.
Author contributions
These authors have contributed equally to this work.
ACKNOWLEDGMENTS
All contributors have been listed in the study.
CONFLICTS OF INTEREST
All authors have approved the submission of the manuscript, and no conflicts of interest is declared.
REFERENCES
1. Boyle P, Gandini S, Baglietto L, Severi G, Robertson C. Epidemiology of prostate cancer. Eur Urol. 2001; 39:2-3.
2. Siegel R, Ma J, Zou Z, Jemal A. Cancer statistics, 2014. CA Cancer J Clin. 2014; 64:9-29.
3. Shao N, Wang Y, Lu K, Jiang WY, Li Q, Wang N, Feng NH, Hua LX. Role of the functional MKK4 promoter variant (-1304T>G) in a decreased risk of prostate cancer: case-control study and meta-analysis. J Cancer Res Clin Oncol. 2012; 138:1531-1539.
4. Wang B, Wang D, Zhang D, Li A, Liu D, Liu H, Jin H. Pro variant of TP53 Arg72Pro contributes to esophageal squamous cell carcinoma risk: evidence from a meta-analysis. Eur J Cancer Prev. 2010; 19:299.
5. Cheng I, Plummer SJ, Jorgenson E, Liu X, Rybicki BA, Casey G, Witte JS. 8q24 and prostate cancer: association with advanced disease and meta-analysis. Eur J Hum Genet. 2008; 16:496.
6. Haiman CA, Patterson N, Freedman ML, Myers SR, Pike MC, Waliszewska A, Neubauer J, Tandon A, Schirmer C, Mcdonald GJ, Greenway SC, Stram DO, Le Marchand L, et al. Multiple regions within 8q24 independently affect risk for prostate cancer. Nat Genet. 2007; 39:638.
7. Amundadottir LT, Sulem P, Gudmundsson J, Helgason A, Baker A, Agnarsson BA, Sigurdsson A, Benediktsdottir KR, Cazier JB, Sainz J, Jakobsdottir M, Kostic J, Magnusdottir DN, et al. A common variant associated with prostate cancer in European and African populations. Nat Genet. 2006; 38:652-658.
8. Kibel AS. Genome-wide association study of prostate cancer identifies a second risk locus at 8q24. Urol Oncol. 2007; 25:447-448.
9. Terada N, Tsuchiya N, Ma Z, Shimizu Y, Kobayashi T, Nakamura E, Kamoto T, Habuchi T, Ogawa O. Association of genetic polymorphisms at 8q24 with the risk of prostate cancer in a Japanese population. Prostate. 2008; 8:1689-1695.
10. Wang L, Mcdonnell SK, Slusser JP, Hebbring SJ, Cunningham JM, Jacobsen SJ, Cerhan JR, Blute ML, Schaid DJ, Thibodeau SN. Two common chromosome 8q24 variants are associated with increased risk for prostate cancer. Cancer Res. 2007; 67:2944-2950.
11. Zheng SL, Sun J, Cheng Y, Li G, Hsu FC, Zhu Y, Chang BL, Liu W, Kim JW, Turner AR, Gielzak M, Yan G, Isaacs SD, et al. Association between two unlinked loci at 8q24 and prostate cancer risk among European Americans. J Natl Cancer Inst. 2007; 99:1525.
12. Bao BY, Pao JB, Lin VC, Huang CN, Chang TY, Lan YH, Lu TL, Lee HZ, Chen LM, Ting WC. Individual and cumulative association of prostate cancer susceptibility variants with clinicopathologic characteristics of the disease. Clin Chim Acta. 2010; 411:1232-1237.
13. Wokołorczyk D, Gliniewicz B, Stojewski M, Sikorski A, Złowocka E, Debniak T, Jakubowska A, Górski B, Van dWT, Narod SA, Lubiński J, Cybulski C. The rs1447295 and DG8S737 markers on chromosome 8q24 and cancer risk in the Polish population. Eur J Cancer Prev. 2010; 19:167-171.
14. Wiklund F, Zheng SL, Sun JL, Adami HO, Lilja H, Hsu FC, Stattin P, Adolfsson J, Cramer SD, Duggan D, Carpten JD, Chang BL, Isaacs WB. Association of reported prostate cancer risk alleles with PSA levels among men without a diagnosis of prostate cancer. Prostate. 2009; 69:419-427.
15. Schumacher FR, Feigelson HS, Cox DG, Haiman CA, Albanes D, Buring J, Calle EE, Chanock SJ, Colditz GA and Diver WR, Dunning AM, Freedman ML, Gaziano JM. A Common 8q24 Variant in Prostate and Breast Cancer from a Large Nested Case-Control Study. Cancer Res. 2007; 67:2951-2956.
16. Zheng SL1, Sun J, Wiklund F, Smith S, Stattin P, Li G, Adami HO, Hsu FC, Zhu Y, Bälter K, Kader AK, Turner AR, Liu W, et al. Cumulative association of five genetic variants with prostate cancer. N Engl J Med. 2008; 358:910-919.
17. Troutman SM, Sissung TM, Cropp CD, Venzon DJ, Spencer SD, Adesunloye BA, Huang X, Karzai FH, Price DK, Figg WD. Racial disparities in the association between variants on 8q24 and prostate cancer: a systematic review and meta-analysis. Oncologist. 2012; 17:312-320.