
INTRODUCTION
Non-small cell lung cancer (NSCLC) accounts for more than 85% of total lung cancer cases [1], and 5-year patient survival remains low at only 15.9% [1]. The most common NSCLC histological phenotypes are lung adenocarcinoma (LADC, ~50% of patients) and lung squamous cell carcinoma (LSCC, ~40% of patients) [1]. LADC cells commonly exhibit abnormal gene expression patterns and large numbers of gene mutations [2], and are characterized by specific biomarkers[3–7] and prognostic factors [8–10] that can be used to guide clinical diagnosis and treatment. LSCC cells also exhibit complex genomic alterations, including numerous gene mutations and copy number alterations [11], and are associated with particular biomarkers [12–14] and prognostic factors [15–17].
Accurate diagnosis of the LADC and LSCC cancer types has important significance for lung patient clinical treatment. While biomarkers that differentiate LADC from LSCC have been reported previously [18–21], additional markers would help enhance diagnostic accuracy for these intractable malignant cancers. The present study identified differentially expressed genes (DEGs) between LADC and LSCC samples using comprehensive bioinformatics analyses. We identified eight potential biomarkers for discriminating LADC and LSCC, and assessed their prognostic values.
RESULTS
Study design
We imported four Gene Expression Omnibus (GEO) datasets (GSE28571, GSE37745, GSE43580, and GSE50081) into the Gene-Cloud of Biotechnology Information (GCBI) bioinformatics analysis platform (Figure 1). We extracted LADC and LSCC gene expression information from these datasets and identified DEGs between the two cancer types. From the top 10 down- or upregulated DEGs, we identified eight as potential biomarkers for discriminating LADC and LSCC. We assessed the prognostic values of these potential biomarkers using the survival analysis tools, PrognoScan and Kaplan-Meier Plotter.
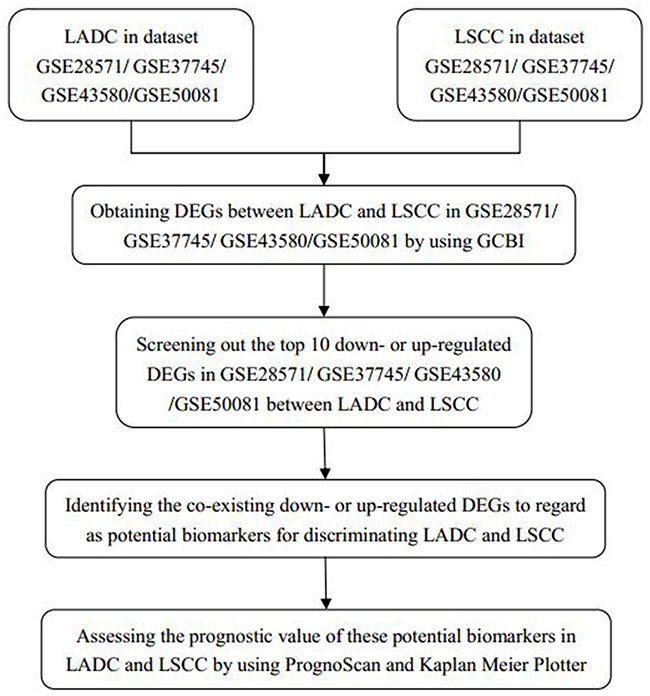
Figure 1: Study design diagram. LADC: lung adenocarcinoma; LSCC: squamous cell carcinoma; DEGs: differentially expressed genes; GCBI: Gene-Cloud of Biotechnology Information.
DEGs in LADC and LSCC
Using GCBI, we identified 243, 210, 118, and 101 potential DEGs from GSE28571, GSE37745, GSE43580, and GSE50081, respectively (Figure 2, Supplementary Table 1–4). Removal of duplicate genes and expression values lacking specific gene symbols left 176 DEGs from GSE28571 (Supplementary Table 5), 153 from GSE37745 (Supplementary Table 6), 81 from GSE43580 (Supplementary Table 7) and 71 from GSE50081 (Supplementary Table 8).
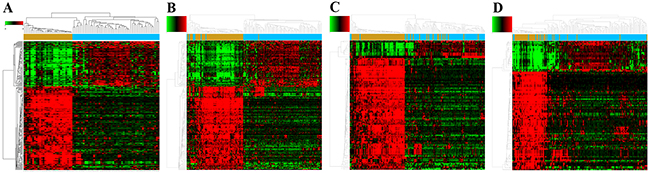
Figure 2: Potential DEGs between LADC and LSCC. Heat maps for potential DEGs in GSE28571 (total n=243; LADC n=50; LSCC n=28) (A), GSE37745 (total n=210; LADC n=106; LSCC n=66) (B), GSE43580 (total n=118; LADC n=77; LSCC n=73) (C), and GSE50081 (total n=101; LADC n=128; LSCC n=43) (D).
Potential biomarkers for distinguishing between LADC and LSCC
Based on expression fold changes between LADC and LSCC, we selected the top 10 downregulated and upregulated DEGs from GSE28571 (Table 1), GSE37745 (Table 2), GSE43580 (Table 3), and GSE50081 (Table 4). We identified four downregulated DEGs (desmoglein 3, DSG3; keratin 5, KRT5; keratin 6A, KRT6A; keratin 6B, KRT6B) (Figure 3) and four upregulated DEGs (NK2 homeobox 1, NKX2-1; surfactant associated 2, SFTA2; surfactant associated 3, SFTA3; transmembrane channel-like 5, TMC5) (Figure 4) that were present in all four datasets. We achieved similar results via an integrated analysis based on all four datasets together (Supplementary Table 9–10). We assessed these eight genes as potential biomarkers for discriminating LADC and LSCC.
Table 1: Top 10 down- or upregulated DEGs between LADC and LSCC in lung cancer dataset, GSE28571
Probe set ID |
Gene symbol |
Gene description |
Gene feature |
Fold change |
|---|---|---|---|---|
209125_at |
KRT6A |
keratin 6A |
downregulation |
-176.148978 |
206165_s_at |
CLCA2 |
chloride channel accessory 2 |
downregulation |
-90.443266 |
235075_at |
DSG3 |
desmoglein 3 |
downregulation |
-88.129812 |
201820_at |
KRT5 |
keratin 5 |
downregulation |
-82.362516 |
217272_s_at |
SERPINB13 |
serpin peptidase inhibitor, clade B (ovalbumin), member 13 |
downregulation |
-64.457025 |
213680_at |
KRT6B |
keratin 6B |
downregulation |
-52.540652 |
204455_at |
DST |
dystonin |
downregulation |
-46.258579 |
209863_s_at |
TP63 |
tumor protein p63 |
downregulation |
-45.820729 |
206032_at |
DSC3 |
desmocollin 3 |
downregulation |
-43.549951 |
204855_at |
SERPINB5 |
serpin peptidase inhibitor, clade B (ovalbumin), member 5 |
downregulation |
-39.535047 |
244056_at |
SFTA2 |
surfactant associated 2 |
upregulation |
31.032507 |
228979_at |
SFTA3 |
surfactant associated 3 |
upregulation |
27.153369 |
211024_s_at |
NKX2-1 |
NK2 homeobox 1 |
upregulation |
15.422392 |
219580_s_at |
TMC5 |
transmembrane channel-like 5 |
upregulation |
11.725501 |
229105_at |
GPR39 |
G protein-coupled receptor 39 |
upregulation |
6.443132 |
214033_at |
ABCC6 |
ATP-binding cassette, sub-family C (CFTR/MRP), member 6 |
upregulation |
6.288185 |
212328_at |
LIMCH1 |
LIM and calponin homology domains 1 |
upregulation |
6.28786 |
225822_at |
TMEM125 |
transmembrane protein 125 |
upregulation |
5.919894 |
230875_s_at |
ATP11A |
ATPase, class VI, type 11A |
upregulation |
5.787312 |
228806_at |
RORC |
RAR-related orphan receptor C |
upregulation |
5.335111 |
Table 2: Top 10 down- or upregulated DEGS between LADC and LSCC in lung cancer dataset, GSE37745
Probe set ID |
Gene symbol |
Gene description |
Gene feature |
Fold change |
|---|---|---|---|---|
209125_at |
KRT6A |
keratin 6A |
downregulation |
-140.927 |
235075_at |
DSG3 |
desmoglein 3 |
downregulation |
-86.646 |
206165_s_at |
CLCA2 |
chloride channel accessory 2 |
downregulation |
-84.9649 |
201820_at |
KRT5 |
keratin 5 |
downregulation |
-62.2157 |
213680_at |
KRT6B |
keratin 6B |
downregulation |
-53.2072 |
206032_at |
DSC3 |
desmocollin 3 |
downregulation |
-47.29 |
209863_s_at |
TP63 |
tumor protein p63 |
downregulation |
-44.3825 |
204455_at |
DST |
dystonin |
downregulation |
-38.1615 |
213796_at |
SPRR1A |
small proline-rich protein 1A |
downregulation |
-36.8294 |
217272_s_at |
SERPINB13 |
serpin peptidase inhibitor, clade B (ovalbumin), member 13 |
downregulation |
-36.3898 |
228979_at |
SFTA3 |
surfactant associated 3 |
upregulation |
33.59706 |
244056_at |
SFTA2 |
surfactant associated 2 |
upregulation |
27.97213 |
216623_x_at |
TOX3 |
TOX high mobility group box family member 3 |
upregulation |
21.41014 |
206239_s_at |
SPINK1 |
serine peptidase inhibitor, Kazal type 1 |
upregulation |
17.47105 |
211024_s_at |
NKX2-1 |
NK2 homeobox 1 |
upregulation |
16.6846 |
223806_s_at |
NAPSA |
napsin A aspartic peptidase |
upregulation |
14.23227 |
37004_at |
SFTPB |
surfactant protein B |
upregulation |
12.19793 |
240304_s_at |
TMC5 |
transmembrane channel-like 5 |
upregulation |
11.27782 |
204424_s_at |
LMO3 |
LIM domain only 3 (rhombotin-like 2) |
upregulation |
10.23422 |
219612_s_at |
FGG |
fibrinogen gamma chain |
upregulation |
9.826917 |
Table 3: Top 10 down- or upregulated DEGs between LADC and LSCC in lung cancer dataset, GSE43580
Probe set ID |
Gene symbol |
Gene description |
Gene feature |
Fold change |
|---|---|---|---|---|
209125_at |
KRT6A |
keratin 6A |
downregulation |
-53.2466 |
235075_at |
DSG3 |
desmoglein 3 |
downregulation |
-45.44 |
206165_s_at |
CLCA2 |
chloride channel accessory 2 |
downregulation |
-38.0985 |
209863_s_at |
TP63 |
tumor protein p63 |
downregulation |
-28.6096 |
213796_at |
SPRR1A |
small proline-rich protein 1A |
downregulation |
-27.828 |
201820_at |
KRT5 |
keratin 5 |
downregulation |
-26.5195 |
206032_at |
DSC3 |
desmocollin 3 |
downregulation |
-25.687 |
213680_at |
KRT6B |
keratin 6B |
downregulation |
-25.5837 |
217272_s_at |
SERPINB13 |
serpin peptidase inhibitor, clade B (ovalbumin), member 13 |
downregulation |
-22.7939 |
209351_at |
KRT14 |
keratin 14 |
downregulation |
-21.4751 |
216623_x_at |
TOX3 |
TOX high mobility group box family member 3 |
upregulation |
12.48837 |
228979_at |
SFTA3 |
surfactant associated 3 |
upregulation |
9.698342 |
244056_at |
SFTA2 |
surfactant associated 2 |
upregulation |
9.34222 |
220393_at |
LGSN |
lengsin, lens protein with glutamine synthetase domain |
upregulation |
7.272057 |
223806_s_at |
NAPSA |
napsin A aspartic peptidase |
upregulation |
6.387242 |
211024_s_at |
NKX2-1 |
NK2 homeobox 1 |
upregulation |
6.235382 |
240304_s_at |
TMC5 |
transmembrane channel-like 5 |
upregulation |
5.886752 |
229030_at |
CAPN8 |
calpain 8 |
upregulation |
5.558286 |
209016_s_at |
KRT7 |
keratin 7 |
upregulation |
5.197863 |
206239_s_at |
SPINK1 |
serine peptidase inhibitor, Kazal type 1 |
upregulation |
5.028636 |
Table 4: Top 10 down- or upregulated DEGs between LADC and LSCC in lung cancer dataset, GSE50081
Probe set ID |
Gene symbol |
Gene description |
Gene feature |
Fold change |
|---|---|---|---|---|
209125_at |
KRT6A |
keratin 6A |
downregulation |
-57.006103 |
213680_at |
KRT6B |
keratin 6B |
downregulation |
-39.001783 |
201820_at |
KRT5 |
keratin 5 |
downregulation |
-37.082683 |
207935_s_at |
KRT13 |
keratin 13 |
downregulation |
-23.955773 |
210020_x_at |
CALML3 |
calmodulin-like 3 |
downregulation |
-22.527441 |
235075_at |
DSG3 |
desmoglein 3 |
downregulation |
-21.167905 |
213796_at |
SPRR1A |
small proline-rich protein 1A |
downregulation |
-20.461997 |
221854_at |
PKP1 |
plakophilin 1 (ectodermal dysplasia/skin fragility syndrome) |
downregulation |
-18.214428 |
205157_s_at |
JUP |
junction plakoglobin |
downregulation |
-17.594235 |
209351_at |
KRT14 |
keratin 14 |
downregulation |
-16.96603 |
228979_at |
SFTA3 |
surfactant associated 3 |
upregulation |
13.36924 |
244056_at |
SFTA2 |
surfactant associated 2 |
upregulation |
13.198138 |
211024_s_at |
NKX2-1 |
NK2 homeobox 1 |
upregulation |
11.03073 |
240304_s_at |
TMC5 |
transmembrane channel-like 5 |
upregulation |
8.335526 |
206239_s_at |
SPINK1 |
serine peptidase inhibitor, Kazal type 1 |
upregulation |
7.171856 |
209016_s_at |
KRT7 |
keratin 7 |
upregulation |
6.780702 |
204124_at |
SLC34A2 |
solute carrier family 34 (sodium phosphate), member 2 |
upregulation |
6.362828 |
204437_s_at |
FOLR1 |
folate receptor 1 (adult) |
upregulation |
6.138674 |
229177_at |
C16orf89 |
chromosome 16 open reading frame 89 |
upregulation |
6.035951 |
204424_s_at |
LMO3 |
LIM domain only 3 (rhombotin-like 2) |
upregulation |
5.987309 |
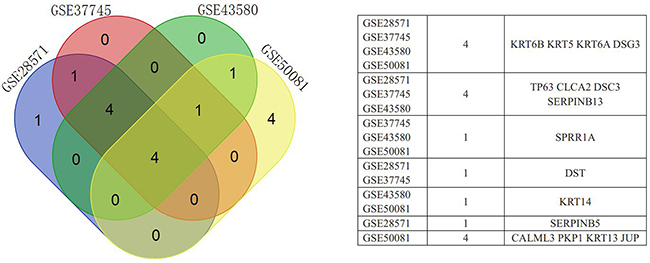
Figure 3: Venn diagram showing downregulated DEGs common to all four GEO datasets.
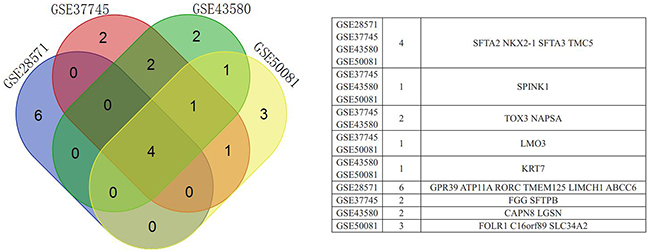
Figure 4: Venn diagram showing upregulated DEGs common to all four GEO datasets.
Receiver operating characteristic (ROC) curve analysis was used to evaluate the diagnostic values of DSG3, KRT5, KRT6A, KRT6B, NKX2-1, SFTA2, SFTA3, and TMC5. The four downregulated DEGs had similar areas under the curve (AUC): 0.9188 for DSG3, 0.9386 for KRT5, 0.9333 for KRT6A, and 0.9229 for KRT6B (Figure 5A). The four upregulated DEGs also had similar AUCs: 0.8723 for NKX2-1, 0.8559 for SFTA2, 0.8108 for SFTA3, and 0.8442 for TMC5 (Figure 5B). AUC results showed that KRT5 had the highest diagnostic value for discriminating LADC and LSCC.
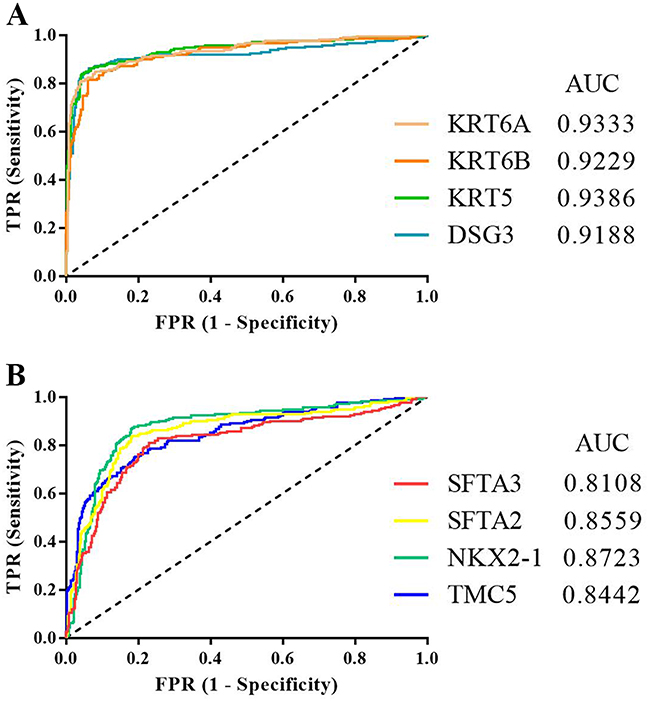
Figure 5: ROC curves for downregulated (A) and upregulated DEGs (B) in distinguishing between LADC and LSCC. TPR: true positive rate; FPR: false positive rate; AUC: area under the curve.
PrognoScan identified potential prognostic factors for LADC and LSCC patients
We assessed the prognostic values of the eight potential biomarkers using the bioinformatics analysis platform, PrognoScan. P<0.05 was considered significant in Cox regression analyses. We found that high DSG3, KRT6A, or KRT6B levels (Table 5), or low NKX2-1, SFTA3, or TMC5 levels (Table 6), were associated with unfavorable prognosis in LADC patients. However, only low NKX2-1 expression was associated with unfavorable prognosis in LSCC patients (Table 6). We speculated that DSG3, KRT6A, KRT6B, NKX2-1, SFTA3, and TMC5 might be LADC patient prognostic factors, and NKX2-1 might be an LSCC patient prognostic factor. Because each lung cancer microarray dataset in PrognoScan contained limited cases (Table 5–6), we verified these findings using Kaplan-Meier Plotter.
Table 5: DSG3, KRT5, KRT6A, and KRT6B prognostic values in LADC and LSCC as assessed by PrognoScan
Gene symbol |
LADC |
LSCC |
||||||
|---|---|---|---|---|---|---|---|---|
Dataset |
Case |
HR (95% CIs) |
P-value |
Dataset |
Case |
HR (95% CIs) |
P-value |
|
DSG3 |
MICHIGAN-LC |
86 |
2.54 (1.22–5.32) |
0.013244 |
- |
- |
- |
>0.05 |
KRT5 |
- |
- |
- |
>0.05 |
- |
- |
- |
>0.05 |
KRT6A |
jacob-00182-HLM |
79 |
1.24 (1.06–1.45) |
0.006974 |
- |
- |
- |
>0.05 |
jacob-00182-MSK |
104 |
1.28 (1.06–1.53) |
0.008562 |
|||||
GSE31210 |
204 |
1.39 (1.18–1.63) |
0.000083 |
|||||
KRT6B |
jacob-00182-MSK |
104 |
1.26 (1.07–1.47) |
0.005120 |
- |
- |
- |
>0.05 |
GSE31210 |
204 |
1.47 (1.23–1.75) |
0.000017 |
|||||
Table 6: NKX2-1, SFTA2, SFTA3, and TMC5 prognostic values in LADC and LSCC as assessed by PrognoScan
Gene symbol |
LADC |
LSCC |
||||||
|---|---|---|---|---|---|---|---|---|
Dataset |
Case |
HR (95% CIs) |
P-value |
Dataset |
Case |
HR (95% CIs) |
P-value |
|
NKX2-1 |
jacob-00182-CANDF |
82 |
0.78 (0.64–0.96) |
0.020132 |
GSE17710 |
56 |
0.71 (0.52–0.97) |
0.029764 |
jacob-00182-HLM |
79 |
0.78 (0.63–0.97) |
0.027745 |
|||||
MICHIGAN-LC |
86 |
0.56 (0.36–0.87) |
0.009902 |
|||||
GSE31210 |
204 |
0.62 (0.43–0.88) |
0.008218 |
|||||
jacob-00182-UM |
178 |
0.81 (0.68–0.97) |
0.021112 |
|||||
SFTA2 |
- |
- |
- |
>0.05 |
- |
- |
- |
- |
SFTA3 |
GSE13213 |
117 |
0.89 (0.79–1.00) |
0.048445 |
- |
- |
- |
- |
GSE31210 |
204 |
0.62 (0.46–0.85) |
0.003019 |
|||||
TMC5 |
jacob-00182-HLM |
79 |
0.45 (0.24–0.84) |
0.012012 |
- |
- |
- |
>0.05 |
GSE31210 |
204 |
0.30 (0.13–0.68) |
0.004014 |
|||||
Kaplan-meier plotter verified five LADC prognostic factors
Using Kaplan-Meier Plotter, we verified that high KRT6A (Hazard ratio, HR=1.66; 95% confidence intervals, 95% CIs: 1.31–2.11; P=1.90E-05) or KRT6B (HR=1.76; 95% CIs: 1.39–2.22; P=1.90E-06) (Figure 6, Table 7), or low NKX2-1 (HR=0.66; 95% CIs: 0.52–0.84; P=0.00051), SFTA3 (HR=0.55; 95% CIs: 0.43–0.70; P=1.20E-06), or TMC5 (HR=0.51; 95% CIs: 0.41–0.65; P=3.30E-08) (Figure 7, Table 7) levels correlated with unfavorable prognosis in LADC patients. However, no DEGs correlated with LSCC patient prognosis (Table 7). Unlike the scattered results obtained by PrognoScan, Kaplan-Meier Plotter gained the meta-analysis results and we therefore draw our conclusions based on the Kaplan-Meier Plotter findings.
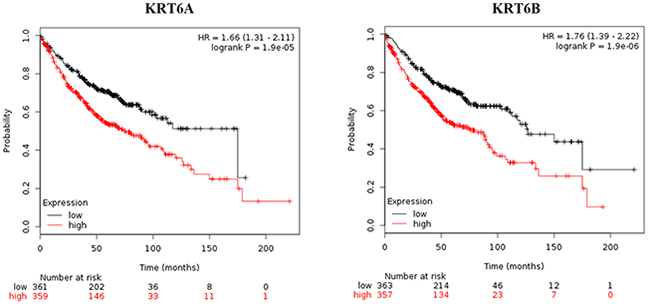
Figure 6: Kaplan-Meier survival curves for KRT6A and KRT6B expression in LADC patients.
Table 7: Verification of potential prognostic indicators via Kaplan-Meier Plotter
Gene symbol |
LADC |
LSCC |
||||
|---|---|---|---|---|---|---|
Case |
HR (95% CIs) |
P-value |
Case |
HR (95% CIs) |
P-value |
|
DSG3 |
673 |
1.09 (0.86–1.39) |
0.48 |
271 |
0.86 (0.63–1.18) |
0.35 |
KRT6A |
720 |
1.66 (1.31–2.11) |
1.90E-05 |
524 |
0.99 (0.78–1.25) |
0.92 |
KRT6B |
720 |
1.76 (1.39–2.22) |
1.90E-06 |
524 |
0.94 (0.75–1.20) |
0.63 |
NKX2-1 |
720 |
0.66 (0.52–0.84) |
0.00051 |
524 |
0.82 (0.65–1.04) |
0.11 |
SFTA3 |
673 |
0.55 (0.43–0.70) |
1.20E-06 |
271 |
0.82 (0.60–1.11) |
0.20 |
TMC5 |
720 |
0.51 (0.41–0.65) |
3.30E-08 |
524 |
1.02 (0.8–1.29) |
0.88 |
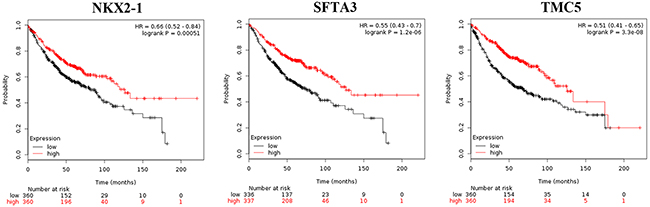
Figure 7: Kaplan-Meier survival curves for NKX2-1, SFTA3, and TMC5 expression in LADC patients.
DISCUSSION
In this study, we imported four GEO datasets into the GCBI comprehensive analysis platform to extract LADC and LSCC gene expression data. We identified DEGs between LADC and LSCC samples through differential expression analysis in GCBI, and found that DSG3, KRT5, KRT6A, KRT6B, NKX2-1, SFTA2, SFTA3, and TMC5 were potential biomarkers for distinguishing the two cancer types. According to ROC analyses, KRT5 had the highest diagnostic value for discriminating LADC and LSCC. Finally, using the survival analysis platforms, PrognoScan and Kaplan-Meier Plotter, we found that high KRT6A or KRT6B, or low NKX2-1, SFTA3, or TMC5 levels correlated with unfavorable prognoses in LADC patients.
Previous studies reported that DSG3 [18, 21, 22], KRT5 [23], KRT6A [24], and KRT6B [24] levels were higher in LSCC than in LADC, and that NKX2-1 [25–27], SFTA3 [21], and TMC5 [21] levels were higher in LADC than in LSCC, suggesting that these genes were biomarkers for differentiating between LSCC and LADC. In agreement with this, our results showed that DSG3, KRT5, KRT6A, and KRT6B were downregulated in LADC compared to LSCC, and that NKX2-1, SFTA3, and TMC5 were upregulated in LADC compared to LSCC. Our study also identified SFTA2 as a novel biomarker upregulated in LADC.
The potential biomarker, NKX2-1, binds DNA damage-binding protein 1 (DDB1) and degrades check-point kinase 1 (CHK1) to facilitate lung adenocarcinoma progression [28]. Through modulating IKKβ/NF-κB pathway activation, NKX2-1 also modulates lung adenocarcinoma by directly regulating p53 transcription [29]. However, the molecular mechanisms by which DSG3, KRT5, KRT6A, KRT6B, SFTA2, SFTA3, and TMC5 regulate NSCLC development remain unclear. DSG3 promotes epidermoid carcinoma progression by regulating activation of protein kinase C-dependent Ezrin and activator protein 1 [30]. KRT5 combines with transforming growth factor beta receptor 3 (TGFBR3) and transcription factor JunD to promote breast cancer cell growth [31]. KRT6B interacts with notch1 to promote renal carcinoma development [32]. Studies to elucidate the mechanisms of action of these biomarkers in NSCLC development and progression are warranted.
Lu C, et al. [33] and Tian [34] also extracted gene expression data from GEO profiles to identify DEGs between LADC and LSCC. Based on the GSE6044 and GSE50081 datasets, these groups identified 19 and 33 DEGs, respectively, that might discriminate between LADC and LSCC. However, these genes were not identified based on expression fold changes between LADC and LSCC. Fold change is important for detecting DEGs [35–37] and guiding further research [38, 39], and our eight potential biomarkers for differentiating between LADC and LSCC were identified based on this measurement type in the GSE28571, GSE37745, GSE43580, and GSE50081 datasets. Consequently, the biomarkers reported here differ from those identified in previous studies [33, 34]. This indicates that different gene expression dataset screening methods may produce different results and the differences of molecule expression between LADC and LSCC may be far more complicated than we thought.
Previous studies have identified prognostic biomarkers in patients with LADC [10, 40–44] or LSCC [45–49]. While we did not identify any LSCC prognostic indictors, we found that high KRT6A or KRT6B levels, or low NKX2-1, SFTA3, or TMC5 levels correlated with an unfavorable prognosis in LADC patients. Of these prognostic factors, only NKX2-1, thought to be a tumor suppressor [50], was previously associated with LADC prognosis [26, 51]. The prognostic values of KRT6A, KRT6B, SFTA3, and TMC5 in LADC are reported here for the first time. Both KRT6A and KRT6B are type II cytokeratins and keratin 6 isoforms [52, 53]. KRT6A and KRT6B are associated with pachyonychia congenita [54, 55], as well as renal carcinoma [32] and breast cancer [56] progression. SFTA3 is an immunoregulatory protein that protects lung tissue during inflammation and is likely a lung surfactant protein family member [57]. SFTA3 is also downregulated in anaplastic thyroid carcinoma compared with normal thyroid tissue [58]. TMC5 is a transmembrane protein with at least eight membrane-spanning domains that belongs to a novel group of transporters, ion channels, or modifiers of such [59]. TMC5 is upregulated in chromophobe renal cell carcinoma [60] and intrahepatic cholangiocarcinoma [61].
In conclusion, we identified DSG3, KRT5, KRT6A, KRT6B, NKX2-1, SFTA2, SFTA3, and TMC5 as potential biomarkers for distinguishing between LADC and LSCC. Additionally, high KRT6A or KRT6B levels, or low NKX2-1, SFTA3, or TMC5 levels correlated with unfavorable LDAC patient prognosis. Further studies are required to verify our findings in additional patient samples, and to elucidate the mechanisms of action of these potential biomarkers in NSCLC.
MATERIALS AND METHODS
Gene expression omnibus datasets
The Gene Expression Omnibus (GEO) (https://www.ncbi.nlm.nih.gov/gds) is a public repository at the National Center of Biotechnology Information for storing high throughput gene expression datasets. We screened potential GEO datasets according to the following inclusion criteria: 1) Homo sapiens NSCLC specimens classified as LADC or LSCC; 2) expression profiling by array; 3) performed on the GPL570 platform ([HG-U133_Plus_2] Affymetrix Human Genome U133 Plus 2.0 Array); and 4) ≥100 samples. Datasets with specimens from other organisms, expression profiling by RT-PCR (or genome variation profiling by SNP array/SNP genotyping by SNP array), analyses on platforms other than GPL570, or sample size <100 were excluded.
We used the search terms, “((lung cancer [Title]) AND GPL570 [Related Series]) AND Homo sapiens [Organism] AND (squamous cell carcinoma [Description] OR adenocarcinoma [Description]),” to identify potential datasets within GEO. Screening using the aforementioned inclusion criteria identified four datasets (GSE28571, GSE37745, GSE43580, and GSE50081) for use in analyses of DEGs between LADC and LSCC. These datasets contained 361 LADC (50 in GSE28571, 106 in GSE37745, 77 in GSE43580, and 128 in GS50081) and 210 LSCC (28 in GSE28571, 66 in GSE37745, 73 in GSE43580, and 43 in GSE50081) fresh-frozen specimens (Tables S11–S14).
Gene-cloud of biotechnology information
Gene-Cloud of Biotechnology Information (GCBI; https://www.gcbi.com.cn/gclib/html/index), is an online comprehensive bioinformatics analysis platform that can systematically analyze GEO dataset-derived gene expression information [62]. After flagged data normalization, filtering, and quality control, we identified genes differentially expressed by >5 fold between LADC and LSCC, with the cutoff values P<0.05 and Q<0.05 using GCBI.
Prognoscan
The PrognoScan (http://www.prognoscan.org/) online database provides a powerful platform for exploring therapeutic targets, tumor markers, and prognostic factors in cancer patients [63], and contains cancer microarray datasets with corresponding clinical data. PrognoScan automatically calculates HRs, 95% CIs, and Cox P-values according to a given gene’s mRNA level (high or low).
Kaplan-meier plotter
Kaplan-Meier Plotter (http://kmplot.com/analysis/) is an online database of published microarray datasets for four cancer types (breast, ovarian, lung, and gastric cancer), and includes clinical data and gene expression information for 2,437 lung cancer patients [64]. Kaplan-Meier Plotter is useful for assessing new biomarkers related to lung cancer patient survival.
Receiver operating characteristic curve analyses
Receiver operating characteristic (ROC) curves were constructed to compare biomarker diagnostic values. Curves are created by plotting true positive rates (TPR, sensitivity) against false positive rates (FPR, 1-specificity). The area under the curve (AUC) is used to determine diagnostic accuracy. An AUC value close to 1.0 indicates high accuracy [65].
ACKNOWLEDGMENTS
We thank Qingqing LYU, Lang Ma, and Donglin Cheng from the GCBI Center for providing assistance with statistical analysis methods.
CONFLICTS OF INTEREST
The authors declare no conflicts of interest.
GRANT SUPPORT
This work was supported by the National Natural Science Foundation of China (Grant No. 81572284) and the Important Research and Development Plan of Hunan Provincial Science and Technology Department (Grant No. 2015SK20662).
REFERENCES
1. Chen Z, Fillmore CM, Hammerman PS, Kim CF, Wong KK. Non-small-cell lung cancers: a heterogeneous set of diseases. Nat Rev Cancer. 2014; 14:535-546.
2. Comprehensive molecular profiling of lung adenocarcinoma. Nature. 2014; 511:543-550.
3. Leduc N, Ahomadegbe C, Agossou M, Aline-Fardin A, Mahjoubi L, Dufrenot-Petitjean Roget L, Grossat N, Vinh-Hung V, Lamy A, Sabourin JC, Molinie V. Incidence of Lung Adenocarcinoma Biomarker in a Caribbean and African Caribbean Population. J Thorac Oncol. 2016; 11:769-773.
4. Sugano M, Nagasaka T, Sasaki E, Murakami Y, Hosoda W, Hida T, Mitsudomi T, Yatabe Y. HNF4alpha as a marker for invasive mucinous adenocarcinoma of the lung. Am J Surg Pathol. 2013; 37:211-218.
5. Turner BM, Cagle PT, Sainz IM, Fukuoka J, Shen SS, Jagirdar J. Napsin A, a new marker for lung adenocarcinoma, is complementary and more sensitive and specific than thyroid transcription factor 1 in the differential diagnosis of primary pulmonary carcinoma: evaluation of 1674 cases by tissue microarray. Arch Pathol Lab Med. 2012; 136:163-171.
6. Wang P, Lu S, Mao H, Bai Y, Ma T, Cheng Z, Zhang H, Jin Q, Zhao J, Mao H. Identification of biomarkers for the detection of early stage lung adenocarcinoma by microarray profiling of long noncoding RNAs. Lung Cancer. 2015; 88:147-153.
7. Zhou X, Wen W, Shan X, Zhu W, Xu J, Guo R, Cheng W, Wang F, Qi LW, Chen Y, Huang Z, Wang T, Zhu D, et al. A six-microRNA panel in plasma was identified as a potential biomarker for lung adenocarcinoma diagnosis. Oncotarget. 2017;8:6513-6525. doi: 10.18632/oncotarget.14311.
8. Chen L, Kurtyka CA, Welsh EA, Rivera JI, Engel BE, Munoz-Antonia T, Yoder SJ, Eschrich SA, Creelan BC, Chiappori AA, Gray JE, Ramirez JL, Rosell R, et al. Early2 factor (E2F) deregulation is a prognostic and predictive biomarker in lung adenocarcinoma. Oncotarget. 2016;7:82254-82265. doi: 10.18632/oncotarget.12672.
9. Stewart PA, Parapatics K, Welsh EA, Muller AC, Cao H, Fang B, Koomen JM, Eschrich SA, Bennett KL, Haura EB. A Pilot Proteogenomic Study with Data Integration Identifies MCT1 and GLUT1 as Prognostic Markers in Lung Adenocarcinoma. PLoS One. 2015; 10:e0142162.
10. Zheng YZ, Ma R, Zhou JK, Guo CL, Wang YS, Li ZG, Liu LX, Peng Y. ROR1 is a novel prognostic biomarker in patients with lung adenocarcinoma. Sci Rep. 2016; 6:36447.
11. Comprehensive genomic characterization of squamous cell lung cancers. Nature. 2012; 489:519-525.
12. Okano T, Seike M, Kuribayashi H, Soeno C, Ishii T, Kida K, Gemma A. Identification of haptoglobin peptide as a novel serum biomarker for lung squamous cell carcinoma by serum proteome and peptidome profiling. Int J Oncol. 2016; 48:945-952.
13. Song R, Liu Q, Hutvagner G, Nguyen H, Ramamohanarao K, Wong L, Li J. Rule discovery and distance separation to detect reliable miRNA biomarkers for the diagnosis of lung squamous cell carcinoma. BMC Genomics. 2014; 15:S16.
14. Zhang XZ, Xiao ZF, Li C, Xiao ZQ, Yang F, Li DJ, Li MY, Li F, Chen ZC. Triosephosphate isomerase and peroxiredoxin 6, two novel serum markers for human lung squamous cell carcinoma. Cancer Sci. 2009; 100:2396-2401.
15. Gao X, Wang Y, Zhao H, Wei F, Zhang X, Su Y, Wang C, Li H, Ren X. Plasma miR-324-3p and miR-1285 as diagnostic and prognostic biomarkers for early stage lung squamous cell carcinoma. Oncotarget. 2016;7:82254-82265. doi: 10.18632/oncotarget.11198.
16. Hwang JA, Song JS, Yu DY, Kim HR, Park HJ, Park YS, Kim WS, Choi CM. Peroxiredoxin 4 as an independent prognostic marker for survival in patients with early-stage lung squamous cell carcinoma. Int J Clin Exp Pathol. 2015; 8:6627-6635.
17. Yue D, Li H, Che J, Zhang Y, Tolani B, Mo M, Zhang H, Zheng Q, Yang Y, Cheng R, Jin JQ, Luh TW, Yang C, et al. EMX2 Is a Predictive Marker for Adjuvant Chemotherapy in Lung Squamous Cell Carcinomas. PLoS One. 2015; 10:e0132134.
18. Agackiran Y, Ozcan A, Akyurek N, Memis L, Findik G, Kaya S. Desmoglein-3 and Napsin A double stain, a useful immunohistochemical marker for differentiation of lung squamous cell carcinoma and adenocarcinoma from other subtypes. Appl Immunohistochem Mol Morphol. 2012; 20:350-355.
19. Li L, Li X, Yin J, Song X, Chen X, Feng J, Gao H, Liu L, Wei S. The high diagnostic accuracy of combined test of thyroid transcription factor 1 and Napsin A to distinguish between lung adenocarcinoma and squamous cell carcinoma: a meta-analysis. PLoS One. 2014; 9:e100837.
20. Patnaik S, Mallick R, Kannisto E, Sharma R, Bshara W, Yendamuri S, Dhillon SS. MiR-205 and MiR-375 microRNA assays to distinguish squamous cell carcinoma from adenocarcinoma in lung cancer biopsies. J Thorac Oncol. 2015; 10:446-453.
21. Zhan C, Yan L, Wang L, Sun Y, Wang X, Lin Z, Zhang Y, Shi Y, Jiang W, Wang Q. Identification of immunohistochemical markers for distinguishing lung adenocarcinoma from squamous cell carcinoma. J Thorac Dis. 2015; 7:1398-1405.
22. Savci-Heijink CD, Kosari F, Aubry MC, Caron BL, Sun Z, Yang P, Vasmatzis G. The role of desmoglein-3 in the diagnosis of squamous cell carcinoma of the lung. Am J Pathol. 2009; 174:1629-1637.
23. Miettinen M, Sarlomo-Rikala M. Expression of calretinin, thrombomodulin, keratin 5, and mesothelin in lung carcinomas of different types: an immunohistochemical analysis of 596 tumors in comparison with epithelioid mesotheliomas of the pleura. Am J Surg Pathol. 2003; 27:150-158.
24. Chang HH, Dreyfuss JM, Ramoni MF. A transcriptional network signature characterizes lung cancer subtypes. Cancer. 2011; 117:353-360.
25. Deutsch L, Wrage M, Koops S, Glatzel M, Uzunoglu FG, Kutup A, Hinsch A, Sauter G, Izbicki JR, Pantel K, Wikman H. Opposite roles of FOXA1 and NKX2-1 in lung cancer progression. Genes Chromosomes Cancer. 2012; 51:618-629.
26. Inoue Y, Matsuura S, Kurabe N, Kahyo T, Mori H, Kawase A, Karayama M, Inui N, Funai K, Shinmura K, Suda T, Sugimura H. Clinicopathological and Survival Analysis of Japanese Patients with Resected Non-Small-Cell Lung Cancer Harboring NKX2-1, SETDB1, MET, HER2, SOX2, FGFR1, or PIK3CA Gene Amplification. J Thorac Oncol. 2015; 10:1590-1600.
27. Su Y, Pan L. Identification of logic relationships between genes and subtypes of non-small cell lung cancer. PLoS One. 2014; 9:e94644.
28. Liu Z, Yanagisawa K, Griesing S, Iwai M, Kano K, Hotta N, Kajino T, Suzuki M, Takahashi T. TTF-1/NKX2-1 binds to DDB1 and confers replication stress resistance to lung adenocarcinomas. Oncogene. 2017.
29. Chen PM, Wu TC, Cheng YW, Chen CY, Lee H. NKX2-1-mediated p53 expression modulates lung adenocarcinoma progression via modulating IKKbeta/NF-kappaB activation. Oncotarget. 2015; 6:14274-14289. doi: 10.18632/oncotarget.3695.
30. Brown L, Waseem A, Cruz IN, Szary J, Gunic E, Mannan T, Unadkat M, Yang M, Valderrama F, O’Toole EA, Wan H. Desmoglein 3 promotes cancer cell migration and invasion by regulating activator protein 1 and protein kinase C-dependent-Ezrin activation. Oncogene. 2014; 33:2363-2374.
31. Wang CC, Bajikar SS, Jamal L, Atkins KA, Janes KA. A time- and matrix-dependent TGFBR3-JUND-KRT5 regulatory circuit in single breast epithelial cells and basal-like premalignancies. Nat Cell Biol. 2014; 16:345-356.
32. Hu J, Zhang LC, Song X, Lu JR, Jin Z. KRT6 interacting with notch1 contributes to progression of renal cell carcinoma, and aliskiren inhibits renal carcinoma cell lines proliferation in vitro. Int J Clin Exp Pathol. 2015; 8:9182-9188.
33. Lu C, Chen H, Shan Z, Yang L. Identification of differentially expressed genes between lung adenocarcinoma and lung squamous cell carcinoma by gene expression profiling. Mol Med Rep. 2016; 14:1483-1490.
34. Tian S. Identification of Subtype-Specific Prognostic Genes for Early-Stage Lung Adenocarcinoma and Squamous Cell Carcinoma Patients Using an Embedded Feature Selection Algorithm. PLoS One. 2015; 10:e0134630.
35. Dembele D, Kastner P. Fold change rank ordering statistics: a new method for detecting differentially expressed genes. BMC Bioinformatics. 2014; 15:14.
36. Deng X, Xu J, Hui J, Wang C. Probability fold change: a robust computational approach for identifying differentially expressed gene lists. Comput Methods Programs Biomed. 2009; 93:124-139.
37. Farztdinov V, McDyer F. Distributional fold change test - a statistical approach for detecting differential expression in microarray experiments. Algorithms Mol Biol. 2012; 7:29.
38. Burger JA, Quiroga MP, Hartmann E, Burkle A, Wierda WG, Keating MJ, Rosenwald A. High-level expression of the T-cell chemokines CCL3 and CCL4 by chronic lymphocytic leukemia B cells in nurselike cell cocultures and after BCR stimulation. Blood. 2009; 113:3050-3058.
39. Casey ME, Meade KG, Nalpas NC, Taraktsoglou M, Browne JA, Killick KE, Park SD, Gormley E, Hokamp K, Magee DA, MacHugh DE. Analysis of the Bovine Monocyte-Derived Macrophage Response to Mycobacterium avium Subspecies Paratuberculosis Infection Using RNA-seq. Front Immunol. 2015; 6:23.
40. Han F, Liu W, Xiao H, Dong Y, Sun L, Mao C, Yin L, Jiang X, Ao L, Cui Z, Cao J, Liu J. High expression of SOX30 is associated with favorable survival in human lung adenocarcinoma. Sci Rep. 2015; 5:13630.
41. Hwang JC, Sung WW, Tu HP, Hsieh KC, Yeh CM, Chen CJ, Tai HC, Hsu CT, Shieh GS, Chang JG, Yeh KT, Liu TC. The Overexpression of FEN1 and RAD54B May Act as Independent Prognostic Factors of Lung Adenocarcinoma. PLoS One. 2015; 10:e0139435.
42. Zhai X, Xu L, Zhang S, Zhu H, Mao G, Huang J. High expression levels of MAGE-A9 are correlated with unfavorable survival in lung adenocarcinoma. Oncotarget. 2016; 7:4871-4881. doi: 10.18632/oncotarget.6741.
43. Koren A, Sodja E, Rijavec M, Jez M, Kovac V, Korosec P, Cufer T. Prognostic value of cytokeratin-7 mRNA expression in peripheral whole blood of advanced lung adenocarcinoma patients. Cell Oncol (Dordr). 2015; 38:387-395.
44. Masroor M, Jamsheed J, Mir R, Prasant Y, Imtiyaz A, Mariyam Z, Mohan A, Ray PC, Saxena A. Prognostic significance of serum ERBB3 and ERBB4 mRNA in lung adenocarcinoma patients. Tumour Biol. 2016; 37:857-863.
45. Hu XG, Chen L, Wang QL, Zhao XL, Tan J, Cui YH, Liu XD, Zhang X, Bian XW. Elevated expression of ASCL2 is an independent prognostic indicator in lung squamous cell carcinoma. J Clin Pathol. 2016; 69:313-318.
46. Tan X, Liao L, Wan YP, Li MX, Chen SH, Mo WJ, Zhao QL, Huang LF, Zeng GQ. Downregulation of selenium-binding protein 1 is associated with poor prognosis in lung squamous cell carcinoma. World J Surg Oncol. 2016; 14:70.
47. Wang D, Pan Y, Hao T, Chen Y, Qiu S, Chen L, Zhao J. Clinical and Prognostic Significance of ANCCA in Squamous Cell Lung Carcinoma Patients. Arch Med Res. 2016; 47:89-95.
48. Zheng S, Pan Y, Wang R, Li Y, Cheng C, Shen X, Li B, Zheng D, Sun Y, Chen H. SOX2 expression is associated with FGFR fusion genes and predicts favorable outcome in lung squamous cell carcinomas. Onco Targets Ther. 2015; 8:3009-3016.
49. Wilkerson MD, Yin X, Hoadley KA, Liu Y, Hayward MC, Cabanski CR, Muldrew K, Miller CR, Randell SH, Socinski MA, Parsons AM, Funkhouser WK, Lee CB, et al. Lung squamous cell carcinoma mRNA expression subtypes are reproducible, clinically important, and correspond to normal cell types. Clin Cancer Res. 2010; 16:4864-4875.
50. Winslow MM, Dayton TL, Verhaak RG, Kim-Kiselak C, Snyder EL, Feldser DM, Hubbard DD, DuPage MJ, Whittaker CA, Hoersch S, Yoon S, Crowley D, Bronson RT, et al. Suppression of lung adenocarcinoma progression by Nkx2-1. Nature. 2011; 473:101-104.
51. Lindskog C, Fagerberg L, Hallstrom B, Edlund K, Hellwig B, Rahnenfuhrer J, Kampf C, Uhlen M, Ponten F, Micke P. The lung-specific proteome defined by integration of transcriptomics and antibody-based profiling. FASEB J. 2014; 28:5184-5196.
52. Hanukoglu I, Fuchs E. The cDNA sequence of a Type II cytoskeletal keratin reveals constant and variable structural domains among keratins. Cell. 1983; 33:915-924.
53. Schweizer J, Bowden PE, Coulombe PA, Langbein L, Lane EB, Magin TM, Maltais L, Omary MB, Parry DA, Rogers MA, Wright MW. New consensus nomenclature for mammalian keratins. J Cell Biol. 2006; 174:169-174.
54. Guo K, Xiao S, Geng S, Feng Y, Zhang D, Zhou P, Zhang Y. Delayed-onset pachyonychia congenita caused by a novel mutation in the V2 domain of keratin 6b. J Dermatol. 2014; 41:108-109.
55. Lv YM, Yang S, Zhang Z, Cui Y, Quan C, Zhou FS, Fang QY, Du WH, Zhang FR, Chang JM, Tao XP, Zhang AL, Kang RH, et al. Novel and recurrent keratin 6A (KRT6A) mutations in Chinese patients with pachyonychia congenita type 1. Br J Dermatol. 2009; 160:1327-1329.
56. Bu W, Chen J, Morrison GD, Huang S, Creighton CJ, Huang J, Chamness GC, Hilsenbeck SG, Roop DR, Leavitt AD, Li Y. Keratin 6a marks mammary bipotential progenitor cells that can give rise to a unique tumor model resembling human normal-like breast cancer. Oncogene. 2011; 30:4399-4409.
57. Schicht M, Rausch F, Finotto S, Mathews M, Mattil A, Schubert M, Koch B, Traxdorf M, Bohr C, Worlitzsch D, Brandt W, Garreis F, Sel S, et al. SFTA3, a novel protein of the lung: three-dimensional structure, characterisation and immune activation. Eur Respir J. 2014; 44:447-456.
58. Weinberger P, Ponny SR, Xu H, Bai S, Smallridge R, Copland J, Sharma A. Cell Cycle M-Phase Genes Are Highly Upregulated in Anaplastic Thyroid Carcinoma. Thyroid. 2017; 27:236-252.
59. Keresztes G, Mutai H, Heller S. TMC and EVER genes belong to a larger novel family, the TMC gene family encoding transmembrane proteins. BMC Genomics. 2003; 4:24.
60. Yusenko MV, Kovacs G. Identifying CD82 (KAI1) as a marker for human chromophobe renal cell carcinoma. Histopathology. 2009; 55:687-695.
61. Subrungruanga I, Thawornkunob C, Chawalitchewinkoon-Petmitrc P, Pairojkul C, Wongkham S, Petmitrb S. Gene expression profiling of intrahepatic cholangiocarcinoma. Asian Pac J Cancer Prev. 2013; 14:557-563.
62. Feng A, Tu Z, Yin B. The effect of HMGB1 on the clinicopathological and prognostic features of non-small cell lung cancer. Oncotarget. 2016; 7:20507-20519. doi: 10.18632/oncotarget.7050.
63. Mizuno H, Kitada K, Nakai K, Sarai A. PrognoScan: a new database for meta-analysis of the prognostic value of genes. BMC Med Genomics. 2009; 2:18.
64. Gyorffy B, Surowiak P, Budczies J, Lanczky A. Online survival analysis software to assess the prognostic value of biomarkers using transcriptomic data in non-small-cell lung cancer. PLoS One. 2013; 8:e82241.
65. Hajian-Tilaki K. Receiver Operating Characteristic (ROC) Curve Analysis for Medical Diagnostic Test Evaluation. Caspian J Intern Med. 2013; 4:627-635.