
INTRODUCTION
Gastric cancer (GC) is one of the most common malignancies. Its incidence and mortality rates ranked fifth and second in 2013, respectively, placing a heavy burden on the public health system worldwide, especially in East Asian countries [1, 2]. Diagnosis and treatment strategies are based on the TNM staging system, which has been revised and perfected over the past 80 years. However, the prognosis of GC can be affected by several factors, such as tumor volume, patient age, and nutrition status. Thus, GC patients with the same TNM stage can have different clinical outcomes, causing unreliability in the TNM staging system for prognosis assessments. A new method to improve the accuracy of the TNM staging system is urgently needed.
Immune cells are a major component of the tumor microenvironment and come in multiple types with different functions. CD3 is a marker of T lymphocytes, including CD4+ T helper lymphocytes, CD8+ cytotoxic T lymphocytes, and FoxP3+ regulatory cells (Tregs). CD8+ T cells are cytotoxic and kill target tumor cells or promote tumor destruction via secretion of effector cytokines such as interferon-c or tumor necrosis factor [3, 4]. CD4+ helper T lymphocytes are required for the induction and maintenance of CD8+ T cells [5]. FoxP3+ Tregs suppress antitumor responses and maintain immunological tolerance to host tissues [6]. Similarly, tumor-associated macrophages (TAMs) can be divided into M1 (classically activated) and M2 (alternatively activated) cells. M2 cells promote tumor growth and progression and help subvert adaptive immunity [7]. However, recent reports have indicated that the presence of CD4+ helper T lymphocytes, FoxP3+ Tregs and M2 cells can lead to favorable outcomes in certain tumor patients [8-11]. Therefore, it is necessary to summarize the current progress regarding what is known of the relationship between tumor-infiltrating immune cells and the prognosis of cancer patients.
To date, the densities and locations of tumor-infiltrating immune cells have proven to be associated with clinical outcomes in lung cancer [12], colorectal cancer [13], breast cancer [14] and ovarian cancer [15], among others. Moreover, Galon et al [16] proposed that the type, density, and location of immune cells in colorectal cancer have prognostic values that are superior to and independent of those of the TNM classification. Nevertheless, the predictive role of tumor-infiltrating immune cells in patients with GC cancer remains controversial. Therefore, we performed a systematic review and meta-analysis to investigate the correlation between tumor-infiltrating immune cells and GC survival stratified according to immune cell subset and infiltration location (tumor nest, tumor stroma or tumor invasive margin).
RESULTS
Eligible studies
After screening, 35 articles were included in the meta-analysis (Figure 1). The basic characteristics of each study are presented in Table 1 and Supplementary Table 1 [9, 10, 17-49]. Among the 35 articles, 28 articles reported tumor-infiltrating lymphocytes, including CD3+ T cells (n=8), CD4+ helper T cells (n=6), CD8+ cytotoxic T cells (n=12), CD20+ B cells (n=2), CD45RO+ memory cells (n=2), FoxP3+ regulatory T cells (n=16), t-bet+ cells (n=2), dendritic cells (n=3), granzyme B cells (n=2), and natural killer cells (n=2). Twelve studies contained macrophages, which have two polarizations, M1 (n=2) and M2 (n=6). And CD11c/iNoS were identified as the marker of M1 and CD163/CD206 were identified as the marker of M2. The cell counting locations can mainly be divided into three categories: the tumor nest (TN), the tumor stroma (TS) and the tumor invasive margin (TM). In addition, in certain included articles, immune cells were counted without distinguishing among cell counting locations (such immune cell counts were incorporated into the data for all the location (AG)).
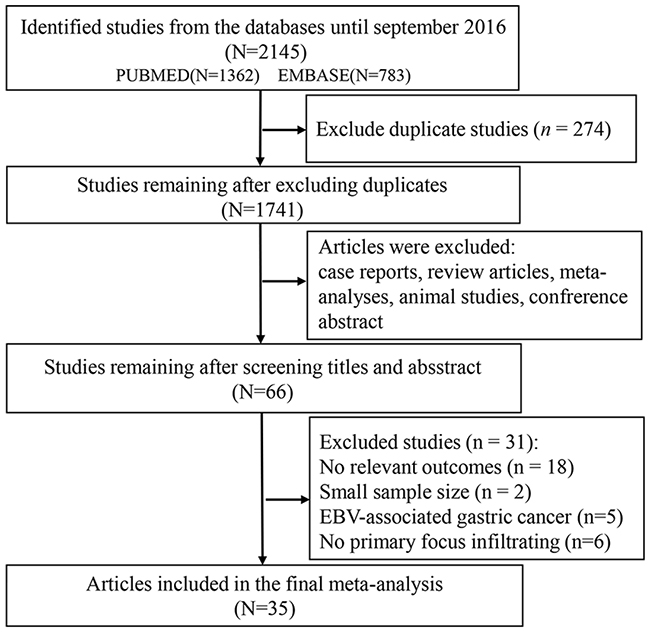
Figure 1: Flow chart for screening eligible publications.
Table 1: Basic characteristics of eligible studies.
Author, Year |
Region |
Assay |
Study design |
N (male/female) |
Cutoff point |
Subsets |
Location |
Outcomes |
Score |
|---|---|---|---|---|---|---|---|---|---|
Zhang, 2016 |
China |
IHC |
Cohort |
178(125/53) |
Mean |
M |
AG |
OS |
6 |
Yan, 2016 |
China |
IHC |
Cohort |
178(125/53) |
Mean |
M2 |
AG |
OS |
6 |
Park, 2016 |
Korea |
IHC |
Cohort |
113(87/36) |
Mean |
M2 |
TN/TS/TM |
OS/DFS |
5 |
Li, 2016 |
China |
IHC |
Cohort |
212(148/64) |
Median |
CD57 |
TN |
DFS/OS |
6 |
Kim, 2016 |
Korea |
TMA |
Cohort |
243(152/91) |
Median |
CD3/CD4/CD8 |
AG |
DFS |
5 |
Kawazoe, 2016 |
Japan |
IHC |
Cohort |
383 |
Median |
CD3/CD4/CD8/Foxp3 |
AG |
OS |
6 |
Hennequin, 2016 |
France |
IHC |
Cohort |
82(57/25) |
Median |
CD8/CD20/Foxp3/Tbet |
TN/TS/TM |
RFS |
5 |
Giampieri, 2016 |
Italy |
IHC |
Cohort |
73 |
50–60 % |
CD3 |
TS |
OS |
4 |
Zhang, 2015 |
China |
IHC |
Cohort |
180(56/124) |
Median |
M/M1/M2 |
TN |
OS |
6 |
Suh, 2015 |
Korea |
IHC |
Cohort |
117 |
15/HPF |
Foxp3 |
AG |
DFS/OS |
6 |
Liu, 2015 |
China |
IHC |
Cohort |
166(125/41) |
median |
CD3/CD4/CD8/ |
TN/TS/TM |
OS |
7 |
Lin, 2015 |
China |
IHC |
Cohort |
170(97/73) |
Grade C |
M2 |
AG |
OS |
3 |
Li, 2015 |
China |
IHC |
Cohort |
192(138/54) |
5% staining |
CD4/CD8 |
AG |
OS |
5 |
Kim, 2015 |
Korea |
IHC |
Cohort |
143 |
CD8/Foxps3 median |
CD8/Foxp3/M/M2 |
TN/TS/ |
DFS/PFS |
6 |
Geng, 2015 |
China |
IHC |
Cohort |
100(61/39) |
25% stainiing |
Foxp3 |
AG |
OS |
6 |
Okita, 2014 |
Japan |
IHC |
Cohort |
214(157/57) |
Median |
DC |
AG |
OS |
4 |
Ma, 2014 |
China |
IHC |
Cohort |
135(90/45) |
>25/HPF high <5/HPF low. |
Foxp3 |
IN |
OS |
5 |
Kim,2014 |
Korea |
IHC |
Cohort |
99(55/44) |
CD8/60th percentile |
CD8/Foxp3 |
TN |
OS |
6 |
Arigami, 2014 |
Japan |
IHC |
Cohort |
120(74/46) |
Median |
CD3 |
AG |
OS |
6 |
Zhou, 2013 |
China |
IHC |
Cohort |
133(89/44) |
Mean |
Foxp3 |
AG |
OS |
6 |
Wakatsuki, 2013 |
Japan |
IHC |
Cohort |
74(54/20) |
Mean |
CD45RO |
AG |
OS |
4 |
Pantano, 2013 |
Italy |
IF |
Cohort |
52(23/29) |
Median |
M1/M2 |
AG |
OS |
6 |
Chen, 2013 |
China |
IHC |
Cohort |
152(117/35) |
19.05/HPF |
Tbet |
AG |
DFS/OS |
5 |
Kashimura,2012 |
Japan |
IHC |
Cohort |
123(89/34) |
Mean |
Foxp3/DC |
AG |
DFS/OS |
5 |
Ishigami,2012 |
Japan |
IHC |
Cohort |
141(92/36) |
10/HPF |
Foxp3 |
TS |
OS |
3 |
Wang, 2011 |
China |
IHC |
Cohort |
107(69/38) |
Median |
Foxp3/M |
TN/TM |
OS |
7 |
Kim,2011 |
Korea |
IHC |
Cohort |
180(126/54) |
Median |
CD3/CD4/CD8/Foxp3/ |
TN |
OS/RFS |
6 |
Shen, 2010 |
China |
IHC |
Cohort |
133(89/44) |
Median |
CD4/CD8 |
TN/TM |
OS |
6 |
Haas,2009 |
Germany |
IHC |
Cohort |
52(40/12) |
Median |
CD3/CD8/CD20/Foxp3/ |
TN/TS |
OS |
6 |
Perrone,2008 |
Italy |
IHC |
Cohort |
110(53/57) |
Median |
Foxp3 |
TN |
OS/RFS |
4 |
Mizukami, 2008 |
Japan |
IHC |
Cohort |
80(56/24) |
Median |
Foxp3 |
AG |
OS |
5 |
Lee, 2008 |
Korea |
IHC |
Cohort |
220(156/64) |
Mean |
CD3/CD8/ |
AG |
OS |
6 |
Ohno,2005 |
Japan |
IHC |
Cohort |
84(57/27) |
median |
CD8/M |
TN/TM |
DFS |
6 |
Ohno,2003 |
Japan |
IHC |
Cohort |
84(57/27) |
median |
M |
TN |
DFS |
6 |
Takahashi,2002 |
Japan |
IHC |
Cohort |
65(44/21) |
20 positive cells |
DC |
AG |
OS |
3 |
Abbreviations: AG=all the location, TN=tumor nest, TS=tumor stroma, TM=tumor invasive margin, OS=overall survival, DFS=disease-free survival, RFS=relapse-free survival, IHC=immunohistochemistry, TMA=tissue microarrays, IF=immunofluorescence.
This meta-analysis included studies involving a total of 4888 patients from six countries, including China (n=13), France (n=1), Germany (n=1), Italy (n=3), Japan (n=10), and Korea (n=7). Nine studies included less than 100 patients, five articles contained more than 200 patients, and the remaining publications enrolled between 100 and 200 patients. The score of eligible articles ranged from 3 to 7, with 28 articles ≥5 and 7 articles <5. Hazard ratios (HRs) for overall survival (OS) and DFS/RFS (disease-free survival/relapse-free survival) of 5 articles were estimated through survival curves. The main methods for detecting specific tumor-infiltrating immune cells included immunohistochemistry (IHC), tissue microarray (TMA) and immunofluorescence (IF). The most frequently used cut-off values to distinguish positive and negative (high and low) tumor infiltration was the median level, mean level or a certain specific value determined by counting under the microscope.
Tumor-infiltrating lymphocytes
Subset of CD3+ T lymphocytes
Eight articles that focused on the correlation between the infiltration of CD3+ T lymphocytes and the overall survival of GC patients were divided into eleven studies according to the location of tumor infiltration. Among these eleven studies, three, three, one, and four studies reported the infiltration of CD3+ T lymphocytes into the TN, the TS, the TM and AG, respectively. The estimated pooled HRs of OS for AG, TN, TS, and TM were 0.71 (95% confidence interval (CI)=0.57-0.90; I2=27.9%, P=0.244), 0.58 (95% CI=0.42-0.80; I2=0.0%, P=0.605), 0.50 (95% CI=0.37-0.68; I2=38.4%, P=0.197), and 1.04 (95% CI=0.67-1.61), respectively (Figure 2A). The above results indicate that better OS was associated with CD3+ T lymphocyte infiltration in AG, TN, and TS. Only two articles provided the relationship between the DFS/RFS and CD3+ T lymphocytes. DFS/RFS HRs of the two studies were as follows: AG: HR=0.62, 95% CI=0.40-0.98 and TN: HR=0.70, 95% CI=0.43-1.15 (data not shown).
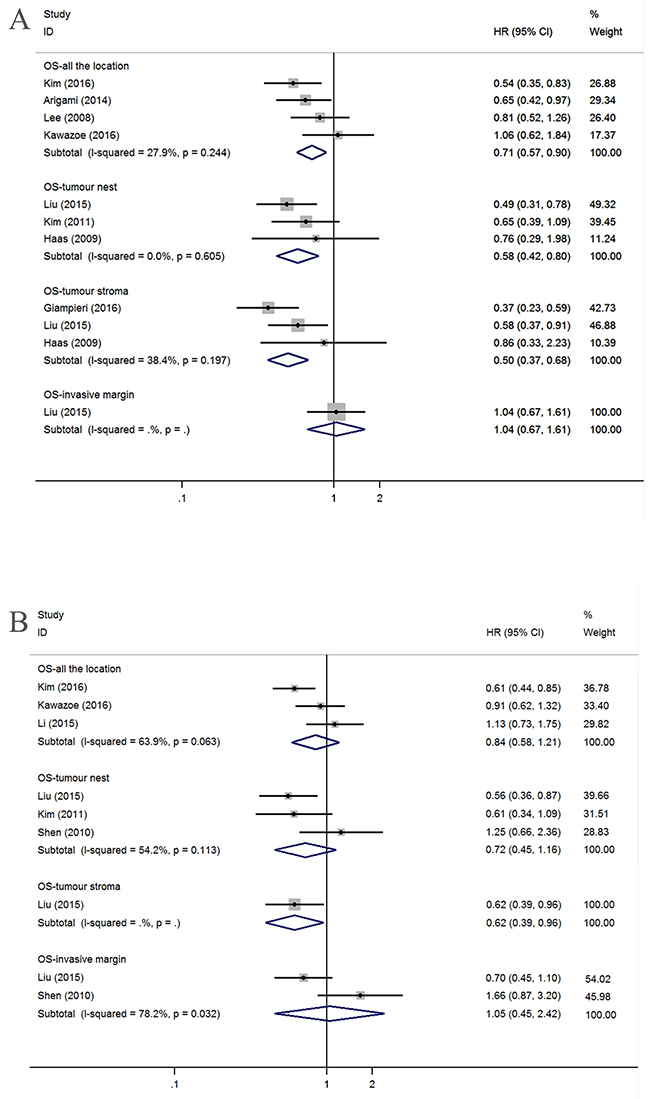
Figure 2: Forest plots of HRs to assess the correlation between prognosis and tumor-infiltrating immune cells. (A) OS and CD3+, (B) OS and CD4+.
Subset of CD4+ T lymphocytes
Six articles detected CD4+ T lymphocytes and investigated their relationship with prognostic value. Similarly, we grouped the six articles into nine studies involving OS and two studies involving DFS/RFS according to the location of infiltration. Because the heterogeneity was obvious, we used the random-effects model to estimate the HRs. OS was not associated with infiltration into a particular location, such as AG (n=3; HR=0.84, 95% CI=0.58-1.21; I2=63.9%, P=0.063), the TN (n=3; HR=0.72, 95% CI=0.45-1.16; I2=54.2%, P=0.113) or the TM (n=2; HR=1.05, 95% CI=0.45-2.42; I2=78.2%, P=0.032) (Figure 2B). Among the remaining three studies, one study assessed the relationship between OS and CD4+ T lymphocyte infiltration in TS (HR=0.62, 95% CI=0.39-0.96), and two studies involving DFS/RFS investigated the AG (HR=0.58, 95% CI=0.40-0.84) and TN (HR=0.71, 95% CI=0.41-1.24) (data not shown).
Subset of CD8+ T lymphocytes
By applying the aforementioned methods, we obtained 13 studies that investigated OS; after dividing these studies according to location, there were four, five, two, and two studies that addressed AG, the TN, the TS and the TM, respectively. We found that a high density of tumor-infiltrating CD8+ lymphocytes counted in AG was associated with good OS (HR=0.90, 95% CI=0.83-0.97, I2=49.6%, P=0.114) but that OS was not correlated with specific infiltration locations, such as the TN (HR=0.79, 95% CI=0.60-1.04; I2=28.1%,P=0.235), the TS (HR=1.39, 95% CI=0.92-2.08; I2=20.0%, P=0.264) or the TM (HR=0.75, 95% CI=0.52-1.09; I2=15.7%, P=0.276) (Figure 3A).
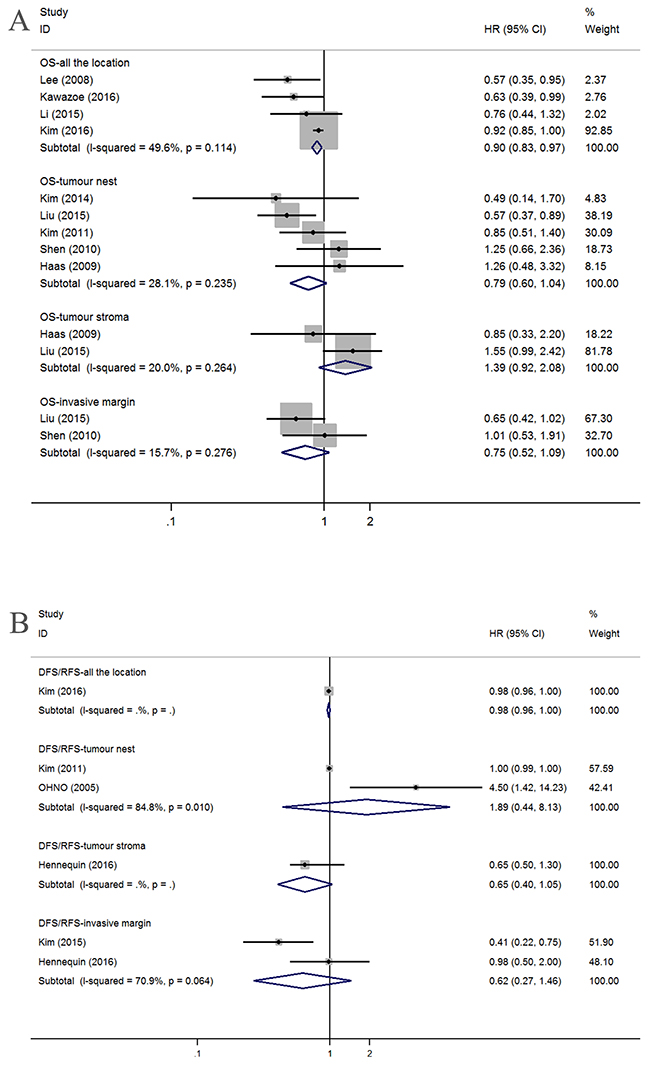
Figure 3: Forest plots of HRs to assess the correlation between prognosis and tumor-infiltrating immune cells. (A) OS and CD8+, (B) DFS/RFS and CD8+.
Six studies provided HRs and 95% CIs for the correlation between CD8+ T lymphocytes and DFS/RFS, with one study considering the AG (HR=0.98, 95% CI=0.96-1.00), two considering the TN (HR=1.89, 95% CI=0.44-8.13; I2=84.8%, P=0.010), one considering the TS (HR=0.65, 95% CI=0.40-1.05) and two considering the TM (HR=0.62, 95% CI=0.27-1.46; I2=70.9%, P=0.064) (Figure 3B).
Subset of Foxp3+ Treg lymphocytes
Twenty studies concerning OS were obtained by splitting sixteen articles with regard to Foxp3+ Treg lymphocytes. No relationships were found between OS and AG (n=6; HR=1.05, 95% CI=0.65-1.71), TN (n=8; HR=1.06, 95% CI=0.62-1.80), or TS (n=3; HR=0.92, 95% CI=0.31-2.68). Significant heterogeneity was observed for AG (I2=72.1%, P=0.003), TN (I2=76.7%, P<0.001), and TS (I2=83.4%, P=0.002). However, GC patients with high tumor margin infiltration have better OS (n=3; HR=0.65, 95% CI=0.48-0.87) and no heterogeneity (I2=0.0%, P=0.698) (Figure 4A).
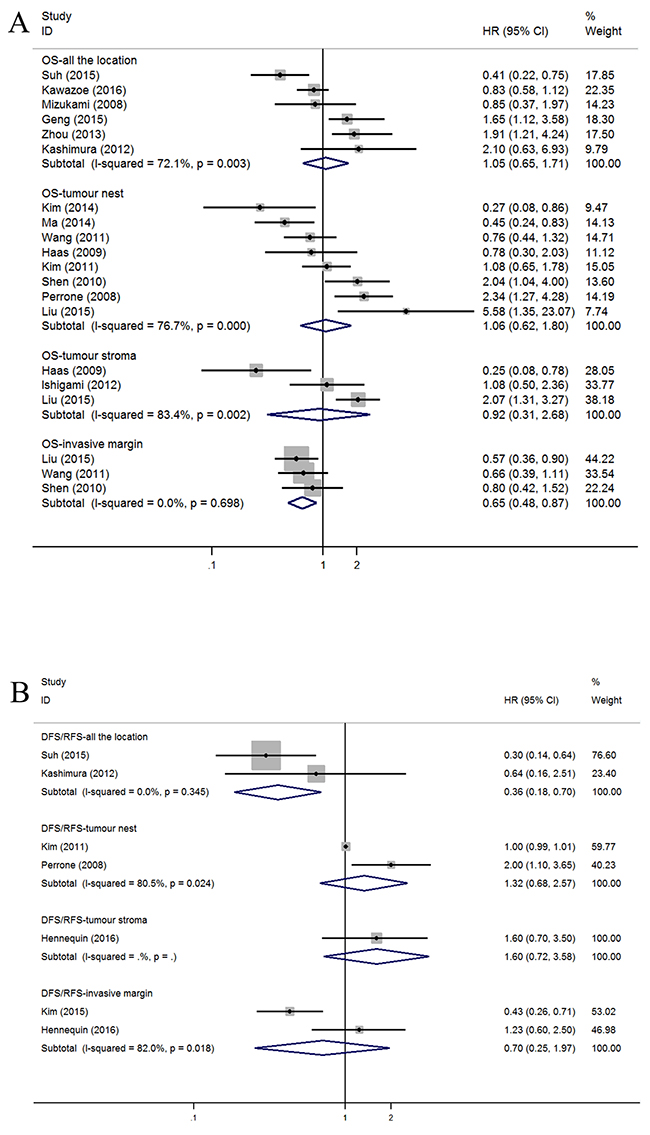
Figure 4: Forest plots of HRs to assess the correlation between prognosis and tumor-infiltrating immune cells. (A) OS and FoxP3+, (B) DFS/RFS and FoxP3+.
The high density of foxp3+ Treg cells in the AG indicated a better DFS/RFS (n=2; HR=0.36, 95% CI=0.18-0.70; I2=0.0%, P=0.345), and no association was found with limited studies between DFS/RFS and other tumor infiltration locations, including TN (n=2; HR=1.32, 95% CI=0.68-2.57; I2=80.5%, P=0.024), TS (n=1; HR=1.60, 95% CI=0.72-3.58), and TM (n=2; HR=0.70, 95% CI=0.25-1.97; I2=82.0%, P=0.018) (Figure 4B).
Tumor-associated macrophages
CD68+ TAM
One study investigating the AG showed that the OS HR was 1.58 (95% CI=1.04-2.40). No correlations were found between OS and TN (n=4; HR=0.78, 95% CI=0.47-1.29; I2=70.5%, P=0.017), TS (n=2; HR=1.39, 95% CI=0.92-2.09; I2=32.8%, P=0.222) or TM (n=2; HR=0.74, 95% CI=0.53-1.03; I2=0.0%, P=0.436) (Figure 5A).
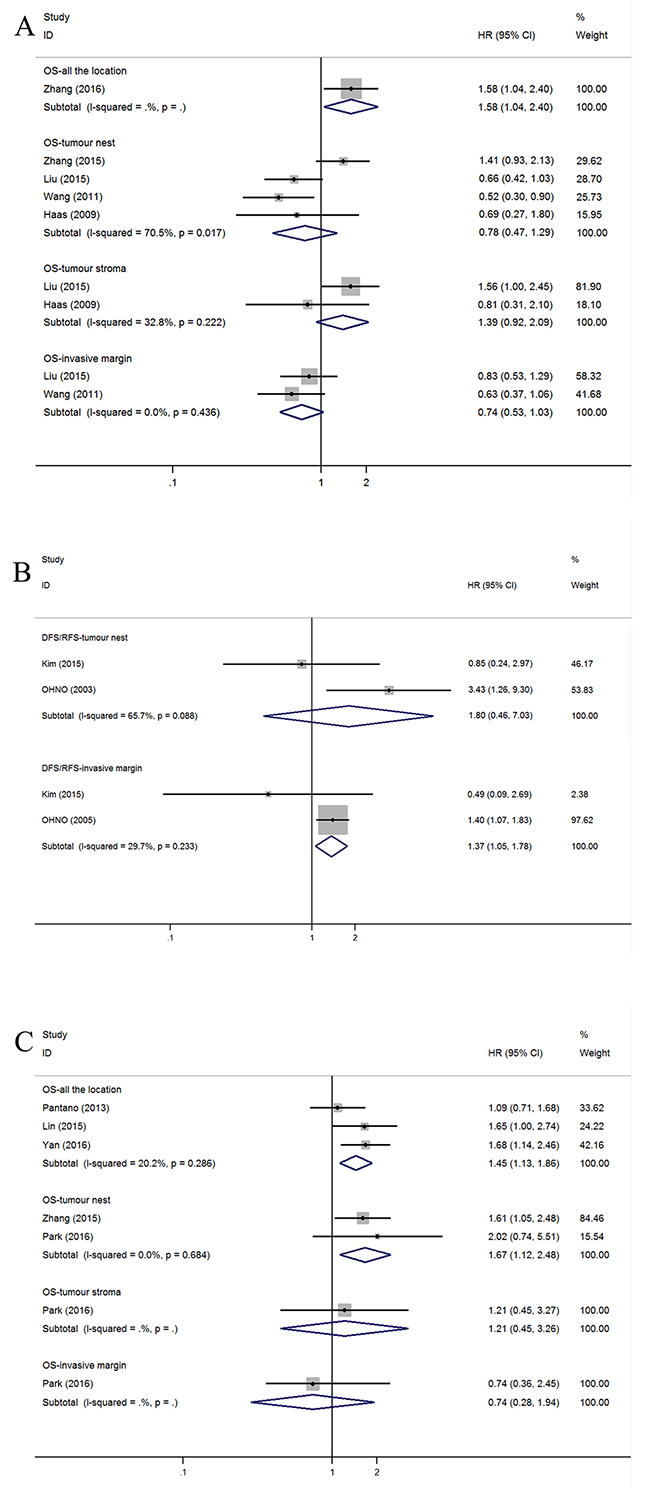
Figure 5: Forest plots of HRs to assess the correlation between prognosis and tumor-infiltrating immune cells. (A) OS and M, (B) DFS/RFS and M, (C) OS and M2.
For the five studies that assessed DFS/RFS, the pooled HRs for different infiltrating locations in TN and TM were 1.80 (n=2, 95% CI=0.46–7.03) and 1.37 (n=2, 95% CI=1.05–1.78), respectively (Figure 5B).
Subset of M2 TAM
Due to insufficient studies, we do not present the detailed pooled result of the M1. However, we drew the conclusion that worse OS is correlated with high M2 macrophage infiltration in AG (n=3; HR=1.45, 95% CI=1.13-1.86; I2=20.2%, P=0.286) and the TN (n=2; HR=1.67, 95% CI=1.12-2.48; I2=0.0%, P=0.684) but not the TM (n=1; HR=0.74, 95% CI=0.28-1.94) or the TS (n=1; HR=1.21, 95% CI=0.45-3.26) (Figure 5C).
Tumor-associated macrophages and clinicopathological characteristics
When sufficient data were available from original articles, correlations between TAM infiltration and patients’ clinicopathological characteristics were evaluated by pooling extracted data (Table 3). There was no relationship between CD68+ TAMs in the TN and gender (female vs male), tumor size (<4 m vs >4 cm), T stage (T1+T2 vs T3+T4), N stage (N0 vs N1-3) or TNM stage (I+II vs III+IV). However, male (n=2; OR=2.05, 95% CI=1.31-3.21; I2=0.0%, P=0.663) and N1-3 (n=2, OR=2.57, 95% CI=1.11-5.93; I2=67.5%, P=0.080) patients have high densities of M2 TAMs in AG, although tumor size (<5 cm vs >5 cm) was not associated with the density of M2 TAMs in AG. However, in the TN, male patients (n=2, OR=0.55, 95% CI=0.32-0.92; I2=0.0%, P=0.781) had a low density of M2 TAMs. No associations were found between T stage (T1+T2 vs T3+T4), N Stage (N0 vs N1-3) and TNM Stage (I+II vs III+IV).
Table 2: The pooled relationships between tumor-infiltrating immune cells subsets and the prognosis of patients with gastric cancer.
Subset/Outcome |
Location |
No. Of Studies |
HR(95%CI) |
Model |
Heterogeneity |
Publication bias |
||
|---|---|---|---|---|---|---|---|---|
I2 |
P value |
Begg’s P |
Egger’s P |
|||||
CD3 |
||||||||
OS |
AG |
4 |
0.71(0.57,0.90) |
Fixed |
27.9% |
0.244 |
0.308 |
0.221 |
TN |
3 |
0.58(0.42,0.80) |
Fixed |
0.00% |
0.605 |
1 |
0.49 |
|
TS |
3 |
0.50(0.37,0.68) |
Fixed |
38.4% |
0.197 |
1 |
0.589 |
|
TM |
1 |
1.04(0.67,1.61) |
- |
- |
- |
- |
- |
|
CD4 |
||||||||
OS |
AG |
3 |
0.84(0.58,1.21) |
Random |
63.9% |
0.063 |
0.296 |
0.125 |
TN |
3 |
0.72(0.45,1.16) |
Random |
54.2% |
0.113 |
0.296 |
0.424 |
|
TS |
1 |
0.62(0.39,0.96) |
- |
- |
- |
- |
- |
|
TM |
2 |
1.05(0.45,2.42) |
Random |
78.2% |
0.032 |
- |
- |
|
CD8 |
||||||||
OS |
AG |
4 |
0.90(0.83,0.97) |
Random |
49.6% |
0.114 |
0.734 |
0.07 |
TN |
5 |
0.79(0.60,1.04) |
Fixed |
28.1% |
0.235 |
0.806 |
0.661 |
|
TS |
2 |
1.39(0.92,2.08) |
Fixed |
20.0% |
0.264 |
- |
- |
|
TM |
2 |
0.75(0.52,1.09) |
Fixed |
15.7% |
0.276 |
- |
- |
|
DFS/RFS |
AG |
1 |
0.98(0.96,1.00) |
- |
- |
- |
- |
- |
TN |
2 |
1.89(0.44,8.13) |
Random |
84.8% |
0.010 |
- |
- |
|
TS |
1 |
0.65(0.40,1.05) |
- |
- |
- |
- |
- |
|
TM |
2 |
0.62(0.27,1.46) |
Random |
70.9% |
0.064 |
- |
- |
|
FoxP3 |
||||||||
OS |
AG |
6 |
1.05(0.65,1.71) |
Random |
72.1% |
0.003 |
0.707 |
0.526 |
TN |
8 |
1.06(0.62,1.80) |
Random |
76.7% |
<0.001 |
1 |
0.889 |
|
TS |
3 |
0.92(0.31,2.68) |
Random |
83.4% |
0.002 |
- |
- |
|
TM |
3 |
0.65(0.48,0.87) |
Fixed |
0.0% |
0.698 |
0.296 |
0.038 |
|
DFS/RFS |
AG |
2 |
0.36(0.18,0.70) |
Fixed |
0.0% |
0.345 |
- |
- |
TN |
2 |
1.32(0.68,2.57) |
Random |
80.5% |
0.024 |
- |
- |
|
TS |
1 |
1.60(0.72,3.58) |
- |
- |
- |
- |
- |
|
TM |
2 |
0.70(0.25,1.97) |
Random |
82.00% |
0.018 |
- |
- |
|
M |
||||||||
OS |
AG |
1 |
1.58(1.04,2.40) |
- |
- |
- |
- |
- |
TN |
4 |
0.78(0.47,1.29) |
Random |
70.5% |
0.017 |
0.734 |
0.581 |
|
TS |
2 |
1.39(0.92,2.09) |
Fixed |
32.8% |
0.222 |
- |
- |
|
TM |
2 |
0.74(0.53,1.03) |
Fixed |
0.0% |
0.436 |
- |
- |
|
DFS/RFS |
TN |
2 |
1.80(0.46,7.03) |
Random |
65.7% |
0.088 |
- |
- |
TM |
2 |
1.37(1.05,1.78) |
Fixed |
29.7% |
0.223 |
- |
- |
|
M2 |
||||||||
OS |
AG |
3 |
1.45(1.13,1.86) |
Fixed |
20.2% |
0.286 |
1 |
0.972 |
TN |
2 |
1.67(1.12,2.48) |
Fixed |
0.0% |
0.684 |
- |
- |
|
TS |
1 |
1,21(0.45,3.26) |
- |
- |
- |
- |
- |
|
TM |
1 |
0.74(0.28,1.94) |
- |
- |
- |
- |
- |
|
CD45RO |
||||||||
OS |
AG |
2 |
0.56(0.37,0.84) |
Fixed |
0.0% |
0.526 |
- |
- |
CD57 |
||||||||
OS |
TN |
2 |
0.59(0.44,0.79) |
Fixed |
0.0% |
0.420 |
- |
- |
Granzyme B |
||||||||
OS |
TN |
2 |
0.81(0.51,1.29) |
Fixed |
0.0% |
0.838 |
- |
- |
Dendritic cell |
||||||||
OS |
AG |
3 |
0.62(0.15,2.53) |
Random |
84.4% |
0.002 |
- |
- |
Abbreviations: AG=all locations, TN=tumor nest, TS=tumor stroma, TM=tumor invasive margin, OS=overall survival, DFS=disease-free survival, RFS=relapse-free survival.
Table 3: Correlations between tumor associated macrophages (TAMs) and clinicopathological characteristics.
Clinicopathological characteristics |
No of studies |
OR |
Confident interval |
Model |
heterogeneity |
|
|---|---|---|---|---|---|---|
I2 |
P |
|||||
Tumor nest CD68+ TAMs and clinicopathological characteristics |
||||||
Gender (female VS male) |
3 |
0.87 |
0.41-1.82 |
Random |
69.2% |
0.039 |
Tumor size (<4cm VS >4cm) |
2 |
0.91 |
0.57-1.45 |
Fixed |
0.0% |
0.433 |
T stage (T1+T2 VS T3+T4) |
2 |
1.20 |
0.74-1.96 |
Fixed |
0.0% |
0.346 |
N Stage(N0 VS N1-3) |
3 |
1.32 |
0.45-3.91 |
Random |
82.6% |
0.003 |
TNM Stage (I+II VS III+IV) |
2 |
1.04 |
0.34-3.91 |
Random |
84.8% |
0.010 |
All the locations M2 TAMs and clinicopathological characteristics |
||||||
Gender (female VS male) |
2 |
2.05 |
1.31-3.21 |
Fixed |
0.0% |
0.663 |
Tumor size (<5cm VS >5cm) |
2 |
1.11 |
0.71-1.73 |
Fixed |
0.0% |
0.647 |
N stage (N0 VS N1-3) |
2 |
2.57 |
1.11-5.93 |
Random |
67.5% |
0.080 |
Tumor nest M2 TAMs and clinicopathological characteristics |
||||||
Gender (female VS male) |
2 |
0.55 |
0.32-0.92 |
Fixed |
0.0% |
0.781 |
T stage (T1+T2 VS T3+T4) |
2 |
1.41 |
0.84-2.36 |
Fixed |
0.0% |
0.341 |
N Stage(N0 VS N1-3) |
2 |
1.68 |
1.02-2.78 |
Fixed |
0.0% |
0.882 |
TNM Stage (I+II VS III+IV) |
2 |
1.39 |
0.84-2.28 |
Fixed |
0.0% |
0.743 |
Other cells
Due to the limited number of studies, we optionally presented the pooled OS of certain cell subsets, such as CD45RO+ cells in AG (n=2; HR=0.56, 95% CI=0.37-0.84; I2=0.0%, P=0.526) (Figure 6A), CD57+ natural killer cells in TN (n=2; HR=0.59, 95% CI=0.44-0.79; I2=0.0%, P=0.420) (Figure 6B), granzyme B+ cells in TN (n=2; HR=0.81, 95% CI=0.51-1.29; I2=0.0%, P=0.838) (Figure 6C), and dendritic cells in AG (n=3; HR=0.62, 95% CI=0.15-2.53; I2=84.4%, P=0.002) (Figure 6D). Nevertheless, additional studies should be analyzed to determine the reproducibility of these results.
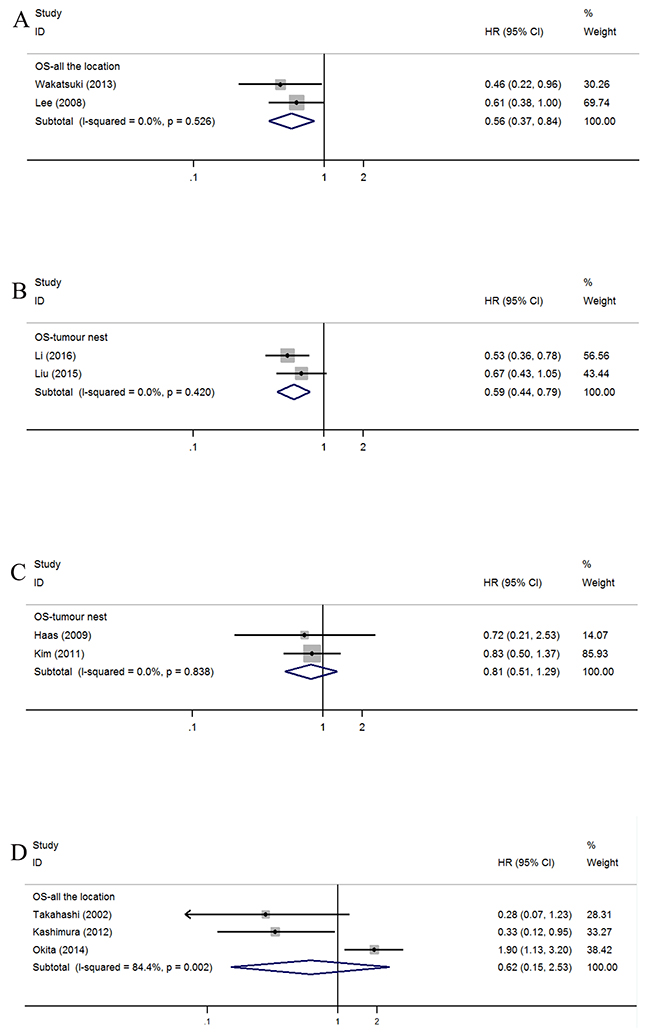
Figure 6: Forest plots of HRs to assess the correlation between prognosis and tumor-infiltrating immune cells. (A) OS and CD45RO+, (B) OS and CD57+, (C) OS and Granzyme B (D) OS and Dendritic cell.
Subgroup and sensitivity analysis
Because obvious heterogeneity was found in the TN group of FoxP3+ Treg cells, subgroup analyses were conducted to seek the source of this heterogeneity. Ethnicity, publication year, score, tumor stage and identification number were adopted as the basis for grouping (Table 4). In the group “publication before 2011,” worse OS was associated with high level of FoxP3+ Treg lymphocytes (HR=1.82, 95% CI=1.21-2.74; I2=47.10%, P=0.151). However, heterogeneity was still significant in other subgroups (Table 4). No individual study could alter the overall trend when it was removed from the meta-analysis of Foxp3+ cell infiltration in the TN panel.
Table 4: Subgroup analysis of correlation between prognosis and FoxP3+ Treg cell infiltration in the TN
Subgroup |
No of study |
HR(95%CI) |
Heterogeneity |
|
|---|---|---|---|---|
I2 |
P |
|||
Region |
||||
Asia |
6 |
0.95(0.52,1.76) |
77.20% |
0.001 |
Europe |
2 |
1.44(0.49,4.20) |
72.30% |
0.057 |
Publication year |
||||
After 2011 |
5 |
0.80(0.42,1.52) |
73.80% |
0.004 |
Before 2011 |
3 |
1.82(1.21,2.74) |
47.10% |
0.151 |
Score |
||||
≥6 |
6 |
1.07(0.60,1.89) |
68.8% |
0.007 |
<6 |
2 |
1.03(0.20,5.17) |
92.9% |
<0.001 |
Stage |
||||
I-III |
2 |
1.42(0.76,2.65) |
54.80% |
0.137 |
I-IV |
5 |
0.74(0.37,1.46) |
68.90% |
0.012 |
II-III |
1 |
2.34(1.27,4.30) |
- |
- |
Patients’ number |
||||
≥120 |
4 |
0.85(0.38,1.93) |
78.0% |
0.003 |
<120 |
4 |
1.32(0.62,3.03) |
81.7% |
0.001 |
Publication bias
The funnel plots of the CD8+ T cell infiltration in TN (Figure 7A) and FoxP3+ Treg cells (Figure 7B) were substantially symmetric. The P values of Egger’s and Begg’s tests in the other panels were all greater than 0.05, except for FoxP3+ Treg cell infiltration in TM (Begg’s P=0.038) (Table 2).
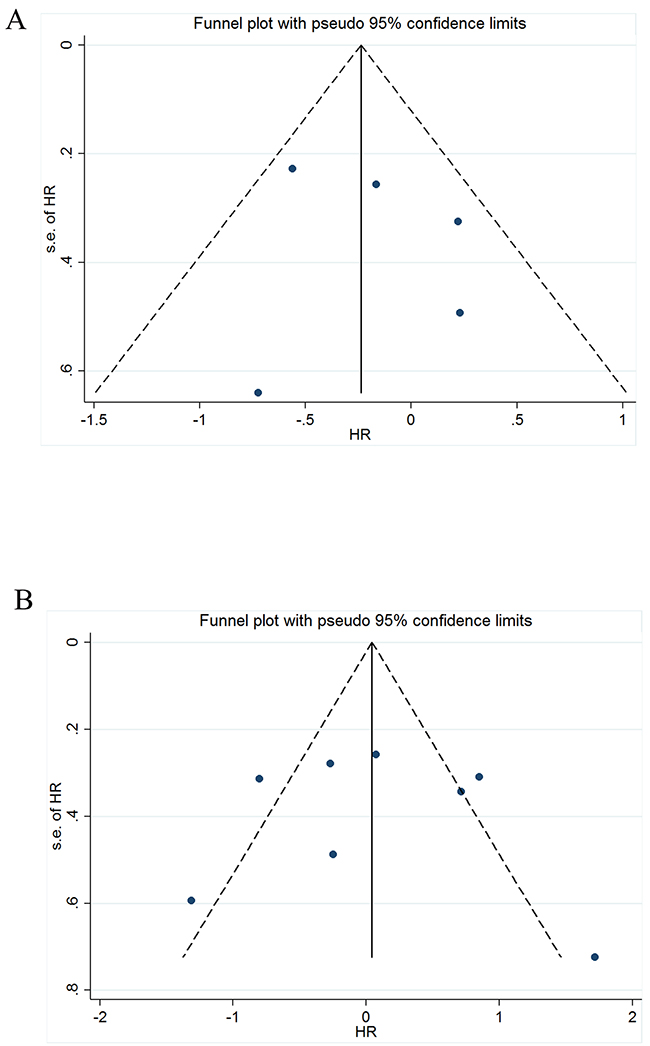
Figure 7: Funnel plot of the meta-analysis. (A) OS and CD8+ infiltration in TN, (B) OS and FoxP3 infiltration in the TN.
DISCUSSION
Tumor-infiltrating immune cells can influence the prognosis of cancer patients by directly or indirectly participating in immune responses and angiogenesis. For example, dendritic cells (DCs) can capture and present antigens released by tumor cells; effector T cells (CD8+) and TAMs can dissolve and devour tumor cells; and helper T cells (CD4+), including FoxP3 Tregs, impose restrictions on immune response [50]. There are two subgroups of TAMs: M1 cells and M2 cells. M1 TAMs promote inflammatory responses and antitumor activity, whereas M2 TAMs inhibit inflammatory responses and enhance tumor progression by promoting angiogenesis and epithelial-mesenchymal transition (EMT) [51].
This meta-analysis was performed to investigate the relationship between the clinical outcome and density of tumor-infiltrating immune cells in different locations such as TN, TS and TM. The results reveal that the high density of CD3+ T cell infiltration in AG, TN, and TS is associated with better OS. Similarly, high densities of CD8+ T cells in AG and FoxP3+ Tregs in the TM predict better OS, and a high density of FoxP3+ Tregs infiltrated into AG is associated with better DFS/RFS. Meanwhile, CD45RO+ cells in AG and CD57+ natural killer cells in TN are also associated with better OS. In contrast, TAMs (CD68+) in the TM may negatively affect DFS/RFS.
It is interesting that the prognosis of the same immune cells can vary according to different locations of infiltration. For example, a high density of CD8+ T cells in the AG is associated with better OS and has no predictive effect on prognosis in TN, TS and TM. The tumor microenvironment varies in different locations, which may cause differences of the functions of the same immune cell. The TN is mainly composed of tumor cells, which are antigens for immune cells. Tumor cells can exhaust T cells by expressing coinhibitory molecules, such as CTLA-4 and PD-L1 [52]. However, in the TS, microvessels and fibroblasts are the main support components for promoting angiogenesis and tumor metastasis, and the function of immune cells can be limited by TS components [3]. Therefore, it is not surprising that in a previous meta-analysis, a high density of foxp3+ Treg cells benefited from 1-, 3-, and 5-year OS after surgical resection [53]. However, when stratifying according to infiltrating locations, no predictive relationships were found between OS and FoxP3+ Treg cells in different infiltrating locations, such as the TN. Galon et al [16, 54] suggested that this can improve the accuracy of the prediction of patients’ survival by the combined analysis of tumor-infiltrating regions, and it is important to take the effect of tumor microenvironment into consideration.
However, summary HRs of certain locations show negative relationships between the density of immune cells and prognosis. This may result from the restriction of the number of available studies and the vast difference between the original results. For example, only three studies involved the infiltration of CD4+ T cells in TN, and one study suggested that the high density of CD4+ T cells can benefit OS [9]. However, two studies showed that CD4+ T cells are not associated with OS [32, 43]. Therefore, further studies that utilize uniform pathology standards are needed to support this conclusion.
The pooled results need to be examined from different perspectives because of several limitations. First, statistical errors are inevitable because some HRs of OS and DFS/RFS were obtained from Kaplan–Meier (KM) curves, though two researchers examined data from one curve to minimize the error. Second, vast differences resulting from different regions, genders, pathologic types, and status of microsatellite instability (MSI) may also influence the differences from the original results [22, 38, 41]. Third, we failed to include some potential studies that could have been extrapolated from other studies or conference abstracts without sufficient data.
In conclusion, the density of immune cells in different locations combined with histopathological evaluation can be used as a prognostic marker. With further research, the relationship between density, the location of tumor-infiltrating immune cells and GC patients’ clinical outcome will become clearer.
MATERIALS AND METHODS
Search strategy
We performed our meta-analysis by searching PubMed and Embase with a cut-off of September 2016. The search terms were as follows: (lymphocytes or immune cells) AND (gastric OR stomach) AND (survival OR prognosis OR prognostic). Abstracts and titles were read by two researchers who used the samecriteria to exclude irrelevant articles. The full texts of remaining articles were carefully screened to find all eligible articles to avoid unnecessary basis. Nonconformity between the two reviewers was resolved through discussions among all authors in this meta-analysis.
Inclusion and exclusion criteria
We selected eligible articles in this meta-analysis according to the following criteria: (1) evaluation of the infiltration of immune cells, such as CD3+ lymphocytes, CD4+ lymphocytes, CD8+ lymphocytes, Foxp3+ Tregs, natural killer cells and macrophages, into primary gastric tumors; (2) examination of ≥50 samples; (3) evaluation by immunohistochemical staining (tissue microarrays) or immunofluorescence; and (4) presentation of OS or DFS or RFS values for high (positive) and low (negative) immune cell infiltration density that were either specifically stated or depicted using Kaplan–Meier curves.
We excluded the following articles: case reports, review articles, meta-analyses, animal studies, studies with duplicate cases, Epstein–Barr virus (EBV)-associated gastric cancer (EBVaGC), and studies or conference abstracts without sufficient data for the calculation of HR and 95% CI.
Data extraction and study quality assessment
Two investigators independently extracted data from eligible studies. Data including author, journal, year of publication, sample size, stage of tumor, follow-up duration, immune cell subset, site of immune cells, cut-off point, outcome, hazard ratios, and 95% CIs were summarized. We evaluated the quality of each study using the criteria presented by De Graeff [55], which were derived from McShane et al [56] and Hayes et al [57]; details are shown in Supplementary Table 2.
Statistical analysis
Integrated calculation of the extracted data in this meta-analysis was performed using Stata 14.0 software. For time-to-event outcomes, HRs along with 95% CIs were pooled to measure the correlation between tumor-infiltrating immune cell density and prognosis. When Kaplan–Meier curves were provided instead of HR, two researchers independently estimated the HR indirectly from the curves using Engauge Digitizer version 9.0 according to the methods described by Tierney et al [58, 59]. The chi-square test and I2 statistic were used to assess heterogeneity [60]. Heterogeneity was thought to exist when P<0.05 and/or I2>50%; in such cases, a random-effects model was used. Then, to identify the source of heterogeneity, subgroup analysis was employed. Publication bias was examined by performing Begg’s and Egger’s tests and evaluating the symmetry of the funnel plot [61].
Author contributions
Wen Jiang and Ke Liu contributed equally to this work. Wen Jiang, Ke Liu, Qing Guo. and Kailin Cai contributed to the study design, literature search, data analysis, and the writing of the manuscript. Liming Shen and Yinghao Cao contributed to the literature search and collection of the data. Jianguo Shi, Heng Cao and Bo Liu contributed to the data analysis and arrangement of related figures and tables. Ji Cheng, Jing Wu, Kaixiong Tao and Guobin Wang contribute to the review and revise of the manuscript.
ACKNOWLEDGMENTS
This study was supported by grants from the National Natural Science Foundation of China (No.81272655), the Research Fund for Public Welfare in the Health Industry, Health Ministry of China (No. 201402015) and Clinical Research Physician Program of Tongji Medical College, HUST.
CONFLICTS OF INTEREST
There are no conflicts of interest to declare.
REFERENCES
1. Fitzmaurice C, Dicker D, Pain A, Hamavid H, Moradi-Lakeh M, MacIntyre MF, Allen C, Hansen G, Woodbrook R, Wolfe C, Hamadeh RR, Moore A, Werdecker A, et al, and Global Burden of Disease Cancer Collaboration. The Global Burden of Cancer 2013. JAMA Oncol. 2015; 1:505–27.
2. Van Cutsem E, Sagaert X, Topal B, Haustermans K, Prenen H. Gastric cancer. London, England: Lancet; 2016.
3. Lu P, Weaver VM, Werb Z. The extracellular matrix: a dynamic niche in cancer progression. J Cell Biol. 2012; 196:395–406.
4. Fridman WH, Pagès F, Sautès-Fridman C, Galon J. The immune contexture in human tumours: impact on clinical outcome. Nat Rev Cancer. 2012; 12:298–306.
5. Yu P, Fu YX. Tumor-infiltrating T lymphocytes: friends or foes? Lab Invest. 2006; 86:231–45.
6. Sakaguchi S, Yamaguchi T, Nomura T, Ono M. Regulatory T cells and immune tolerance. Cell. 2008; 133:775–87.
7. Mantovani A, Sozzani S, Locati M, Allavena P, Sica A. Macrophage polarization: tumor-associated macrophages as a paradigm for polarized M2 mononuclear phagocytes. Trends Immunol. 2002; 23:549–55.
8. Correale P, Rotundo MS, Del Vecchio MT, Remondo C, Migali C, Ginanneschi C, Tsang KY, Licchetta A, Mannucci S, Loiacono L, Tassone P, Francini G, Tagliaferri P. Regulatory (FoxP3+) T-cell tumor infiltration is a favorable prognostic factor in advanced colon cancer patients undergoing chemo or chemoimmunotherapy. J Immunother. 2010; 33:435–41.
9. Liu K, Yang K, Wu B, Chen H, Chen X, Chen X, Jiang L, Ye F, He D, Lu Z, Xue L, Zhang W, Li Q, et al. Tumor-infiltrating immune cells are associated with prognosis of gastric cancer. Medicine (Baltimore). 2015; 94:e1631.
10. Kim JW, Nam KH, Ahn SH, Park DJ, Kim HH, Kim SH, Chang H, Lee JO, Kim YJ, Lee HS, Kim JH, Bang SM, Lee JS, Lee KW. Prognostic implications of immunosuppressive protein expression in tumors as well as immune cell infiltration within the tumor microenvironment in gastric cancer. Gastric Cancer. 2016; 19:42–52.
11. Ohri CM, Shikotra A, Green RH, Waller DA, Bradding P. Macrophages within NSCLC tumour islets are predominantly of a cytotoxic M1 phenotype associated with extended survival. Eur Respir J. 2009; 33:118–26.
12. Dieu-Nosjean MC, Antoine M, Danel C, Heudes D, Wislez M, Poulot V, Rabbe N, Laurans L, Tartour E, de Chaisemartin L, Lebecque S, Fridman WH, Cadranel J. Long-term survival for patients with non-small-cell lung cancer with intratumoral lymphoid structures. J Clin Oncol. 2008; 26:4410–17.
13. Simpson JA, Al-Attar A, Watson NF, Scholefield JH, Ilyas M, Durrant LG. Intratumoral T cell infiltration, MHC class I and STAT1 as biomarkers of good prognosis in colorectal cancer. Gut. 2010; 59:926–33.
14. Mahmoud SM, Paish EC, Powe DG, Macmillan RD, Grainge MJ, Lee AH, Ellis IO, Green AR. Tumor-infiltrating CD8+ lymphocytes predict clinical outcome in breast cancer. J Clin Oncol. 2011; 29:1949–55.
15. Zhang L, Conejo-Garcia JR, Katsaros D, Gimotty PA, Massobrio M, Regnani G, Makrigiannakis A, Gray H, Schlienger K, Liebman MN, Rubin SC, Coukos G. Intratumoral T cells, recurrence, and survival in epithelial ovarian cancer. N Engl J Med. 2003; 348:203–13.
16. Galon J, Costes A, Sanchez-Cabo F, Kirilovsky A, Mlecnik B, Lagorce-Pagès C, Tosolini M, Camus M, Berger A, Wind P, Zinzindohoué F, Bruneval P, Cugnenc PH, et al. Type, density, and location of immune cells within human colorectal tumors predict clinical outcome. Science. 2006; 313:1960–64.
17. Wang B, Xu D, Yu X, Ding T, Rao H, Zhan Y, Zheng L, Li L. Association of intra-tumoral infiltrating macrophages and regulatory T cells is an independent prognostic factor in gastric cancer after radical resection. Ann Surg Oncol. 2011; 18:2585–93.
18. Ishigami S, Arigami T, Uenosono Y, Matsumoto M, Okumura H, Uchikado Y, Kita Y, Nishizono Y, Maemura K, Kijima Y, Nakajo A, Owaki T, Ueno S, et al. Cancerous HLA class I expression and regulatory T cell infiltration in gastric cancer. Cancer Immunol Immunother. 2012; 61:1663–69.
19. Zhou S, Shen Z, Wang Y, Ma H, Xu S, Qin J, Chen L, Tao H, Zhen Z, Chen G, Zhang Z, Li R, Xiao H, et al. CCR7 expression and intratumoral FOXP3+ regulatory T cells are correlated with overall survival and lymph node metastasis in gastric cancer. PLoS One. 2013; 8:e74430.
20. Kashimura S, Saze Z, Terashima M, Soeta N, Ohtani S, Osuka F, Kogure M, Gotoh M. CD83(+) dendritic cells and Foxp3(+) regulatory T cells in primary lesions and regional lymph nodes are inversely correlated with prognosis of gastric cancer. Gastric Cancer. 2012; 15:144–53.
21. Wakatsuki K, Sho M, Yamato I, Takayama T, Matsumoto S, Tanaka T, Migita K, Ito M, Hotta K, Nakajima Y. Clinical impact of tumor-infiltrating CD45RO+ memory T cells on human gastric cancer. Oncol Rep. 2013; 29:1756–62.
22. Kawazoe A, Kuwata T, Kuboki Y, Shitara K, Nagatsuma AK, Aizawa M, Yoshino T, Doi T, Ohtsu A, Ochiai A. Clinicopathological features of programmed death ligand 1 expression with tumor-infiltrating lymphocyte, mismatch repair, and Epstein-Barr virus status in a large cohort of gastric cancer patients. Gastric Cancer. 2016.
23. Takahashi A, Kono K, Itakura J, Amemiya H, Feng Tang R, Iizuka H, Fujii H, Matsumoto Y. Correlation of vascular endothelial growth factor-C expression with tumor-infiltrating dendritic cells in gastric cancer. Oncology. 2002; 62:121–27.
24. Arigami T, Uenosono Y, Ishigami S, Matsushita D, Hirahara T, Yanagita S, Okumura H, Uchikado Y, Nakajo A, Kijima Y, Natsugoe S. Decreased density of CD3+ tumor-infiltrating lymphocytes during gastric cancer progression. J Gastroenterol Hepatol. 2014; 29:1435–41.
25. Ohno S, Inagawa H, Dhar DK, Fujii T, Ueda S, Tachibana M, Suzuki N, Inoue M, Soma GI, Nagasue N. The Degree of Macrophage Infiltration into the Cancer Cell Nest is a Significant Predictor of Survival in Gastric Cancer Patients. Anticancer Res. 2003; 23:5015–22.
26. Geng Y, Wang H, Lu C, Li Q, Xu B, Jiang J, Wu C. Expression of costimulatory molecules B7-H1, B7-H4 and Foxp3+ Tregs in gastric cancer and its clinical significance. Int J Clin Oncol. 2015; 20:273–81.
27. Suh JH, Won KY, Kim GY, Bae GE, Lim SJ, Sung JY, Park YK, Kim YW, Lee J. Expression of tumoral FOXP3 in gastric adenocarcinoma is associated with favorable clinicopathological variables and related with Hippo pathway. Int J Clin Exp Pathol. 2015; 8:14608–18.
28. Li T, Zhang Q, Jiang Y, Yu J, Hu Y, Mou T, Chen G, Li G. Gastric cancer cells inhibit natural killer cell proliferation and induce apoptosis via prostaglandin E2. OncoImmunology. 2015; 5:e1069936.
29. Ma GF, Miao Q, Liu YM, Gao H, Lian JJ, Wang YN, Zeng XQ, Luo TC, Ma LL, Shen ZB, Sun YH, Chen SY. High FoxP3 expression in tumour cells predicts better survival in gastric cancer and its role in tumour microenvironment. Br J Cancer. 2014; 110:1552–60.
30. Zhang J, Yan Y, Yang Y, Wang L, Li M, Wang J, Liu X, Duan X, Wang J. High Infiltration of Tumor-Associated Macrophages Influences Poor Prognosis in Human Gastric Cancer Patients, Associates With the Phenomenon of EMT. Medicine (Baltimore). 2016; 95:e2636.
31. Yan Y, Zhang J, Li JH, Liu X, Wang JZ, Qu HY, Wang JS, Duan XY. High tumor-associated macrophages infiltration is associated with poor prognosis and may contribute to the phenomenon of epithelial-mesenchymal transition in gastric cancer. Onco Targets Ther. 2016; 9:3975–83.
32. Shen Z, Zhou S, Wang Y, Li RL, Zhong C, Liang C, Sun Y. Higher intratumoral infiltrated Foxp3+ Treg numbers and Foxp3+/CD8+ ratio are associated with adverse prognosis in resectable gastric cancer. J Cancer Res Clin Oncol. 2010; 136:1585–95.
33. Chen LJ, Zheng X, Shen YP, Zhu YB, Li Q, Chen J, Xia R, Zhou SM, Wu CP, Zhang XG, Lu BF, Jiang JT. Higher numbers of T-bet(+) intratumoral lymphoid cells correlate with better survival in gastric cancer. Cancer Immunol Immunother. 2013; 62:553–61.
34. Li K, Zhu Z, Luo J, Fang J, Zhou H, Hu M, Maskey N, Yang G. Impact of chemokine receptor CXCR3 on tumor-infiltrating lymphocyte recruitment associated with favorable prognosis in advanced gastric cancer. Int J Clin Exp Pathol. 2015; 8:14725–32.
35. Zhang H, Wang X, Shen Z, Xu J, Qin J, Sun Y. Infiltration of diametrically polarized macrophages predicts overall survival of patients with gastric cancer after surgical resection. Gastric Cancer. 2015; 18:740–50.
36. Perrone G, Ruffini PA, Catalano V, Spino C, Santini D, Muretto P, Spoto C, Zingaretti C, Sisti V, Alessandroni P, Giordani P, Cicetti A, D'Emidio S, et al. Intratumoural FOXP3-positive regulatory T cells are associated with adverse prognosis in radically resected gastric cancer. Eur J Cancer. 2008; 44:1875–82. https://doi.org/10.1016/j.ejca.2008.05.017.
37. Mizukami Y, Kono K, Kawaguchi Y, Akaike H, Kamimura K, Sugai H, Fujii H. Localisation pattern of Foxp3+ regulatory T cells is associated with clinical behaviour in gastric cancer. Br J Cancer. 2008; 98:148–53.
38. Giampieri R, Maccaroni E, Mandolesi A, Del Prete M, Andrikou K, Faloppi L, Bittoni A, Bianconi M, Scarpelli M, Bracci R, Scartozzi M, Cascinu S. Mismatch repair deficiency may affect clinical outcome through immune response activation in metastatic gastric cancer patients receiving first-line chemotherapy. Gastric Cancer. 2016.
39. Park JY, Sung JY, Lee J, Park YK, Kim YW, Kim GY, Won KY, Lim SJ. Polarized CD163+ tumor-associated macrophages are associated with increased angiogenesis and CXCL12 expression in gastric cancer. Clin Res Hepatol Gastroenterol. 2016; 40:357–65.
40. Kim KJ, Wen XY, Yang HK, Kim WH, Kang GH. Prognostic Implication of M2 Macrophages Are Determined by the Proportional Balance of Tumor Associated Macrophages and Tumor Infiltrating Lymphocytes in Microsatellite-Unstable Gastric Carcinoma. PLoS One. 2015; 10:e0144192.
41. Kim KJ, Lee KS, Cho HJ, Kim YH, Yang HK, Kim WH, Kang GH. Prognostic implications of tumor-infiltrating FoxP3+ regulatory T cells and CD8+ cytotoxic T cells in microsatellite-unstable gastric cancers. Hum Pathol. 2014; 45:285–93.
42. Lee HE, Chae SW, Lee YJ, Kim MA, Lee HS, Lee BL, Kim WH. Prognostic implications of type and density of tumour-infiltrating lymphocytes in gastric cancer. Br J Cancer. 2008; 99:1704–11.
43. Kim HI, Kim H, Cho HW, Kim SY, Song KJ, Hyung WJ, Park CG, Kim CB. The ratio of intra-tumoral regulatory T cells (Foxp3+)/helper T cells (CD4+) is a prognostic factor and associated with recurrence pattern in gastric cardia cancer. J Surg Oncol. 2011; 104:728–33.
44. Pantano F, Berti P, Guida FM, Perrone G, Vincenzi B, Amato MM, Righi D, Dell'aquila E, Graziano F, Catalano V, Caricato M, Rizzo S, Muda AO, et al. The role of macrophages polarization in predicting prognosis of radically resected gastric cancer patients. J Cell Mol Med. 2013; 17:1415–21.
45. Ohno S, Inagawa H, Dhar DK, Fujii T, Ueda S, Tachibana M, Ohno Y, Suzuki N, Inoue M, Soma G, Nagasue N. Role of tumor-associated macrophages (TAM) in advanced gastric carcinoma: the impact on FasL-mediated counterattack. Anticancer Res. 2005; 25:463–70.
46. Okita Y, Tanaka H, Ohira M, Muguruma K, Kubo N, Watanabe M, Fukushima W, Hirakawa K. Role of tumor-infiltrating CD11b+ antigen-presenting cells in the progression of gastric cancer. J Surg Res. 2014; 186:192–200.
47. Lin CN, Wang CJ, Chao YJ, Lai MD, Shan YS. The significance of the co-existence of osteopontin and tumor-associated macrophages in gastric cancer progression. BMC Cancer. 2015; 15:128.
48. Haas M, Dimmler A, Hohenberger W, Grabenbauer GG, Niedobitek G, Distel LV. Stromal regulatory T-cells are associated with a favourable prognosis in gastric cancer of the cardia. BMC Gastroenterol. 2009; 9:65.
49. Hennequin A, Derangère V, Boidot R, Apetoh L, Vincent J, Orry D, Fraisse J, Causeret S, Martin F, Arnould L, Beltjens F, Ghiringhelli F, Ladoire S. Tumor infiltration by Tbet+ effector T cells and CD20+ B cells is associated with survival in gastric cancer patients. OncoImmunology. 2015; 5:e1054598.
50. Gajewski TF, Schreiber H, Fu YX. Innate and adaptive immune cells in the tumor microenvironment. Nat Immunol. 2013; 14:1014–22.
51. Komohara Y, Fujiwara Y, Ohnishi K, Takeya M. Tumor-associated macrophages: potential therapeutic targets for anti-cancer therapy. Adv Drug Deliv Rev. 2016; 99:180–85.
52. Baumeister SH, Freeman GJ, Dranoff G, Sharpe AH. Coinhibitory Pathways in Immunotherapy for Cancer. Annu Rev Immunol. 2016; 34:539–73.
53. Huang Y, Liao H, Zhang Y, Yuan R, Wang F, Gao Y, Wang P, Du Z. Prognostic value of tumor-infiltrating FoxP3+ T cells in gastrointestinal cancers: a meta analysis. PLoS One. 2014; 9:e94376.
54. Galon J, Mlecnik B, Bindea G, Angell HK, Berger A, Lagorce C, Lugli A, Zlobec I, Hartmann A, Bifulco C, Nagtegaal ID, Palmqvist R, Masucci GV, et al. Towards the introduction of the 'Immunoscore' in the classification of malignant tumours. J Pathol. 2014; 232:199–209.
55. de Graeff P, Crijns AP, de Jong S, Boezen M, Post WJ, de Vries EG, van der Zee AG, de Bock GH. Modest effect of p53, EGFR and HER-2/neu on prognosis in epithelial ovarian cancer: a meta-analysis. Br J Cancer. 2009; 101:149–59.
56. McShane LM, Altman DG, Sauerbrei W, Taube SE, Gion M, Clark GM, and Statistics Subcommittee of the NCI-EORTC Working Group on Cancer Diagnostics. REporting recommendations for tumour MARKer prognostic studies (REMARK). Br J Cancer. 2005; 93:387–91.
57. Hayes DF, Bast RC, Desch CE, Fritsche H Jr, Kemeny NE, Jessup JM, Locker GY, Macdonald JS, Mennel RG, Norton L, Ravdin P, Taube S, Winn RJ. Tumor marker utility grading system: a framework to evaluate clinical utility of tumor markers. J Natl Cancer Inst. 1996; 88:1456–66.
58. Tierney JF, Stewart LA, Ghersi D, Burdett S, Sydes MR. Practical methods for incorporating summary time-to-event data into meta-analysis. Trials. 2007; 8:16.
59. Parmar MK, Torri V, Stewart L. Extracting summary statistics to perform meta-analyses of the published literature for survival endpoints. Stat Med. 1998; 17:2815–34.
60. Higgins JP, Thompson SG. Quantifying heterogeneity in a meta-analysis. Stat Med. 2002; 21:1539–58.
61. Egger M, Davey Smith G, Schneider M, Minder C. Bias in meta-analysis detected by a simple, graphical test. BMJ. 1997; 315:629–34.