
INTRODUCTION
Low-grade glial neoplasms (pilocytic astrocytoma; PA) account for the majority of brain tumors in children between the ages of five and fifteen. In contrast to adult high-grade gliomas, low-grade gliomas in children typically arise in cerebellum, brainstem and optic pathway. While the majority of PAs developing within the cerebellum harbor BRAF gene rearrangements [1], one of the most common genetic etiologies for optic pathway gliomas (OPGs) is the neurofibromatosis type 1 (NF1) inherited cancer syndrome. Unlike their sporadic counterparts, these NF1-OPGs result from bi-allelic inactivation of the NF1 tumor suppressor gene [2–4]. However, similar to PAs arising in other brain locations, NF1-OPGs contain low proliferative indices (< 1%), and harbor both glial fibrillary acidic protein (GFAP)- and Olig2-immunoreactive cells [5].
In the context of NF1, 15–20% of individuals will develop an OPG, which can arise at any age during childhood, ranging from infancy [6] to the early teens [7]. Moreover, there is a considerable spectrum of anatomic and clinical heterogeneity. As such, NF1-OPGs can form anywhere along the optic pathway from the optic nerves to the optic radiations, and only 30–50% of children with NF1-OPG experience visual impairment [8] or precocious puberty due to hypothalamic involvement [9].
Since human NF1-OPGs are rarely biopsied and patient-derived xenografts are unavailable, the majority of our insights into pathogenesis of these tumors have derived from the use of genetically-engineered mouse (GEM) strains [10, 11]. These GEM models have been particularly informative for preclinical therapeutic drug discovery and evaluation, resulting in the identification of mechanistic target of rapamycin and MEK as potential targets for optic glioma treatment [12–14], now under evaluation in human clinical trials.
In addition, these GEM models have been useful in defining the potential cells of origin for murine optic glioma. In these studies, somatic Nf1 loss in BLBP+ [15] or GFAP+ [11] neuroglial progenitor cells that also co-express the CD133 stem cell marker results in optic glioma formation by 3 months of age. However, somatic Nf1 loss in NG2+ cells during embryogenesis [16] or postnatal GFAP+ astrocytes [17] do not generate optic gliomas. In addition, these Nf1 GEM strains support a regional origin for optic glioma cells of origin to the embryonic third ventricle (TVZ) [17], consistent with one human study using gene expression profiling [18].
The prevalence of Olig2+ cells in human gliomas [5], coupled with recent findings that Olig2+ oligodendrocyte precursor cells (OPCs) are the cells of origin for murine malignant glioma [19], raises the possibility that OPCs might be another tumor-initiating cell population for Nf1 murine optic glioma. Herein, we employ two distinct Cre transgenic mouse strains, in which somatic Nf1 gene inactivation occurs in Olig2+ glial progenitor cells or CD133+ neural progenitor/stem cells, to demonstrate that the cell of origin is one major determinant in dictating the temporal course of optic gliomagenesis in mice.
RESULTS AND DISCUSSION
Mouse optic gliomas harbor increased numbers Olig2+ cells
Previous studies in human low-grade gliomas (PAs) have revealed increased numbers of Olig2+ cells [5]. To determine whether these findings were similarly observed in Nf1 murine optic gliomas, we leveraged a representative GEM strain (Nf1flox/mut; GFAP-Cre; “FMC”), which harbors a germline inactivating Nf1 gene mutation, but undergoes somatic loss of the remaining wild-type Nf1 allele (Nf1flox allele) in GFAP-Cre-expressing neuroglial progenitors by embryonic day 14.5 (E14.5). By 3 months of age, ~90% of FMC mice form low-grade gliomas within the prechiasmatic optic nerves and chiasms, characterized by increased proliferation, microglia infiltration, nuclear atypia, cellular pleiomorphism, axonal damage, and retinal ganglion cell death [11]. Similar to their human counterparts, more Olig2+ cells (1.7-fold) were found in FMC mouse optic gliomas relative to their non-neoplastic optic nerve counterparts (Figure 1A). Increased Olig2+ cell content was also observed in other Nf1 GEM strains with optic glioma (data not shown).
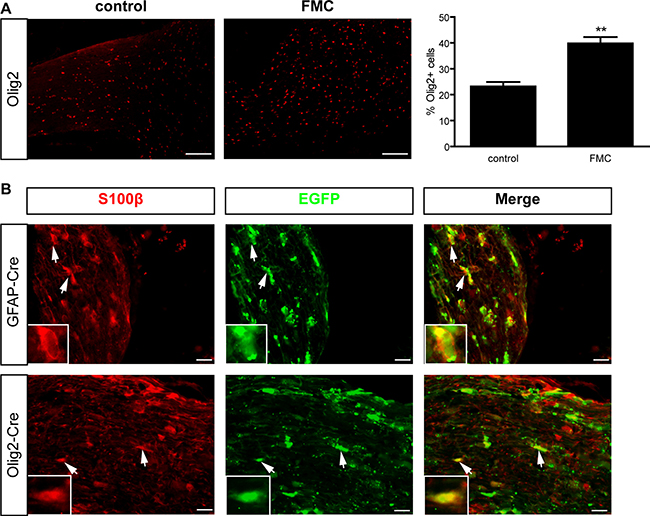
Figure 1: Mouse optic gliomas harbor increased numbers of Olig2+ cells. (A) 3-month-old FMC optic gliomas exhibit a 1.7- fold increase in the percentage of Olig2+ cells relative to non-neoplastic optic nerves. Error bars, mean ± SEM. **p = 0.0011. (B) Optic nerves from Rosa-GREEN x GFAP-Cre and Olig2-Cre mice, respectively, reveal EGFP+/S100β+ glia. Representative images include insets of immunopositive cells (arrows). Scale bar, 10 μm.
Somatic Nf1 loss in Olig2+ cells results in delayed optic glioma formation
To determine whether Olig2+ cells can generate astroglial cells in the optic nerve, Olig2-Cre mice were intercrossed with Rosa-GREEN reporter mice. The Olig2-Cre mouse employed is a transgenic strain containing endogenous Olig2 promoter elements, thus fully recapitulating normal Olig2 expression in vivo [20]. Similar to the GFAP-Cre mice used to generate FMC optic gliomas, Olig2-Cre mice also give rise to S100β+ glia (Figure 1B) and GFAP+ astrocytes (data not shown). Since Olig2+ cells can give rise to astrocytes in the optic nerve, we next sought to determine whether Nf1 loss in Olig2+ cells was sufficient for optic glioma formation in Nf1+/− mice.
While Nf1flox/mut; Olig2-Cre (“FMOC”) mice had larger optic nerve volumes relative to control littermates at 3 months of age (Supplementary Figure 1A), in striking contrast to FMC optic nerves, there was no evidence for glioma. In this respect, increased Iba1+ microglia and proliferation (Ki67+ cells) were not observed relative to control littermates (Figure 2). While no tumors were identified, there were more enlarged axons (Supplementary Figure 1B), increased myelin sheath thickness (Supplementary Figure 1C), and reduced g-ratios (Supplementary Figure 1D), similar to that observed following Nf1 loss in other oligodendrocyte lineage cells [21], as well as associated retinal pathology, including increased TUNEL+ labeling, decreased Brn3a+ retinal ganglion cells, and thinning of the retinal nerve fiber layer (Figure 2).
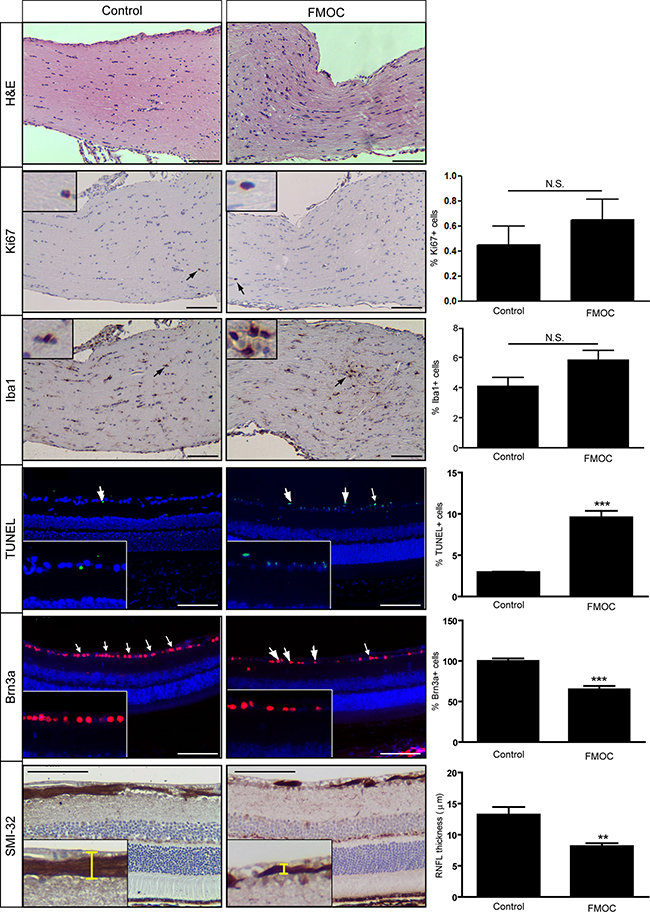
Figure 2: FMOC mice do not develop optic gliomas at 3 months of age. FMOC mice have increased cellularity (hematoxylin/eosin) compared to controls (n = 5 mice/group). No change in the percentage of Ki67+ or Iba1+ cells was observed. There was increased retinal cell apoptosis (%TUNEL+ cells), fewer Brn3a+ cells, and reduced retinal nerve fiber layer (RNFL) thickness in FMOC mice relative to controls. Nuclei were counterstained with DAPI (blue). Representative images include insets of immunopositive cells (arrows). Scale bar, 100 μm. Error bars, mean ± SEM. ***p < 0.0003; **p = 0.0078; N.S. = not significant
We next sought to determine whether somatic Nf1 loss in Olig2+ progenitors delayed the onset of glioma development. For this analysis, we chose to examine these mice at both 4.5 and 6 months of age. At 4.5 months of age, FMOC mice had enlarged optic nerve volumes (0.088mm3 ± 0.016), but microglia content (%Iba1+ cells; 6.92 ± 0.5) and proliferation (%Ki67+ cells; 0.28 ± 0.35) were comparable to that observed in control mice. These results suggest that optic gliomas had not formed at this time point.
However, at 6 months of age, optic nerve volumes in FMOC mice were increased (Figure 3), with enlarged axons, increased myelin sheath thickness (Supplementary Figure 2), and retinal pathology (Figure 3). Importantly, there was now a 1.8-fold increase in the percent of Iba1+ microglia and a 5.7-fold increase in the percent of Ki67+ cells relative to controls (Figure 3), indicating glioma. In addition, there was increased retinal apoptosis (%TUNEL+ cells), retinal ganglion cell loss (%Brn3a+ cells), and retinal nerve fiber layer thinning (SMI-32 immunostaining). Collectively, these data reveal that while somatic Nf1 loss in Olig2+ cells results in optic glioma formation, the latency is extended relative to FMC mice [11].
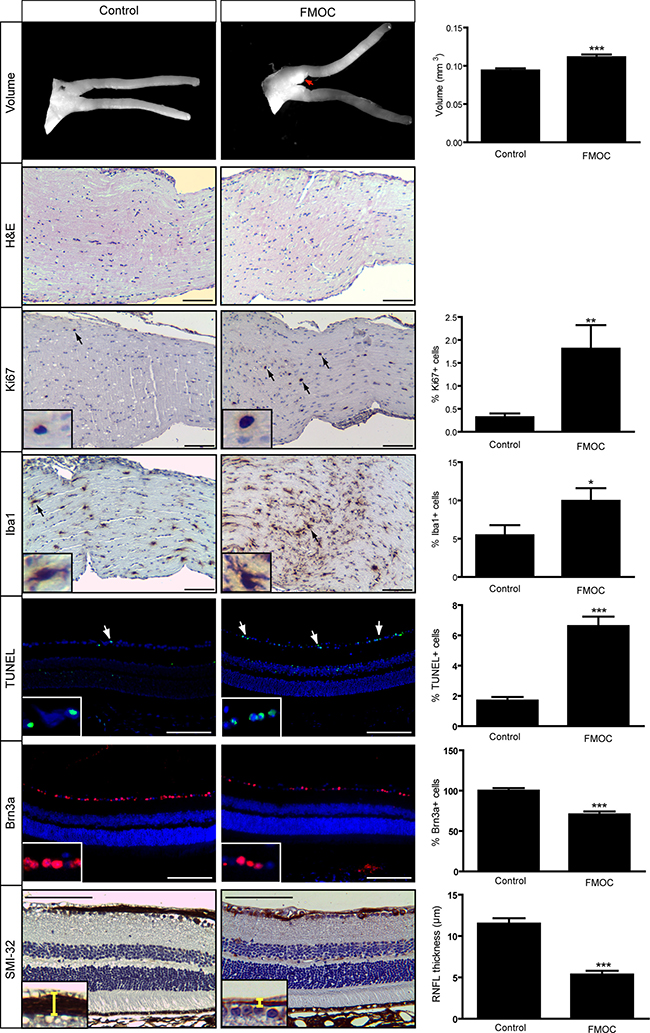
Figure 3: FMOC mice develop optic glioma by 6 months of age. FMOC mice have larger optic nerve volumes relative to controls as well as increased cellularity (hematoxylin/eosin) (n = 5 mice/group). 6-month-old FMOC mice show increased percentages of Ki67+ and Iba1+ cells. There was also increased retinal cell apoptosis (%TUNEL+ cells), fewer Brn3a+ cells, and reduced RNFL thickness in FMOC mice. Nuclei were counterstained with DAPI (blue). Representative images include insets of immunopositive cells (arrows). Scale bar, 100 μm. Error bars, mean ± SEM. ***p < 0.0006; **p = 0.0038; *p = 0.049.
Delayed optic gliomagenesis reflects distinct cells of origin
One possible interpretation for the delay in glioma formation is the timing or brain location of somatic Nf1 loss in FMOC mice relative to FMC mice. However, the Olig2-Cre transgene was expressed by E12, similar to previously-employed Nf1 optic glioma GEM models [15], labeling cells along the lateral (data not shown) and third ventricles where Sox2+ progenitors reside (Figure 4A).
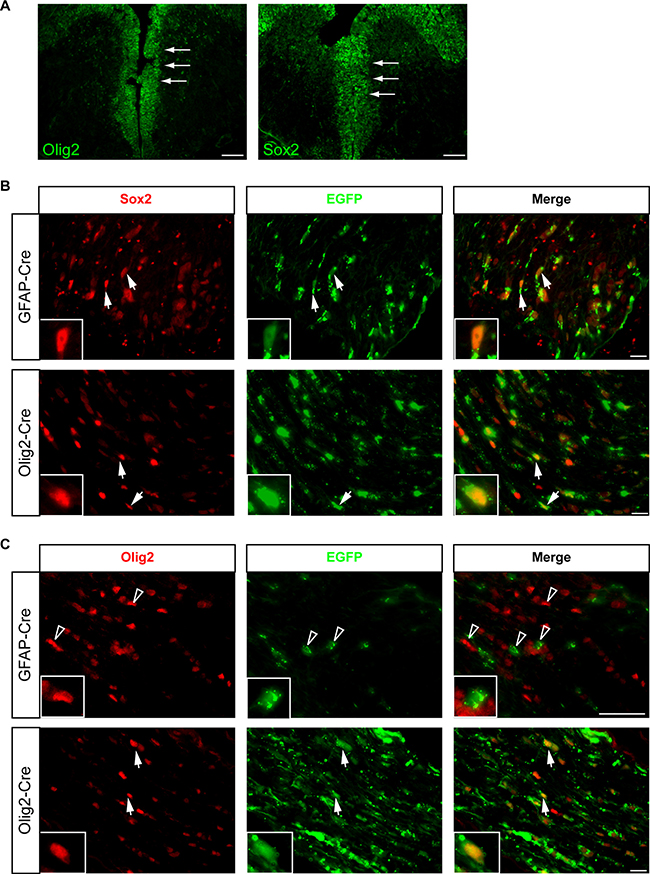
Figure 4: Cells of origin for FMOC optic gliomas are distinct from those that give rise to FMC mouse optic gliomas. (A) Olig2+ cells line the third ventricular surface as early as E11.5. Sox2 expressing cells are located in the same region within the third ventricle at E11.5 as Olig2+ cells. (B) Optic nerve sections from Rosa-GREEN x GFAP-Cre and Olig2-Cre mice at 3 weeks of age, respectively, contain both EGFP/Sox2 double-positive cells. (C) In contrast, EGFP/Olig2+ cells are only found in the optic nerves of Rosa-GREEN x Olig2-Cre mice, but not in those from Rosa-GREEN x GFAP-Cre mice, at 3 weeks of age. Representative images are shown with insets of immunopositive cells. Arrowheads indicate single positive cells, whereas arrows indicate double-positive cells.
Next, we performed lineage tracing of the cells of origin in these mouse strains, leveraging Rosa-GREEN reporter mice intercrossed with GFAP-Cre and Olig2-Cre mice, respectively. Within the optic nerves both GFAP-Cre x Rosa-GREEN and Olig2-Cre x Rosa-GREEN mice contained EGFP+ cells that co-labeled with S100β (Figure 1C) or Sox2 (Figure 4B). In contrast, EGFP/Olig2+ cells were only found in the optic nerves of Olig2-Cre x Rosa-GREEN mice (Figure 4C). The fact that the GFAP-Cre transgene does not generate Olig2+ cells suggests that the cells of origin for FMOC optic gliomas are distinct from those that give rise to FMC optic gliomas.
Finally, to demonstrate that the cell of origin is a major determinant underlying the observed differences in tumor latency, we employed a Cre transgenic strain in which Nf1 loss could be specifically induced in CD133+ neural progenitor/stem cells at a similar time as occurs in FMC mice. The prominin1-CreER strain contains a tamoxifen-regulated Cre recombinase protein expressed from the endogenous prominin-1 (CD133) promoter [22], thus targeting neural stem cells in the brain [23] expressing GFAP [24]. As such, optic nerves from Prom1-CreER x Rosa-GREEN mice injected with tamoxifen and progesterone at E15 contained EGFP+ cells that co-labeled with S100β and Sox2, but not Olig2, similar to that observed with GFAP-Cre x Rosa-GREEN mice (data not shown).
Based on these findings, we generated Nf1flox/mut; Prom1-CreER (FMPrC) mice for tamoxifen and progesterone injection at E15. At 3 months of age, FMPrC mice had increased optic nerve volumes, percentages of Iba1+ cells, and percentages of Ki67+ cells (Figure 5), similar to that observed with FMC mice. In addition, these mice had clear retinal pathology, with increased retinal cell apoptosis (%TUNEL+ cells), reduced retinal ganglion cell numbers (%Brn3a+ cells), and decreased retinal nerve fiber layer thickness (SMI-32 immunostaining). These results indicate that somatic Nf1 inactivation in neural progenitor/stem cells (GFAP+ or CD133+ cells) results in gliomagenesis at 3 months of age, whereas Nf1 loss in Olig2+cells generates tumors with a prolonged latency. While the cell lineage tracing experiments using Rosa-GREEN strains demonstrate that Olig2+ cells in the optic nerve do not arise from CD133+ or GFAP-Cre transgene-expressing cells at E15–16, future studies will be required to identify the specific subpopulations of progenitors cells capable of serving as the potential cells of origin for these tumors.
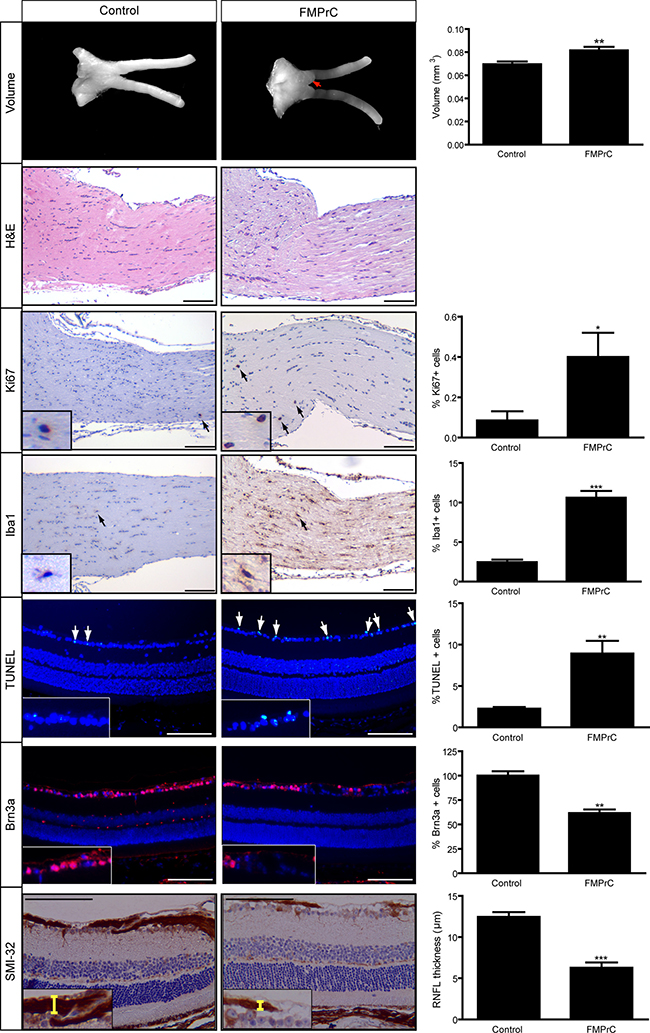
Figure 5: Somatic Nf1 loss in neural stem cells recapitulates the temporal course of optic gliomagenesis observed in FMC mice. FMPrC mice have larger optic nerve volumes relative to controls, as well as increased cellularity (hematoxylin/eosin) (n = 5 mice/group). 3-month-old FMPrC mice show increased percentages of Ki67+ and Iba1+ cells. There was also increased retinal cell apoptosis (%TUNEL+ cells), fewer Brn3a+ cells, and reduced RNFL thickness in FMPrC mice. Nuclei were counterstained with DAPI (blue). Representative images include insets of immunopositive cells (arrows). Scale bar, 100 μm. Error bars, mean ± SEM. ***p < 0.0003; **p = 0.0079; *p = 0.0429.
The impact of the cell of origin on the temporal course of gliomagenesis
Taken together with our previous studies showing that Nf1+/− mice with somatic Nf1 loss in NG2+ cells do not form optic gliomas [16], we now conclude that both neuroglial progenitor cells (GFAP+, BLBP+, CD133+ cells) and pre-OPCs (Olig2+, NG2neg cells) can serve as initiating cells for murine Nf1 low-grade glioma, but with different latencies to tumor formation [25]. As such, Nf1+/− mice with somatic Nf1 inactivation in GFAP-Cre+ [11], BLBP+ [15], or CD133+ neural stem cells all develop tumors by 3 months of age, whereas those with Nf1 inactivation in pre-OPCs form gliomas later. Since neither GFAP-Cre nor prominin-1-CreER mice treated with tamoxifen at E15 generate Olig2+ cells, yet all Cre driver lines give rise to GFAP+ and S100β+ macroglial cells, we propose that Olig2+ cells represent a glial precursor lineage distinct from those delineated by GFAP-Cre- or prominin-1-CreER-mediated somatic Nf1 loss. These findings suggest that there are multiple distinct cells of origin for glioma that each can generate astrocytes through unique differentiation pathways. Consistent with this hypothesis, whole-tumor RNA-sequencing analyses of FMC and FMOC optic gliomas demonstrates that these two brain tumors are molecularly-distinct entities [26].
While the studies herein are novel with respect to low-grade glioma, they join a growing body of evidence that suggests that the cell of origin is critical for creating the diversity of human cancers. As such, whereas luminal and basal cells can both serve as cells of origin for prostate cancer, each generates distinct subtypes with different histological and molecular features [27]. Similarly, CD133-negative luminal cells give rise to highly metastatic breast cancers, but CD133-positive luminal cells generate both basal and luminal tumors with little metastatic potential [28]. Finally, dorsal brainstem progenitor cells are the cells of origin for one subtype of medulloblastoma, while cerebellar granule precursors are responsible for a different subtype of this common pediatric brain tumor, each with different molecular properties [29]. Although these reports highlight the ways in which the cell of origin creates molecular tumor diversity, our findings demonstrate that histologically-similar tumors can be generated with different latencies based entirely on their progenitor cell origins. Future studies aimed at characterizing the different responsible progenitor cell populations may yield important insights into the diversity of cellular origins of pediatric glioma relevant to the clinical spectrum of OPGs encountered in children with NF1.
MATERIALS AND METHODS
Mice
Nf1+/− mice [30] were bred with Nf1f/wt mice to produce Nf1flox/mut mice, and intercrossed with Nf1flox/flox; Olig2-Cre mice to generate Nf1flox/mut; Olig2-Cre (FMOC) mice, while Nf1flox/mut; GFAP-Cre (FMC; [11]) and Nf1flox/flox [31] control mice were established as previously reported. Nf1flox/mut mice were also intercrossed with Nf1flox/flox; Prom1-CreER mice [22] to generate Nf1flox/mut; Prom1-CreER (FMPrC) mice. Timed-pregnant FMPrC dams (gestational day 14–16) underwent oral gavage with 1mg tamoxifen (Sigma-Aldrich, St. Louis, MO) and 1 mg progesterone (Sigma-Aldrich, St. Louis, MO) in 100μl of corn oil suspension. Olig2-Cre mice (B6-Olig2tm2 (TVA,cre)Rth/J; Jackson Laboratory; [20]) and GFAP-Cre mice [32] were intercrossed with Rosa-GREEN mice (B6.Cg-Gt(ROSA)26Sortm(CAGZsGreen1)Hze+/J; Jackson Laboratory) for cell fate mapping. Mice were backcrossed and maintained on a C57Bl/6 background and used in accordance with approved Animal Studies protocols. The recombination frequency of Olig2-Cre (11.11%; data not shown) and GFAP-Cre (13.36%; [16]) mice were determined following intercrossing with Rosa-GREEN mice.
Immunohistochemistry
Paraffin and frozen section immunohistochemical analyses were performed [33] using specific antibodies (Supplementary Table 1), followed by either Alexa-Fluor-tagged secondary antibodies (Invitrogen, Grand Island, NY) and DAPI counterstaining or biotinylated secondary antibodies and Vectastain Elite ABC development. Terminal deoxynucleotide transferase-mediated dUTP nick-end labeling (TUNEL) staining was performed as before [33].
Optic nerve measurements
Optic nerves with an intact chiasm were microdissected, photographed, and optic nerve volumes calculated [13].
Statistical analysis
Statistical analysis was performed as previously described [33].
Authors’ contributions
Conception and design: ACS, JAT, GAC, SMG, DYL, MHE, DHG Acquisition of data: ACS, JAT, YP, YM, GAC, SMG, DYL Analysis and interpretation of data: ACS, JAT, PJC, GAC, SMG, DHG Writing of the manuscript: ACS, DHG
ACKNOWLEDGMENTS
We appreciate the technical assistance of Courtney Corman and Vanessa Chu. The authors also gratefully acknowledge the valuable scientific discussions with Richard Gilbertson.
CONFLICTS OF INTEREST
The authors declare no conflicts of interest.
FINANCIAL SUPPORT
This work was supported by grants from the National Cancer Institute (U01-CA141549 to DHG and MHE) and Department of Defense (W81XWH-13–1-0094 to DHG, MHE). The Ophthalmology Core Facility is funded by a grant from the National Eye Institute (EY02687). J.A.T. was supported by funding from the Research Training Program in the Vision Sciences (5-T32-EY13360) and in Neurology (5-T32-NS007205–33), while Y. P. is supported by a McDonnell Foundation Institutional Fellowship Award.
REFERENCES
1. Horbinski C, Hamilton RL, Nikiforov Y, Pollack IF. Association of molecular alterations, including BRAF, with biology and outcome in pilocytic astrocytomas. Acta Neuropathol. 2010; 119:641–649.
2. Gutmann DH, McLellan MD, Hussain I, Wallis JW, Fulton LL, Fulton RS, Magrini V, Demeter R, Wylie T, Kandoth C, Leonard JR, Guha A, Miller CA, et al. Somatic neurofibromatosis type 1 (NF1) inactivation characterizes NF1-associated pilocytic astrocytoma. Genome Res. 2013; 23:431–439.
3. Wimmer K, Eckart M, Meyer-Puttlitz B, Fonatsch C, Pietsch T. Mutational and expression analysis of the NF1 gene argues against a role as tumor suppressor in sporadic pilocytic astrocytomas. J Neuropathol Exp Neurol. 2002; 61:896–902.
4. Kluwe L, Hagel C, Tatagiba M, Thomas S, Stavrou D, Ostertag H, von Deimling A, Mautner VF. Loss of NF1 alleles distinguish sporadic from NF1-associated pilocytic astrocytomas. J Neuropathol Exp Neurol. 2001; 60:917–920.
5. Otero JJ, Rowitch D, Vandenberg S. OLIG2 is differentially expressed in pediatric astrocytic and in ependymal neoplasms. J Neurooncol. 2011; 104:423–438.
6. Listernick R, Charrow J, Greenwald M. Emergence of optic pathway gliomas in children with neurofibromatosis type 1 after normal neuroimaging results. J Pediatr. 1992; 121:584–587.
7. Listernick R, Ferner RE, Piersall L, Sharif S, Gutmann DH, Charrow J. Late-onset optic pathway tumors in children with neurofibromatosis 1. Neurology. 2004; 63:1944–1946.
8. Balcer LJ, Liu GT, Heller G, Bilaniuk L, Volpe NJ, Galetta SL, Molloy PT, Phillips PC, Janss AJ, Vaughn S, Maguire MG. Visual loss in children with neurofibromatosis type 1 and optic pathway gliomas: relation to tumor location by magnetic resonance imaging. Am J Ophthalmol. 2001; 131:442–445.
9. Habiby R, Silverman B, Listernick R, Charrow J. Precocious puberty in children with neurofibromatosis type 1. J Pediatr. 1995; 126:364–367.
10. Toonen JA, Anastasaki C, Smithson LJ, Gianino SM, Li K, Kesterson RA, Gutmann DH. NF1 germline mutation differentially dictates optic glioma formation and growth in neurofibromatosis-1. Hum Mol Genet. 2016; 25:1703–1713.
11. Bajenaru ML, Hernandez MR, Perry A, Zhu Y, Parada LF, Garbow JR, Gutmann DH. Optic nerve glioma in mice requires astrocyte Nf1 gene inactivation and Nf1 brain heterozygosity. Cancer Res. 2003; 63:8573–8577.
12. Dasgupta B, Yi Y, Chen DY, Weber JD, Gutmann DH. Proteomic analysis reveals hyperactivation of the mammalian target of rapamycin pathway in neurofibromatosis 1-associated human and mouse brain tumors. Cancer Res. 2005; 65:2755–2760.
13. Hegedus B, Banerjee D, Yeh TH, Rothermich S, Perry A, Rubin JB, Garbow JR, Gutmann DH. Preclinical cancer therapy in a mouse model of neurofibromatosis-1 optic glioma. Cancer Res. 2008; 68:1520–1528.
14. Kaul A, Toonen JA, Cimino PJ, Gianino SM, Gutmann DH. Akt- or MEK-mediated mTOR inhibition suppresses Nf1 optic glioma growth. Neuro Oncol. 2015; 17:843–853.
15. Hegedus B, Dasgupta B, Shin JE, Emnett RJ, Hart-Mahon EK, Elghazi L, Bernal-Mizrachi E, Gutmann DH. Neurofibromatosis-1 regulates neuronal and glial cell differentiation from neuroglial progenitors in vivo by both cAMP- and Ras-dependent mechanisms. Cell Stem Cell. 2007; 1:443–457.
16. Solga AC, Gianino SM, Gutmann DH. NG2-cells are not the cell of origin for murine neurofibromatosis-1 (Nf1) optic glioma. Oncogene. 2014; 33:289–299.
17. Lee da Y, Gianino SM, Gutmann DH. Innate neural stem cell heterogeneity determines the patterning of glioma formation in children. Cancer Cell. 2012; 22:131–138.
18. Tchoghandjian A, Fernandez C, Colin C, El Ayachi I, Voutsinos-Porche B, Fina F, Scavarda D, Piercecchi-Marti MD, Intagliata D, Ouafik L, Fraslon-Vanhulle C, Figarella-Branger D. Pilocytic astrocytoma of the optic pathway: a tumour deriving from radial glia cells with a specific gene signature. Brain. 2009; 132:1523–1535.
19. Liu C, Sage JC, Miller MR, Verhaak RG, Hippenmeyer S, Vogel H, Foreman O, Bronson RT, Nishiyama A, Luo L, Zong H. Mosaic analysis with double markers reveals tumor cell of origin in glioma. Cell. 2011; 146:209–221.
20. Schuller U, Heine VM, Mao J, Kho AT, Dillon AK, Han YG, Huillard E, Sun T, Ligon AH, Qian Y, Ma Q, Alvarez-Buylla A, McMahon AP, et al. Acquisition of granule neuron precursor identity is a critical determinant of progenitor cell competence to form Shh-induced medulloblastoma. Cancer Cell. 2008; 14:123–134.
21. Mayes DA, Rizvi TA, Titus-Mitchell H, Oberst R, Ciraolo GM, Vorhees CV, Robinson AP, Miller SD, Cancelas JA, Stemmer-Rachamimov AO, Ratner N. Nf1 loss and Ras hyperactivation in oligodendrocytes induce NOS-driven defects in myelin and vasculature. Cell Rep. 2013; 4:1197–1212.
22. Zhu L, Gibson P, Currle DS, Tong Y, Richardson RJ, Bayazitov IT, Poppleton H, Zakharenko S, Ellison DW, Gilbertson RJ. Prominin 1 marks intestinal stem cells that are susceptible to neoplastic transformation. Nature. 2009; 457:603–607.
23. Nishide K, Nakatani Y, Kiyonari H, Kondo T. Glioblastoma formation from cell population depleted of Prominin1-expressing cells. PLoS One. 2009; 4:e6869.
24. Beckervordersandforth R, Deshpande A, Schaffner I, Huttner HB, Lepier A, Lie DC, Gotz M. In vivo targeting of adult neural stem cells in the dentate gyrus by a split-cre approach. Stem Cell Reports. 2014; 2:153–162.
25. Menn B, Garcia-Verdugo JM, Yaschine C, Gonzalez-Perez O, Rowitch D, Alvarez-Buylla A. Origin of oligodendrocytes in the subventricular zone of the adult brain. J Neurosci. 2006; 26:7907–7918.
26. Pan Y, Bush EC, Toonen JA, Ma Y, Solga AC, Sims PA, Gutmann DH. Whole tumor RNA-sequencing and deconvolution reveal a clinically-prognostic PTEN/PI3K-regulated glioma transcriptional signature. Oncotarget. 2017 Apr 18. doi: 10.18632/oncotarget.17193. [Epub ahead of print].
27. Park JW, Lee JK, Phillips JW, Huang P, Cheng D, Huang J, Witte ON. Prostate epithelial cell of origin determines cancer differentiation state in an organoid transformation assay. Proc Natl Acad Sci USA. 2016; 113:4482–4487.
28. Drobysheva D, Smith BA, McDowell M, Guillen KP, Ekiz HA, Welm BE. Transformation of enriched mammary cell populations with polyomavirus middle T antigen influences tumor subtype and metastatic potential. Breast Cancer Res. 2015; 17:132.
29. Gibson P, Tong Y, Robinson G, Thompson MC, Currle DS, Eden C, Kranenburg TA, Hogg T, Poppleton H, Martin J, Finkelstein D, Pounds S, Weiss A, et al. Subtypes of medulloblastoma have distinct developmental origins. Nature. 2010; 468:1095–1099.
30. Brannan CI, Perkins AS, Vogel KS, Ratner N, Nordlund ML, Reid SW, Buchberg AM, Jenkins NA, Parada LF, Copeland NG. Targeted disruption of the neurofibromatosis type-1 gene leads to developmental abnormalities in heart and various neural crest-derived tissues. Genes Dev. 1994; 8:1019–1029.
31. Zhu Y, Romero MI, Ghosh P, Ye Z, Charnay P, Rushing EJ, Marth JD, Parada LF. Ablation of NF1 function in neurons induces abnormal development of cerebral cortex and reactive gliosis in the brain. Genes Dev. 2001; 15:859–876.
32. Bajenaru ML, Zhu Y, Hedrick NM, Donahoe J, Parada LF, Gutmann DH. Astrocyte-specific inactivation of the neurofibromatosis 1 gene (NF1) is insufficient for astrocytoma formation. Mol Cell Biol. 2002; 22:5100–5113.
33. Solga AC, Pong WW, Kim KY, Cimino PJ, Toonen JA, Walker J, Wylie T, Magrini V, Griffith M, Griffith OL, Ly A, Ellisman MH, Mardis ER, Gutmann DH. RNA Sequencing of Tumor-Associated Microglia Reveals Ccl5 as a Stromal Chemokine Critical for Neurofibromatosis-1 Glioma Growth. Neoplasia. 2015; 17:776–788.