
INTRODUCTION
Approximately 95% of pancreatic cancers are pancreatic ductal adenocarcinoma (PDAC). The average 5-year survival rate is only 8% [1]. Reasons for the dismal survival include an aggressive disease course, low rate of early diagnosis, and limited understanding of the disease etiology. Several lines of evidence suggest that diabetes plays a critical role in the pathogenesis of PDAC. Elevated insulin level is frequently observed in type 2 diabetes, which makes up ~90% of cases of diabetes. Given that insulin is a powerful mitogen, a sustained increase of insulin may confer growth advantages upon pancreatic cells [2]. It is therefore imperative to investigate the effects of insulin on pancreatic cancer progression.
Transgelin-2, encoded by TAGLN2 gene, is an actin stress fiber-associated protein that has roles in cell transformation and cell morphology. Several proteomic studies have suggested that transgelin-2 is a potential biomarker of tumorigenesis. Transgelin-2 is overexpressed in colorectal cancer, renal cell carcinoma and uterine cervical squamous cell carcinoma [3–5]. In contrast, some reports indicate that transgelin-2 is downregulated in lung adenocarcinoma and breast cancer [6, 7]. Through regulating cytoskeletal dynamics, transgelin-2 also participates in cancer metastasis [8]. These studies have established the connection between transgelin-2 and cancer. Both oncogenic and tumor suppressive effects of transgelin-2 have been observed depending on the types of tissues investigated. However, with regard to PDAC, the expression pattern and functional role of transgelin-2 have not been determined.
Sterol regulatory element-binding proteins (SREBPs) are master regulators of genes for central rate-limiting enzymes of lipid and cholesterol metabolism. SREBP transcription factors regulate several enzymes including fatty acid synthase (FASN), acetyl-CoA carboxylase (ACC), stearoyl-CoA desaturase (SCD)-1, ATP citrate lyase (ACLY) and acyl-CoA synthetase (ACS)-2 [9, 10]. Mammalian SREBPs are encoded by the genes SREBF1 and SREBF2, which are mainly involved in lipid and cholesterol metabolism, respectively. SREBP-1 knockdown decreases the cell and organ size of flies, indicating that it is essential for cell growth [11]. Pharmacological inhibition of SREBP-1 significantly induces cancer cell death [12].
The goal of this study was to characterize the expression pattern of transgelin-2 in PDAC and subsequently unravel the underlying mechanisms involved in dysregulation of transgelin-2. Our data indicated that transgelin-2 was highly expressed in PDAC tissues compared with adjacent normal tissues. Transgelin-2 was predominantly overexpressed in a subgroup of PDAC patients with diabetes. In vitro analysis indicated that insulin was a driving factor for expression of transgelin-2 via SREBP-1 transcription factor. These data imply that transgelin-2 is involved in progression of PDAC patients with concomitant diabetes. Diabetes is a key risk factor of PDAC, therefore, understanding the underlying mechanisms involved in diabetes-associated PDAC is important in providing novel biomarkers or therapeutic targets for this type of malignancy.
RESULTS
Upregulated transgelin-2 is an indicator of poor prognosis of PDAC
To analyze the role of transgelin-2 in PDAC, we examined its protein level by immunohistochemical staining in a sample of 70 paired PDAC and adjacent normal tissues. Characteristics of the 70 PDAC cases are shown in Table 1. Immunostaining of transgelin-2 was mainly distributed in the cytoplasm, as shown by the representative images of IHC staining for transgelin2 (Figure 1A). The intensity of immunostaining for transgelin-2 was much stronger in PDAC tissues, while the adjacent normal tissues displayed negative or weak staining (Figure 1B). Semi-quantitative immunohistochemical analysis indicated that transgelin-2 was highly expressed in 71% of PDAC tissues and 30% of adjacent normal tissues. The level of transgelin-2 was significantly higher in PDAC tissues compared with normal tissues (p=3.647×10⁻⁸, Figure 1B). Furthermore, Pei’s dataset (p=2.35×10⁻¹⁰), Logsdon’s dataset (p=1.71×10⁻⁵) and Badea’s dataset (p=1.36×10⁻⁹) consistently showed that transgelin-2 expression was significantly higher in pancreatic tissues than normal tissues (Figure 1D) [13–15]. Using a Cox proportional hazard regression model, high levels of transgelin-2 were associated with poor survival of PDAC patients (hazard ratio=2.30, 95% confidence interval: 1.07–4.97, p<0.05). The median overall survival was significantly lower in patients with high transgelin-2 expression (Figure 1C).
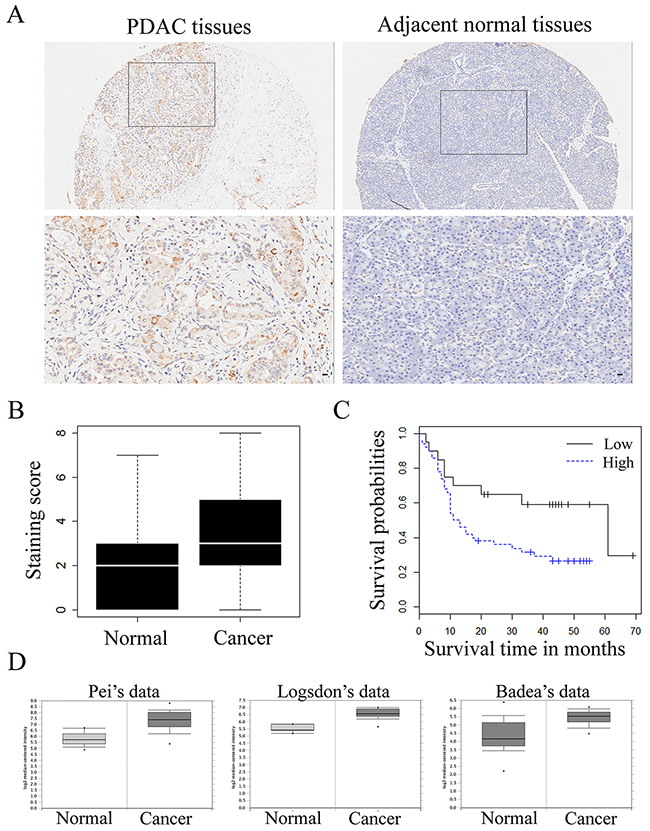
Figure 1: Transgelin-2 expression in PDAC and adjacent normal tissues. (A) Representative pictures of transgelin-2 immunostaining in PDAC (left) and adjacent normal (right) tissues. Location of the high magnification regions (upper panels) is indicated by the rectangles in the upper panels. Magnified images of cells counterstained with transgelin-2 antibody are shown in lower panel. Scale bar, 100 μm. (B) Mean staining score of transgelin-2 in PDAC tissues compared with and adjacent normal tissues. (C) Overall survival as a function of transgelin-2 expression. High levels of transgelin-2 was labeled as blue, while low levels of transgelin-2 was labeled as black. Analysis of statistical significance was performed using the long-rank test. (D) Transgelin-2 level in pancreatic cancer tissues and corresponding normal tissues in Pei’s dataset (p<0.01), Logsdon’s dataset (p<0.01) and Badea’s dataset (p<0.01).
Table 1: Correlation between transgelin-2 level and clinicopathological parameters of patients with PDAC
Characteristics |
All cases |
Transgelin-2 |
p value |
|
|---|---|---|---|---|
Low |
High |
|||
Total participants |
70 |
20 |
50 |
|
Age (yr) |
||||
<60 |
27 |
5 |
22 |
0.229 |
≥60 |
43 |
15 |
28 |
|
Gender |
||||
Female |
23 |
5 |
18 |
0.546 |
Male |
47 |
15 |
32 |
|
Histological grade |
||||
Well |
4 |
3 |
1 |
0.043 |
Moderately |
50 |
15 |
35 |
|
Poorly |
16 |
2 |
14 |
|
Tumor stage |
||||
1A |
3 |
2 |
1 |
0.051 |
1B |
25 |
10 |
15 |
|
2A |
7 |
2 |
5 |
|
2B |
34 |
5 |
29 |
|
4 |
1 |
1 |
0 |
|
Primary tumor |
||||
T1 |
4 |
2 |
2 |
0.591 |
T2 |
53 |
14 |
39 |
|
T3 |
13 |
4 |
9 |
|
Lymph node metastasis |
||||
Negative |
36 |
15 |
21 |
0.027 |
Positive |
34 |
5 |
29 |
|
Tumor size |
||||
≤2 cm |
23 |
11 |
12 |
0.027 |
>2 cm |
47 |
9 |
38 |
|
Diabetes |
||||
Without |
29 |
13 |
16 |
0.024 |
With |
41 |
7 |
34 |
|
The clinicopathological characteristics of PDAC stratified by the extent of transgelin-2 expression are summarized in Table 1. The level of transgelin-2 was significantly associated with lymph node metastasis, histological grade, and tumor stage and size. However, there was no correlation with patient age, gender and primary tumor. PDAC patients with diabetes showed high expression of transgelin-2 compared with those without diabetes. Among these factors, histological grade (odds ratio [OR] =5.293, p=0.030), tumor size (OR=5.357, p=0.017) and diabetes (OR=4.623, p=0.020) were proven to be independent predictors of high transgelin-2 expression by multivariate logistic regression analysis (Table 2). These results prompted us to investigate the role of transgelin-2 in diabetes-associated PDAC.
Table 2: Factors correlated to transgelin-2 levels by multivariate logistic analysis
Factor |
Odds ratio |
p value |
|---|---|---|
Histologic grade |
5.293 |
0.030 |
Lymph node metastasis |
2.087 |
0.274 |
Tumor size |
5.357 |
0.017 |
Diabetes |
4.623 |
0.020 |
Insulin increases expression of transgelin-2 in PDAC cells
Type 2 diabetes is characterized by high levels of insulin, which are presumed to be a driving factor of diabetes-associated cancer [16, 17]. Thus, we hypothesized that insulin might be involved in regulation of transgelin-2 in PDAC. To test this hypothesis, PANC-1 cells were treated with insulin for 24 h. Insulin treatment resulted in an increase in transgelin-2 mRNA level in a dose-dependent manner (Figure 2A). Similar to PANC-1, PDAC cell lines AsPC-1, BxPC-3 and SW-1990 also exhibited upregulation of transgelin-2 upon insulin treatment (Figure 2B–2D). Insulin treatment for 24 h resulted in marked accumulation of transgelin-2 protein (Figure 2E). The insulin signaling pathway, as indicated by AKT phosphorylation (S473), was consistently activated by insulin treatment in PANC1 cells (Figure 2E) [18]. We studied the expression profile of transgelin-2 in both db/db and ob/ob mouse type 2 diabetes model, which display a hyperinsulinemia phenotype [19]. Transgelin-2 was significantly up-regulated in pancreatic tissues from both db/db (Figure 2F) and ob/ob (Figure 2G) mice. These in vitro and in vivo data suggest that expression of transgelin-2 is under-regulated by insulin. Insulin and insulin-like growth factor (IGF)-1 have affinity for insulin and IGF-1 receptors because of similar structural homology [20]. Thus, we also checked the levels of transgelin-2 upon IGF-1 treatment. IGF-1 also increased the levels of transgelin-2 in PANC1 cells (Figure 2H). This suggests that downstream effectors of insulin or IGF-1 mediate increased transgelin-2 expression in PDAC cells.
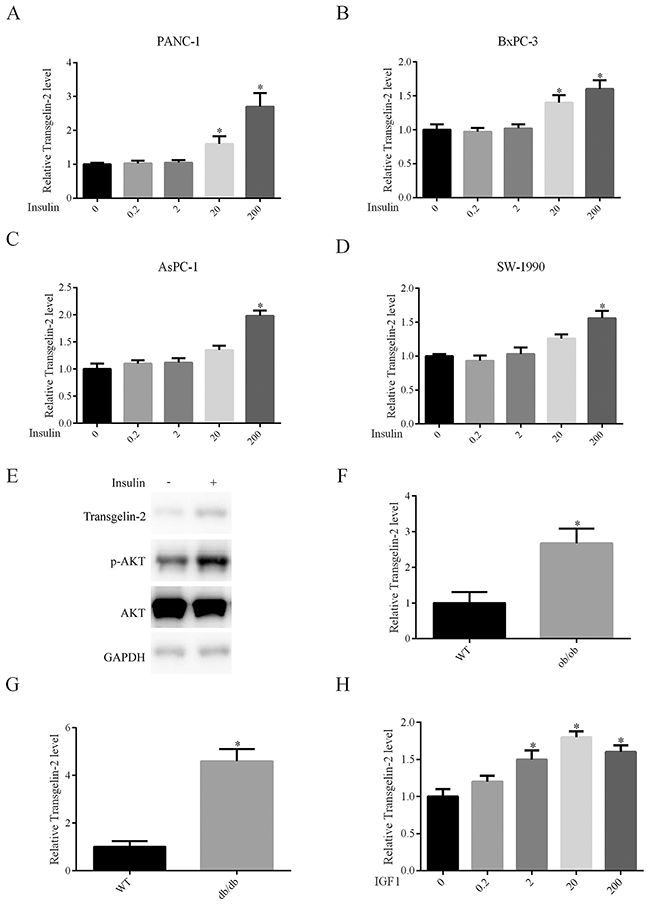
Figure 2: Impact of insulin on transgelin-2 expression. PANC-1 (A), BxPC-3 (B), AsPC-1 (C) and SW-1990 (D) cells were treated with insulin at dose 0, 0.2, 2, 20 and 200 nM for 24 h, respectively. Transgelin-2 was detected by quantitative PCR. The relative transgelin-2 level was quantified by 2−ΔΔCT method, with GAPDH as a reference gene. (E) PANC-1 cells were treated with 200 nM insulin for 24 h. Transgelin-2 level, AKT level and AKT S473 phosphorylation were analyzed by western blotting. Quantitative PCR analysis of transgelin-2 mRNA in pancreatic tissues from ob/ob (F) or db/db (G) mice demonstrating increased transgelin-2 in type 2 diabetes models. (H) Quantitative PCR analysis displaying increased transgelin-2 mRNA by IGF-1 in a dose-dependent manner. In all cases, data are represented as mean±SD of three independent experiments.
Transgelin-2 is required for insulin-induced proliferation of PDAC cells
To elucidate the oncogenic role of transgelin-2 in PDAC, cell proliferation was analyzed when transgelin-2 was silenced in PDAC cells. Of the three specific siRNAs against transgelin-2, transgelin2-siRNA-2 displayed the most significant knockdown effect (Figure 3A). The protein level of transgelin-2 was also decreased by transgelin2-siRNA-2, while transgelin level, a homolog of transgelin-2, was unaffected by this siRNA (Figure 3B). Therefore, transgelin2-siRNA-2 was used as a specific siRNA against transgelin-2 in the subsequent experiments. In a panel of PDAC cells, transgelin-2 but not transgelin was decreased by this siRNA (Figure 3C and 3D). Transgelin-2 knockdown decreased proliferation of PANC-1 cells (Figure 3E). Similarly, the growth of BxPC-3 and AsPC-1 cells was reduced by transgelin-2 knockdown (Figure 3F and 3G). There was no significant inhibitory effect of transgelin-2 knockdown on growth of SW1990 cells (Figure 3H). This suggests that transgelin-2 may have distinct roles with different genetic backgrounds. More importantly, transgelin-2 knockdown inhibited proliferation of PANC-1 cells when they were treated with insulin (Figure 3I). The colony-forming ability induced by insulin was blunted by transgelin-2 knockdown in PANC1 cells (Figure 3J). These data suggest that oncogenic effects of insulin are likely due to the increase of transgelin-2 in PDAC.
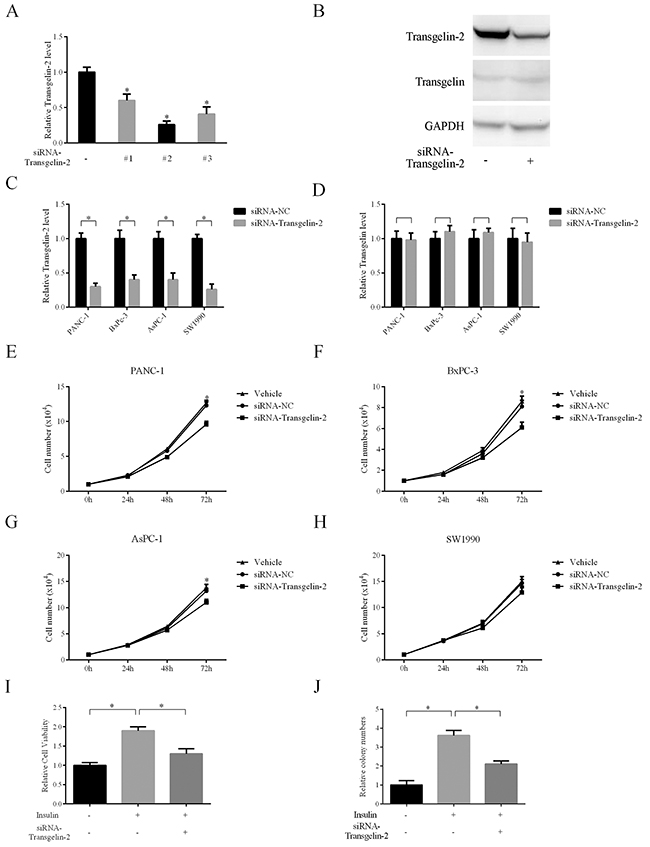
Figure 3: Impact of transgelin-2 depletion on proliferation of PDAC cells. (A) Three specific siRNAs against transgelin-2 were transfected into PANC-1 cells for 48 h. The knockdown efficiency was analyzed by quantitative PCR. (B) Western blot analysis of transgelin-2 or transgelin protein level in PANC-1 cells after transfection for 48 h. PDAC cell lines (PANC-1, AsPC-1, BxPC-3 and SW-1990) were transfected by specific siRNAs against transgelin-2 for 48 h. Transgelin-2 (C) or transgelin (D) mRNA level was analyzed by quantitative PCR. Cell proliferation was analyzed in PANC-1 (E), AsPC-1 (F), BxPC-3 (G) and SW-1990 (H) cell lines treated with non-silencing siRNA (siRNA-NC) or specific siRNA against transgelin-2. Vehicle group indicates cells treated with transfection reagent alone. (I) Relative cell viability was analyzed in PANC-1 cells treated with siRNA against transgelin-2 in the presence or absence of insulin. (J) Colony formation was performed in PANC-1 cells with siRNA against transgelin-2 in the presence or absence of insulin. In all cases, data are represented as mean±SD of three independent experiments.
SREBP-1 mediates increase of transgelin-2 expression induced by insulin
Since the expression of transgelin-2 is induced by insulin, we explored whether the insulin-related transcription factor is responsible for the increase of transgelin-2 in PDAC. Using the JASPAR database [21], we scanned 5 kb prior to the human TAGLN2 transcription start site at an 85% profile score threshold. A putative SRE site for SREBP-1 transcription factor was found at −2562/−2552 bp on the human TAGLN2 promoter (Figure 4A). To study the responsiveness of the putative SRE site upon SREBP-1 knockdown, we constructed a series of reporter vectors containing fragments of transgelin-2 promoter. Endogenous SREBP-1 was downregulated by siRNA against srebf1 gene in HEK293T cells (Figure 4B). Analysis of promoter fragments indicated that the putative SREBP-1 binding site was present at approximatively from −2000 to −5000 bp on TAGLN2 promoter, in line with our in silico assay (Figure 4C). To ascertain the functionality of the putative SRE site on TAGLN2 gene, luciferase reporter vectors containing wild-type or mutant SRE sequences were transfected into HEK293T cells. Luciferase assay showed that the wild-type but not mutant luciferase activity was responsive upon SREBP-1 knockdown (Figure 4D). Conversely, overexpression of SREBP-1 significantly increased the firefly luciferase activity of wild-type but not mutant transgelin-2 luciferase reporter (Figure 4E). TAGLN2 gene regulatory elements at −2562/−2552 bp were enriched for SREBP-1 antibody when compared with an IgG-negative control, suggesting that this locus is a potential SREBP-1 target (Figure 4F). Our data support a notion that TAGLN2 is a novel target gene of the SREBP-1 transcription factor. In addition, SREBP-1 knockdown blunted the increase of transgelin-2 expression induced by insulin in PANC-1 cells (Figure 4G). SREBP-1 was consistently induced by insulin, whereas the specific siRNA downregulated its level (Figure 4H). These results indicate that SREBP-1 is involved in activating transgelin-2 transcription upon insulin stimulation. Moreover, transgelin-2 partially rescued the growth defect of pancreatic cancer cells caused by SREBP-1 knockdown, suggesting that transgelin-2 is required for SREBP-1-mediated cell growth upon insulin treatment (Figure 4I).
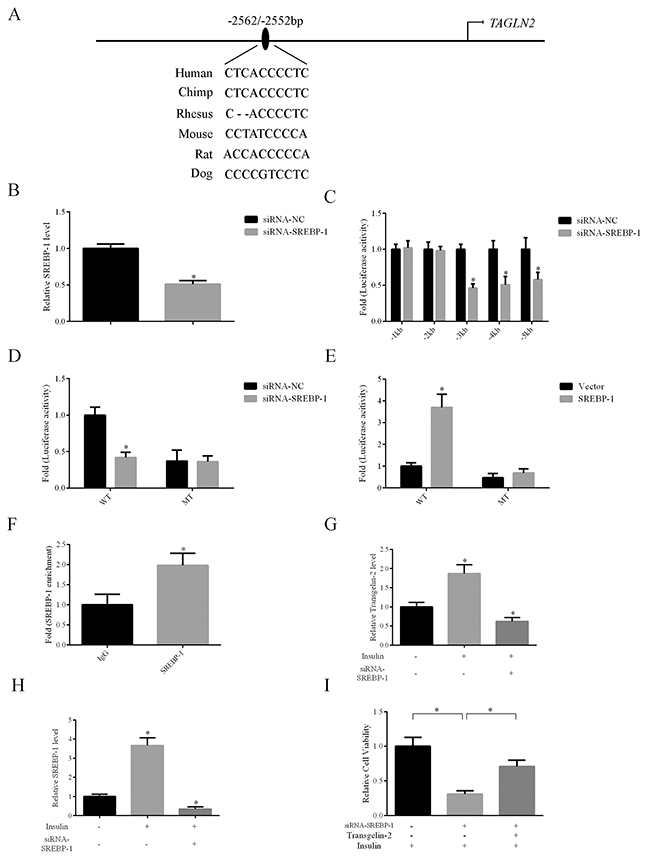
Figure 4: Transgelin-2 is a target gene of SREBP-1. (A) Schematic diagram of promoter region of the human TALGN2 gene. A putative SRE site is located at −2562/−2552 bp. (B) Validation of SREBP-1 knockdown efficiency using quantitative PCR. (C) Luciferase activity assay of transgelin-2 reporter containing different fragments spanning the promoter region, indicating that the SRE sequence was located between 1 and 5 kb. (D) HEK293T cells were co-transfected by non-silencing siRNA (siRNA-NC) or siRNA against SREBP-1 (siRNA-SREBP-1) with wild-type (WT) or mutant (MT) transgelin-2 firefly luciferase reporter for 24 h. Luciferase activity was measured. The fold of luciferase activity was calculated by normalization of the firefly luciferase activity by the transfection containing reporter plasmids and the siRNA-NC. (E) HEK293T cells were co-transfected by vector or SREBP-1 with wild-type (WT) or mutant (MT) transgelin-2 firefly luciferase reporter for 24 h. The fold of luciferase activity was calculated by normalization of the firefly luciferase activity by the transfection containing reporter plasmids and the siRNA-NC. (F) ChIP analysis using SREBP-1 antibody demonstrated SREBP-1 association with SRE sequence within transgelin-2 promoter. (G) Quantitative PCR analysis of transgelin-2 mRNA in PANC-1 cells treated with or without 200 nM insulin for 24 h. (H) Quantitative PCR analysis of SREBP-1 mRNA in PANC-1 cells treated with or without 200 nM insulin for 24 h. (I) Proliferation was analyzed in PANC-1 cell lines transfected by siRNA-SREBP-1 (siRNA-NC as a control) with or without transgelin-2 in the presence of insulin. In all cases, data are represented as mean±SD of three independent experiments.
Transgelin-2 and SREBP-1 are correlated in diabetes-associated PDAC tissues
We investigated whether transgelin-2 and SREBP-1 were correlated in diabetes-associated PDAC. SREBP-1 expression was also analyzed by immunohistochemistry in tissues from PDAC patients, as described previously (Table 1). The staining for transgelin-2 or SREBP-1 was quantitated according to staining intensity and percentage of positive cells. Spearman statistical analysis was performed to assess the relationship between transgelin-2 and SREBP-1. Transgelin-2 was highly correlated with SREBP-1 in PDAC tissues (Spearman’s correlation coefficient: 0.617, p<0.001) (Figure 5A). Concomitant with the high SREBP-1 expression, we noted an increase in transgelin-2 expression (Figure 5B). According to diabetic status, we stratified PDAC patients into two groups. PDAC tissues showed high expression of transgelin-2 and SREBP-1, which were mainly distributed in patients with diabetes (Table 3). The χ2 test demonstrated that the levels of transgelin-2 and SREBP-1 were correlated in PDAC patients with diabetes compared to those without diabetes. These data suggest that the insulin/SREBP-1/transgelin-2 signaling axis is involved in diabetes-associated PDAC.
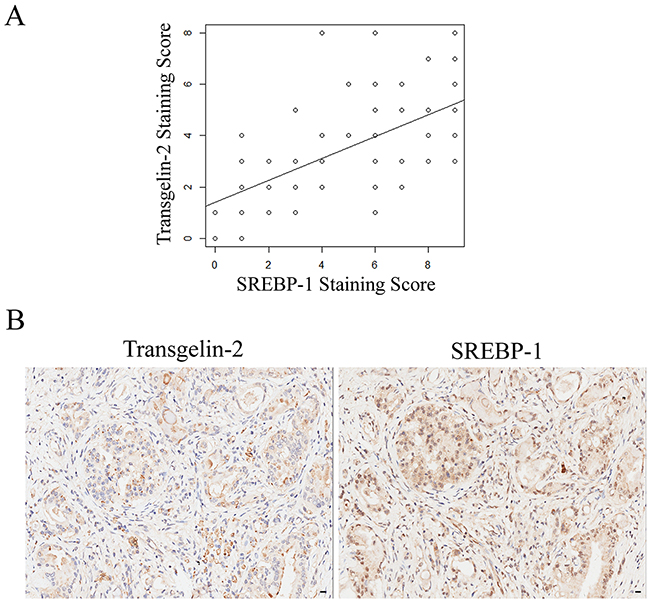
Figure 5: Correlation between transgelin-2 and SREBP-1. (A) Scatter plot between transgelin-2 and SREBP-1 staining scores in a sample of PDAC patients. The correlation analysis was calculated using Spearman statistical analysis (Spearman’s correlation coefficient: 0.617, p<0.001). R2 is 0.3807. (B) Representative photomicrographs of transgelin-2 (left) and SREBP-1 (right) staining in PDAC tissues from the same patient.
Table 3: Correlation between transgelin-2 and SREBP-1 as stratified by diabetic status in PDAC patients.
Without diabetes |
With diabetes |
||||||
|---|---|---|---|---|---|---|---|
Transgelin-2 |
p value |
Transgelin-2 |
p value |
||||
Low |
High |
Low |
High |
||||
SREBP-1 |
Low |
10 |
6 |
0.081 |
6 |
1 |
<0.001 |
High |
3 |
10 |
1 |
33 |
|||
DISCUSSION
Diabetes is typically divided into type 1 and type 2. Type 2 diabetes mellitus (T2DM) comprises >90% of all cases of diabetes. T2DM consists of an array of dysfunctions characterized by hyperglycemia, which results from insulin resistance, inadequate insulin secretion, and excessive glucagon secretion. Epidemiological studies clearly indicate that diabetes (predominantly T2DM) is a risk factor for liver, pancreatic and endometrial cancer. Nearly half of PDAC patients have diabetes at the time of diagnosis. Here, we found that transgelin-2 is dominantly expressed in PDAC patients with diabetes, which suggests that transgelin-2 is involved in progression of diabetes-associated PDAC. A homolog of transgelin-2, transgelin, is also highly expressed in PDAC patients with diabetes [22]. We presume that transgelin-2 and its homolog are extensively involved in promoting diabetes-associated PDAC. In this study, we focused on transgelin-2 to decipher the underlying mechanisms that mediate its upregulation in diabetes-associated PDAC.
It remains unclear whether the association between PDAC and T2DM is direct or indirect [23]. The direct effect is probably due to hyperglycemia, hyperinsulinemia and insulin resistance. Insulin is produced by pancreatic β cells. In the case of T2DM, pancreatic cells are persistently exposed to high concentrations of endogenous insulin, which provides a hospitable environment for tumorigenesis [24]. Insulin is a growth-promoting hormone with mitogenic effects. PDAC cells commonly overexpress insulin and IGF-1 receptors, which play a key role in cell growth and differentiation. Hyperinsulinemia is viewed as an independent risk factor of PDAC [25]. Therefore, the casual nature of the association between diabetes and PDAC is largely due to hyperinsulinemia [26]. The molecular mechanism of hyperinsulinemia-related proliferation and tumorigenesis has not been fully elucidated. In the present study, our data indicate that transgelin-2 is induced by insulin in PDAC cells, and the effect of insulin on the growth of PDAC cells is dependent on transgelin-2. These data suggest that induction of transgelin-2 by insulin participates in the development of diabetes-associated PDAC. Thus, blocking transgelin-2 expression is a potential therapeutic strategy to treat PDAC occurring concomitantly with diabetes. It also raises an interesting question about the role of transgelin-2 in initiating tumorigenesis in diabetes-associated PDAC. In the present study, the association of transgelin-2 expression with diabetic status in normal tissues was unknown. It would be worthwhile to analyze transgelin-2 levels in normal pancreatic tissues prior to malignant transformation in a future study.
Multiple signaling pathways are activated after insulin and IGF-1 interacts with their receptors. Several studies have demonstrated that the PI3K/AKT and RAS/MEK/ERK pathways are extensively stimulated by insulin in PDAC cells. Once activated, these signaling pathways stimulate multiple cancer phenotypes, including proliferation, invasion and metastasis. Besides the direct effects of insulin on PDAC cells, insulin can increase the level of IGF-1 via decreasing the hepatic production of IGF binding proteins [27]. It is well established that transcriptional activity of SREBP-1 is induced by insulin signaling [28]. Upon insulin stimulation, SREBP-1 is transported to the Golgi apparatus where it is cleaved by S1P and S2P proteases and then shuttled to the nucleus to induce expression of target genes. SREBP-1 target genes including FASN, SCD1 and ACLY are mainly involved in lipid biosynthesis. We have previously identified that regulation of SREBP-1 activity by cyclin-dependent kinase 8 and its partner cyclin C is involved in insulin-induced triglyceride synthesis [9]. Here, we found that transgelin-2 is a novel target gene of SREBP-1 transcription factor in response to insulin stimulation. In diabetes-associated PDAC, hyperinsulinemia promotes the maturation and transcriptional activity of SREBP-1, which leads to an increase of transgelin-2. Thus, PDAC tissues from patients with diabetes display a high level of transgelin-2. The axis of insulin/SREBP-1/transgelin-2 links the association between diabetes and PDAC, suggesting that this signaling pathway represents new therapeutic targets and molecular markers for this subgroup of PDAC. Further studies are also required to analyze the biological function of transgelin-2 in diabetes-associated PDAC.
Several studies have demonstrated that the level of transgelin-2 is associated with prognosis in various cancers. Transgelin-2 has been linked to lymph node metastasis, advanced clinical stage, and survival of cancer patients. In the present study, lymph node metastasis, histological grade, and tumor stage and size were closely related to the level of transgelin-2 in PDAC. Upregulation of transgelin-2 predicts poor survival of patients with PDAC, and demonstrates that transgelin-2 is involved in cancer progression. Transgelin-2 may be a useful biomarker for diagnosis or evaluation in PDAC. Leptin-deficient ob/ob and leptin-receptor-deficient db/db mice are widely used for T2DM research. Hyperinsulinemia is a common characteristic of these two models. Of note, transgelin-2 transcription is also activated in mouse diabetic models. The expression pattern of transgelin-2 is unable to distinguish between diabetes and PDAC.
Perhaps because of its abundance, transgelin-2 has been frequently identified in proteomic profiling studies of cancer [29]. The underlying mechanisms of transgelin-2 in cancer behavior is involved in interacting with specific proteins. For example, transgelin-2 regulates metastasis via directly interacting with actin and changing cell motility. In other cases, transgelin-2 influences signaling pathways through association with cancer-related proteins. It is worth further exploring the detailed molecular mechanisms of transgelin-2 in tumorigenesis and progression of cancer. Several studies have demonstrated that transgelin-2 is dysregulated in various types of cancer. However, until now, its transcriptional regulation remained unstudied. The present study indicated that SREBP-1 is responsible for transcription of transgelin-2 upon insulin treatment in PDAC cells. Luciferase reporter and chromatin immunoprecipitation (ChIP) analysis have shown that transgelin-2 is a novel target of SREBP-1, which is induced by insulin. These data explain why transgelin-2 is upregulated in diabetes-associated cancer.
MATERIALS AND METHODS
Patients and tissue specimens
This work was done with the approval of the Ethics Committee of Zhongshan Hospital, and informed consent was obtained from all patients. Formalin-fixed paraffin-embedded tissue blocks containing 70 PDAC and 70 adjacent tumor-free tissues were subjected to immunostaining. All of the patients underwent pancreatectomy between September 2004 and March 2009. There were 38 male and 22 female patients. The median follow-up was 16 months (range, 0–69 months), and 45 of 70 patients died during follow-up. Patients who did not reach the outcome under study were censored at the date of their last visit. For the analyses of overall survival, each patient’s time began on the date of diagnosis and ended on the date of death or on the date last seen alive.
Cell lines and transfection
PANC-1, AsPC-1, BxPC-3, SW-1990 and HEK293T cell lines were purchased from ATCC (Manassas, VA, USA). Cells were maintained in DMEM or RPMI 1640 supplemented with 10% fetal calf serum and antibiotics (Invitrogen, Carlsbad, CA, USA) in a humidified atmosphere under 5% CO<sub>2</sub>. All transfections were performed with Lipofectamine 2000 (Thermo Scientific, Waltham, MA, USA) or Lipofectamine RNAiMAX (Thermo Scientific) transfection reagents. Cells were cultured until 40%–50% confluence at the time of transfection. At 24–48 h after transfection, cells were harvested for quantitative PCR or western blot analysis. For gene knockdown experiments, control cells were incubated with OPTI-MEM and transfection reagent (vehicle group), or with OPTI-MEM and transfection reagent plus no-silencing siRNA (siRNA-NC group). Sequences of siRNA were: transgelin-2#1, 5’-GGUUACAGAUGGGCACCAAUU-3’, transgelin-2 #2, 5’- CCUAAGAAAUCCAAGGAGAUU -3’, trans gelin-2#3, 5’- UCAAGCAGAUGGAGCAGAUUU -3’, SREBP-1, 5’- GGGAGAGCCUGUACAGCUUUU-3’.
Luciferase activity assay
To construct the reporter plasmid of transgelin2-Luc, fragments of the promoter region of TAGLN2 gene were amplified by PCR and cloned into pGL3 vector. HEK293T cells were co-transfected with 100 ng transgelin2-Luc reporter and 10 ng RGB renilla luciferase (as an internal control). After 24 h transfection, cells were harvested and washed with phosphate-buffered saline (PBS), and lysed on ice in passive lysis buffer. Reporter gene assays were performed with the Dual-Luciferase Reporter Assay System (Promega, Madison, WI, USA). All experiments were performed in triplicate from independent cell cultures.
Immunohistochemical staining
Immunohistochemical staining of paraffin sections for transgelin-2 or SREBP-1 protein was performed with an LSAB kit (DAKO, Marseilles, France), using transgelin-2 antibody (dilution, 1:500; Novus Biologicals, Littleton, CO, USA) or SREBP-1 antibody (dilution, 1:250; Santa Cruz Biotechnology, Santa Cruz, CA, USA). The sections were incubated in 3,3′ diaminobenzide tetrahydrochloride with 0.05 % H2O2 for 3 min. Immunostaining scores were independently evaluated by three pathologists. Semi-quantitative scores were used to analyze antibody immunostaining. Intensity of staining was categorized into −, +, ++ or +++, denoting negative (0), weak (1), moderate (2) or strong staining (3). Extent of immunostaining was categorized into 0 (<10%), 1 (10%–25%), 2 (26%–50%) or 3 (>50%) on the basis of the percentage of positive cells. Three random microscopic fields per tissue were calculated. The final score of expression level was determined by the formula: final score = intensity score × percentage score. The final score was ranged from 0 to 9. The final score of ≤3 was defined as low expression, and >3 as high expression.
Quantitative RT-PCR
To isolate total RNA, an RNeasy RNA isolation kit (Qiagen, Valencia, CA,USA) was used. The concentration of each RNA sample was measured using the Nanodrop Spectrophotometer (Thermo Scientific). The ratio of absorbance at 260 nm and 280 nm was used to assess RNA purity. The ratio for pure RNA was ~2.0. Prior to cDNA synthesis, DNase treatment was performed using the RQ1 RNase-free DNase (Promega). RNA was subjected to cDNA synthesis (GE Healthcare, Marlborough, MA, USA). Real-time quantitative PCR was performed using the SYBR-Green Master PCR Mix kit (Thermo Scientific). Expression of mRNA was assessed by evaluating threshold cycle (CT) values. The comparative Ct (ΔΔCt) method was used to determine the relative mRNA level as described previously [30].. The primer sequences were as follows: transgelin-2 forward: GGAGATCTCTCCCCGCA, reverse TCCACTGGATCAGGATCTGC; SREBP-1 forward: GCTGCTGACCGACATCGAA, reverse GGGTGGGTCAAATAGGCCAG.
Western blotting
Protein lysates were harvested from cells at 48 hours after transfection, washed with phosphate-buffered saline (PBS), and lysed on ice in lysis buffer (1% NP-40, 50 mM Tris–HCl pH 8.0, 150 mM NaCl and 2 mM EDTA) supplemented with complete protease inhibitor cocktail (Roche Applied Science, Indianapolis, IN,USA). The lysates were centrifuged at 15,000 rpm for 30 min at 4°C. The supernatant was collected. Protein concentration was quantitated by BCA method. About 30–50 μg of protein were separated by SDS−PAGE and then transferred to PVDF membranes. The membranes were probed with primary antibody for 3 h. After incubation with HRP-conjugated antibody, antibody detection was achieved by chemiluminescence. The primary antibodies used in this study were: as follow anti-transgelin-2 (Novus Biologicals), anti-transgelin (Abcam, Cambridge, MA, USA), anti-AKT (Santa Cruz Biotechnology), anti-phospho-AKT (Santa Cruz Biotechnology) and anti-GAPDH (Cell Signaling Technology, Danvers, MA, USA).
Cell proliferation and colony-formation assay
Cell proliferation was performed as described previously [31]. Briefly, 104 cells/well were seeded into six-well plates after 24 h transfection. Cell numbers were counted every 24 h. At least three independent experiments were performed. Growth curve assays were performed by counting live cells using trypan blue exclusion. For colony-formation assay, single-cell suspensions (500 cells per dish) were plated and fresh medium was replaced every 48 h. After 10–14 days, cells were fixed in methanol for 10 min, and stained with Crystal Violet (Sigma, St. Louis, MO, USA). Colonies were counted using an inverted microscope.
ChIP assay
ChIP was performed using the EZ-ChIP Assay kit (Millipore, Billerica, MA, USA) with an antibody to SREBP-1 (Santa Cruz Biotechnology) as described previously [32]. Cells were grown overnight in 100-mm dishes to 60%–70% confluence (approximatively 0.8×10⁷–1.2×10⁷ cells/dish). Cells were crosslinked with 1% formaldehyde for 10 min and quenched with glycine for 5 min. Cells were harvested by scraping in ice-cold PBS and resuspended in SDS lysis buffer containing inhibitors (Roche Applied Science) and sonicated on ice to release 200–800-bp DNA fragments. The sheared DNA was incubated overnight with 10 μg SREBP-1 antibody with rotation at 4°C and precipitated with protein A/G agarose for 3 h at 4°C. Quantitative PCR was used to evaluate the enrichment of SREBP-1 on the promoter region of TAGLN2 gene.
Statistical analysis
Experimental results are presented as mean±SD. Wilcoxon test was used to assess the immunohistochemical score for transgelin-2 protein in cancer tissues and adjacent normal tissues. Correlation analysis of transgelin-2 staining score with clinicopathological features was analyzed by χ2 test. The correlation between transgelin-2 score and SREBP-1 score was examined by Spearman’s test. For survival analysis, analysis of statistical significance was performed using the long-rank (Mantel–Cox) test. Multivariate logistic regression analysis was used for analyzing risk factors for the level of transgelin-2. Cox proportional hazard model was used to identify the prognostic factors for survival. A difference was considered significant at p<0.05. All statistical analysis was performed using SPSS software, version 22.
ACKNOWLEDGMENTS
This study was supported by research grants from National Natural Science Foundation of China (No. 81672349, 81372195 & 81572719), Program for Professor of Special Appointment (Eastern Scholar) at Shanghai Institutions of Higher Learning (No. 1410000157).
CONFLICTS OF INTEREST
The authors declare no conflicts of interest.
REFERENCES
1. Siegel RL, Miller KD, Jemal A. Cancer statistics, 2016. CA Cancer J Clin. 2016; 66:7–30.
2. Hanahan D, Weinberg RA. Hallmarks of cancer: the next generation. Cell. 2011; 144:646–74.
3. Zhang Y, Ye Y, Shen D, Jiang K, Zhang H, Sun W, Zhang J, Xu F, Cui Z, Wang S. Identification of transgelin-2 as a biomarker of colorectal cancer by laser capture microdissection and quantitative proteome analysis. Cancer Sci. 2010; 101:523–29.
4. Yakabe K, Murakami A, Kajimura T, Nishimoto Y, Sueoka K, Sato S, Nawata S, Sugino N. Functional significance of transgelin-2 in uterine cervical squamous cell carcinoma. J Obstet Gynaecol Res. 2016; 42:566–72.
5. Kawakami K, Enokida H, Chiyomaru T, Tatarano S, Yoshino H, Kagara I, Gotanda T, Tachiwada T, Nishiyama K, Nohata N, Seki N, Nakagawa M. The functional significance of miR-1 and miR-133a in renal cell carcinoma. Eur J Cancer. 2012; 48:827–36.
6. Li LS, Kim H, Rhee H, Kim SH, Shin DH, Chung KY, Park KS, Paik YK, Chang J, Kim H. Proteomic analysis distinguishes basaloid carcinoma as a distinct subtype of nonsmall cell lung carcinoma. Proteomics. 2004; 4:3394–400.
7. Shields JM, Rogers-Graham K, Der CJ. Loss of transgelin in breast and colon tumors and in RIE-1 cells by Ras deregulation of gene expression through Raf-independent pathways. J Biol Chem. 2002; 277:9790–99.
8. Leung WK, Ching AK, Chan AW, Poon TC, Mian H, Wong AS, To KF, Wong N. A novel interplay between oncogenic PFTK1 protein kinase and tumor suppressor TAGLN2 in the control of liver cancer cell motility. Oncogene. 2011; 30:4464–75.
9. Zhao X, Feng D, Wang Q, Abdulla A, Xie XJ, Zhou J, Sun Y, Yang ES, Liu LP, Vaitheesvaran B, Bridges L, Kurland IJ, Strich R, et al. Regulation of lipogenesis by cyclin-dependent kinase 8-mediated control of SREBP-1. J Clin Invest. 2012; 122:2417–27.
10. Sun Y, He W, Luo M, Zhou Y, Chang G, Ren W, Wu K, Li X, Shen J, Zhao X, Hu Y. SREBP1 regulates tumorigenesis and prognosis of pancreatic cancer through targeting lipid metabolism. Tumour Biol. 2015; 36:4133–41.
11. Porstmann T, Santos CR, Griffiths B, Cully M, Wu M, Leevers S, Griffiths JR, Chung YL, Schulze A. SREBP activity is regulated by mTORC1 and contributes to Akt-dependent cell growth. Cell Metab. 2008; 8:224–36.
12. Guo D, Bell EH, Chakravarti A. Lipid metabolism emerges as a promising target for malignant glioma therapy. CNS Oncol. 2013; 2:289–99.
13. Pei H, Li L, Fridley BL, Jenkins GD, Kalari KR, Lingle W, Petersen G, Lou Z, Wang L. FKBP51 affects cancer cell response to chemotherapy by negatively regulating Akt. Cancer Cell. 2009; 16:259–66.
14. Logsdon CD, Simeone DM, Binkley C, Arumugam T, Greenson JK, Giordano TJ, Misek DE, Kuick R, Hanash S. Molecular profiling of pancreatic adenocarcinoma and chronic pancreatitis identifies multiple genes differentially regulated in pancreatic cancer. Cancer Res. 2003; 63:2649–57.
15. Badea L, Herlea V, Dima SO, Dumitrascu T, Popescu I. Combined gene expression analysis of whole-tissue and microdissected pancreatic ductal adenocarcinoma identifies genes specifically overexpressed in tumor epithelia. Hepatogastroenterology. 2008; 55:2016–27.
16. Deng T, Lyon CJ, Bergin S, Caligiuri MA, Hsueh WA. Obesity, Inflammation, and Cancer. Annu Rev Pathol. 2016; 11:421–49.
17. Biadgo B, Abebe M. Type 2 Diabetes Mellitus and Its Association with the Risk of Pancreatic Carcinogenesis: A Review. Korean J Gastroenterol. 2016; 67:168–77.
18. Chan MT, Lim GE, Skovsø S, Yang YH, Albrecht T, Alejandro EU, Hoesli CA, Piret JM, Warnock GL, Johnson JD. Effects of insulin on human pancreatic cancer progression modeled in vitro. BMC Cancer. 2014; 14:814.
19. Feng D, Youn DY, Zhao X, Gao Y, Quinn WJ 3rd, Xiaoli AM, Sun Y, Birnbaum MJ, Pessin JE, Yang F. mTORC1 Down-Regulates Cyclin-Dependent Kinase 8 (CDK8) and Cyclin C (CycC). PLoS One. 2015; 10:e0126240.
20. Trajkovic-Arsic M, Kalideris E, Siveke JT. The role of insulin and IGF system in pancreatic cancer. J Mol Endocrinol. 2013; 50:R67–74.
21. Mathelier A, Fornes O, Arenillas DJ, Chen CY, Denay G, Lee J, Shi W, Shyr C, Tan G, Worsley-Hunt R, Zhang AW, Parcy F, Lenhard B, et al. JASPAR 2016: a major expansion and update of the open-access database of transcription factor binding profiles. Nucleic Acids Res. 2016; 44:D110–15.
22. Zhou L, Zhang R, Zhang L, Sun Y, Yao W, Zhao A, Li J, Yuan Y. Upregulation of transgelin is an independent factor predictive of poor prognosis in patients with advanced pancreatic cancer. Cancer Sci. 2013; 104:423–30.
23. Stattin P, Björ O, Ferrari P, Lukanova A, Lenner P, Lindahl B, Hallmans G, Kaaks R. Prospective study of hyperglycemia and cancer risk. Diabetes Care. 2007; 30:561–67.
24. Hine RJ, Srivastava S, Milner JA, Ross SA. Nutritional links to plausible mechanisms underlying pancreatic cancer: a conference report. Pancreas. 2003; 27:356–66.
25. Chari ST, Leibson CL, Rabe KG, Ransom J, de Andrade M, Petersen GM. Probability of pancreatic cancer following diabetes: a population-based study. Gastroenterology. 2005; 129:504–11.
26. Giovannucci E, Harlan DM, Archer MC, Bergenstal RM, Gapstur SM, Habel LA, Pollak M, Regensteiner JG, Yee D. Diabetes and cancer: a consensus report. CA Cancer J Clin. 2010; 60:207–21.
27. Powell DR, Suwanichkul A, Cubbage ML, DePaolis LA, Snuggs MB, Lee PD. Insulin inhibits transcription of the human gene for insulin-like growth factor-binding protein-1. J Biol Chem. 1991; 266:18868–76.
28. Horton JD, Goldstein JL, Brown MS. SREBPs: activators of the complete program of cholesterol and fatty acid synthesis in the liver. J Clin Invest. 2002; 109:1125–31.
29. Jin H, Cheng X, Pei Y, Fu J, Lyu Z, Peng H, Yao Q, Jiang Y, Luo L, Zhuo H. Identification and verification of transgelin-2 as a potential biomarker of tumor-derived lung-cancer endothelial cells by comparative proteomics. J Proteomics. 2016; 136:77–88.
30. Sun Y, Zhao X, Yao Y, Qi X, Yuan Y, Hu Y. Connexin 43 interacts with Bax to regulate apoptosis of pancreatic cancer through a gap junction-independent pathway. Int J Oncol. 2012; 41:941–48.
31. Sun Y, Zhao X, Zhou Y, Hu Y. miR-124, miR-137 and miR-340 regulate colorectal cancer growth via inhibition of the Warburg effect. Oncol Rep. 2012; 28:1346–52.
32. Sun Y, Zhao X, Luo M, Zhou Y, Ren W, Wu K, Li X, Shen J, Hu Y. The pro-apoptotic role of the regulatory feedback loop between miR-124 and PKM1/HNF4α in colorectal cancer cells. Int J Mol Sci. 2014; 15:4318–32.