
INTRODUCTION
Orf virus (ORFV), a type strain of parapoxvirus, causes contagious ecthyma, characterized by inflammation of the wounded epithelial tissue. Its genome consists of linear double-stranded DNA approximately 138 kbp long and encoding 132 genes [1]. Essential genes involved in viral replication, morphogenesis of mature virions and extracellular virions are located in the conserved central part of the genome [2]. Variable genes are in the terminal ends, encoding factors with important roles in virulence, pathogenesis, immune evasion/modulation and host range [1, 2].
ORFV is the causative agent of contagious ecthyma, a non-systemic and contagious acute skin disease that has a worldwide distribution and brings serious economic loss to farmers. It affects not only ruminants, but also people who are in close contact with infected livestock [3-5]. In contrast to orthopoxviruses, human ORFV infections are typically self-limiting and recover completely with routine wound care and antibiotic agents [3, 4, 6]. ORFV has strong immunomodulatory activities [7]. It can cause repeated infections, even in the presence of antibodies. These properties make ORFV an ideal viral vector for disease therapy. Pre-clinical trials using ORFV identified its anti-tumoural activity via activation of both cytokine-secreting and tumoricidal natural killer (NK) cells [8]. Another study stated that perioperative therapy with ORFV could enhance the function of NK cells, which reduces metastatic recurrence in surgical animal models bearing cancer cells [9]. ORFV may also be developed as an immunomodulation application to treat chronic viral infections, liver fibrosis/cirrhosis and immune disorders [7].
While there is an interest in the use of ORFV as an immunomodulation therapy for pathogens, tumors and other diseases, little is known of the impact of ORFV on the human expression profile. Next generation sequencing technology allows monitoring of the expression of host genes in response to infection, which provides new insights into host gene expression, regulation and interactions between the virus and host.
In this study, we carried out the analysis of transcriptome changes in human foreskin fibroblast cells (HFF-1) following ORFV infection via RNA-seq. The results provide a better understanding of the mechanisms of orf virus infection and will aid in the development of ORFV immunomodulation therapies against pathogens, tumors, liver fibrosis/cirrhosis and immune disorders.
RESULTS
Distinct and dynamic changes in the expression of cellular genes in ORFV-infected HFF-1 cells
The transcriptome data was generated from the mRNA isolated from HFF-1 cells cultured with ORFV (MOI=5) at 0, 3 and 8 h post-infection. Each of the data sets contained between 17.8–23.5 million reads and a mapping rate of 97-98% (Table 1). The sample 0h-1 was discarded, because of a clear separation between it and the other two samples, by PCA (Supplementary Figure 1A). The representative distributions of genes up- or down-regulated are shown in the volcano and scatter plots at 8 h post-infection compared to uninfected cells (Figure 1A, 1B).The red dots represent the up-regulated genes, while the blue dots represent the down-regulated genes. At 3 and 8 h.p.i, 82 and 489 genes were up-regulated, respectively, while 180 and 85 genes were down-regulated, respectively (Table 1 and Figure 1C). Compared to the 3 h.p.i. group, 91 genes were down-regulated and 748 genes up-regulated at 8 h post-infection (Figure 1C). From the time course, the expression levels of the majority of genes descended before rising. Compared to the uninfected sample, the 3 h.p.i. and 8 h.p.i. groups shared 49 differentially expressed genes. Among them, 25 genes were commonly up-regulated, 19 were commonly down-regulated, and 5 declined before ascending (Supplementary Figure 1B). Representatives of expression pattern for commonly up-regulated and down-regulated genes are shown in Supplementary Figure 1C and 1D. Most of the up-regulated genes showed the same pattern of being highly up-regulated at 8 hours after infection (Supplementary Figure 1C), while obviously down-regulated genes occurred mainly at 3 hour post-infection (Supplementary Figure 1D).
Table 1: Summary of the number of reads mapping for each transcriptone data set and the number of genes significantly up- or down-regulated (normalized to uninfected samples)
Samples_ID |
Accession no. |
All reads |
Mapped reads |
Mapping ratio |
Number of up-regulated genes |
Number of down-regulated genes |
|---|---|---|---|---|---|---|
0h_1 |
GSM2448850 |
19,763,619 |
19,354,510 |
97.93% |
_ |
_ |
0h_2 |
GSM2448851 |
19,833,603 |
19,425,357 |
97.94% |
||
0h_3 |
GSM2448852 |
21,917,869 |
21,471,619 |
97.96% |
||
3h_1 |
GSM2448853 |
17,813,942 |
17,421,247 |
97.80% |
82 |
180 |
3h_2 |
GSM2448854 |
18,344,341 |
17,951,313 |
97.86% |
||
3h_3 |
GSM2448855 |
21,107,755 |
20,653,563 |
97.85% |
||
8h_1 |
GSM2448856 |
23,514,308 |
22,907,363 |
97.42% |
489 |
85 |
8h_2 |
GSM2448857 |
20,416,737 |
19,884,667 |
97.39% |
||
8h_3 |
GSM2448858 |
23,134,104 |
22,489,211 |
97.21% |
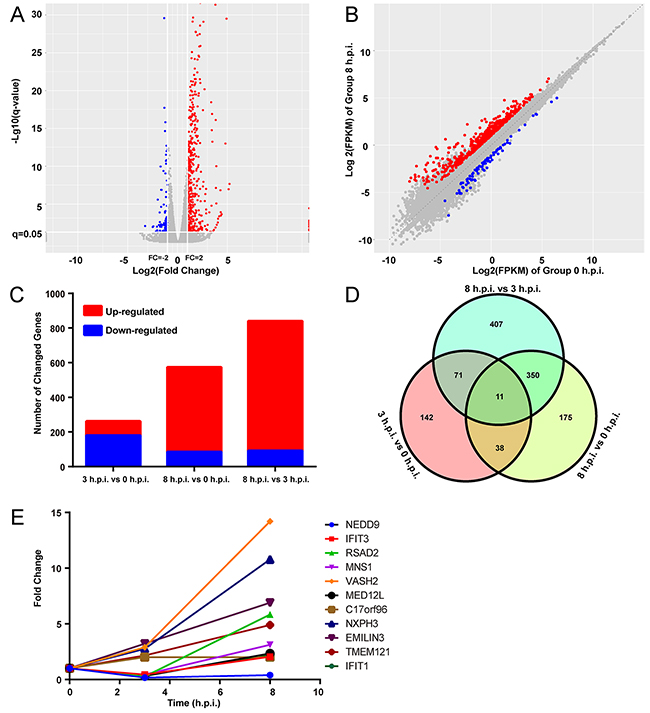
Figure 1: A number of differentially expressed genes were induced by ORFV. (A) Volcano plot for the samples 8 hours post infection with mRNA expression differences, compared to hour 0. Log2(fold change) is plotted as the abscissa and log10(q) is plotted as the ordinate. Significantly up-regulated genes are indicated in red and down-regulated genes are indicated in blue. (B) Scatter plot of the the 0 h.p.i and 8 h.p.i groups is shown. (C) Graph showing the number and fold change of up- and down-regulated genes. (D) A Venn diagram presents the number of differentially expressed genes that are unique or shared in every paired group. (E) The expression patterns of 11 genes that were shared in the three paired groups in (D). q= FDR corrected P-values, FPKM= fragments per kilobase of exon model per million mapped reads.
In-depth analyses using the data from the three paired groups revealed that a total of 1194 DEGs were regulated by ORFV. The Venn diagram displayed the differently and similarly regulated genes between each two groups (Figure 1D). Meanwhile, the three paired groups shared 11 genes that were differentially expressed (Figure 1E). The expression patterns of three interferon-inducible genes (IFIT3, IFIT1 and RSAD2) were decreased before beginning to increase. The expression level of VASH2, a gene encoding angiogenesis inhibitor, was sharply elevated. These results indicate that ORFV can increase and decrease expression levels of a number of host genes.
Gene ontology analysis of the differential genes
In order to gain a better understanding of the associated functions for the differentially expressed genes, gene ontology (GO) analysis was used to perform an enrichment analysis and classifications (Figure 2). GO analysis identified enriched biological processes associated with “cellular component organization or biogenesis”, “biological regulation”, “response to stimulus”, “regulation of biological process”, “single-organism process”, “cellular process” and “metabolic process”, indicating that strong host response were induced by the virus. Identified enriched cellular component terms associated with “cell part”, “organelle part”, “organelle”, “membrane” and “cell”, suggesting multifarious cellular components involved in the viral infection and replication. Enriched molecular functions were defined associated with “binding” and “catalytic activity”, implying that specific interactions between host and virus were occurring.
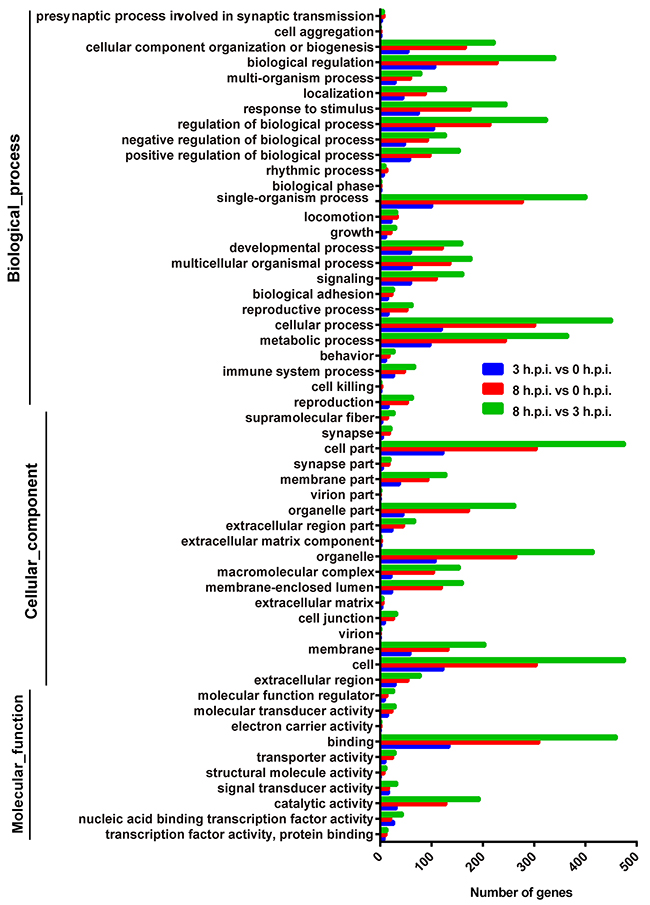
Figure 2: Functional analyses of the differentially expressed genes by Gene Ontology (GO) classifications for the three paired groups. The abscissa represents the enriched gene number. Blue = group 3 h.p.i. vs. group 0 h.p.i, red = group 8 h.p.i. vs. group 3 h.p.i, green = group 8 h.p.i. vs. group 3 h.p.i.
Compared to uninfected samples, GO analysis showed that the type I interferon signaling pathway was significantly enriched at 3 h.p.i. (p<0.05). Most enriched genes in the pathway were down-regulated at 3 h.p.i. but were upregulated at 8 h.p.i. (Figure 3A, Supplementary Table 1), inferring that an immunosuppressive effect was induced by the orf virus at early stages, while a potential defend in the cells emerged to block viral replication at late stages. Genes with GO terms associated with neuronal synaptic plasticity and fatty acid had significantly changed at 3 h post-infection (p<0.001) (Figure 3A). At 8 h post-infection, genes with GO terms associated with DNA replication and repair were significantly enriched (Figure 3B and 3C), suggesting that virus was replicating rapidly.
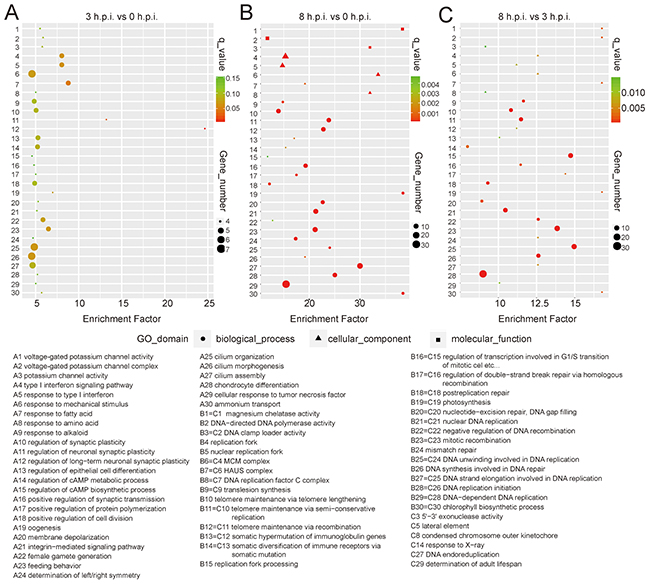
Figure 3: Function enrichment of the DEGs from the transcriptome data by GO analysis. The figure presents the GO enrichment of the samples at 3 h.p.i. (A) or 8 h.p.i. (B), compared to uninfected cells. (C) GO enrichment is shown for group 8 h.p.i. against group 3 h.p.i. Enrichment factor is plotted on the x axis. The size of each bubble represents the number of genes.
Analysis of important KEGG pathways
We used the differential genes in every pair group for KEGG pathway enrichment. The DEGs were significantly enriched in the classifications of “cell growth and death”, “signal transduction”, and “replication and repair” (Figure 4), showing that viral infection and host response were occurring. The classification of “cellular community”, “signaling molecules and interaction”, “global and overview maps”, “nucleotide metabolism”, “development”, “endocrine system”, “immune response” and “nervous response” were also enriched (Figure 4).
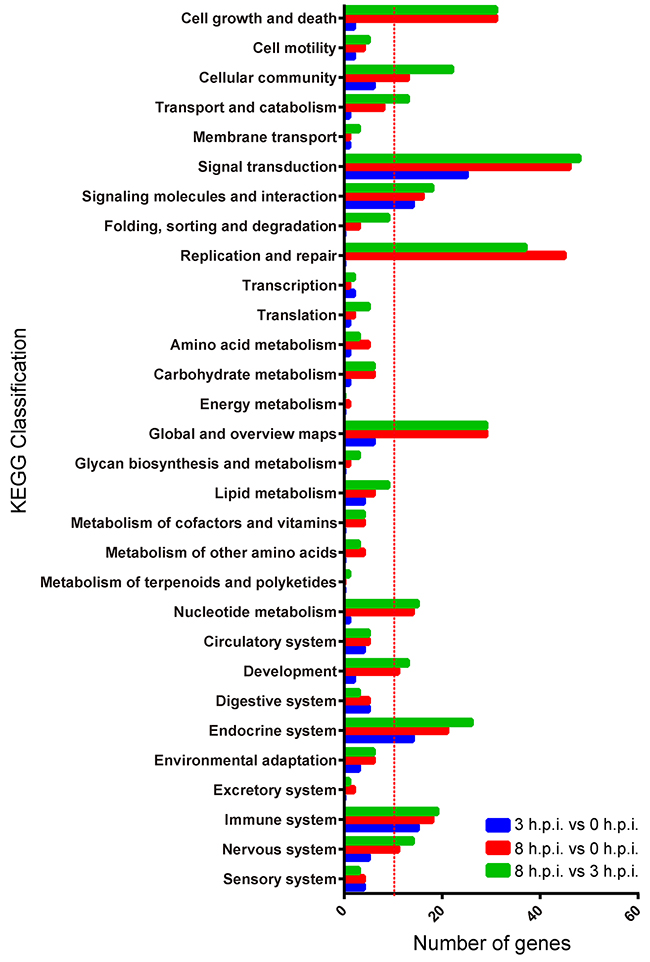
Figure 4: KEGG classifications of differentially expressed genes for the three paired groups. Blue = 3 h.p.i. group vs. 0 h.p.i. group, red = 8 h.p.i. group vs. 0 h.p.i. group, green = 8 h.p.i. group vs. 3 h.p.i. group.
The significant KEGG pathways between the 0 h.p.i. and the 3 h.p.i. groups are shown in Table 2. The pathways associated with viral infection (Herpes simplex infection, influenza A, and hepatitis C) and host immune response (Cytokine-cytokine receptor interaction, toll-like receptor signaling pathway, TNF signaling pathway, and intestinal immune network for IgA production) were enriched. At 8 h post-infection, the genes were most enriched in the DNA replication, cell cycle, and other nucleotide metabolism (mismatch repair, homologous recombination, nucleotide excision repair, base excision repair, purine metabolism, pyrimidine metabolism, oocyte meiosis, folate biosynthesis, and one carbon pool by folate) pathways, indicating that the viral infection had elicited a strong host response (Table 3 and 4). At the same time, the p53 signaling pathway was activated to induce apoptosis and regulate the cell cycle (p<0.01).
Table 2: KEGG analysis of DEGs between 3 h post infection and uninfected sample groups
pathway_ID |
PATHWAY_DES |
P value |
|---|---|---|
hsa05168 |
Herpes simplex infection |
1.05E-03 |
hsa04060 |
Cytokine-cytokine receptor interaction |
2.65E-03 |
hsa05164 |
Influenza A |
3.44E-03 |
hsa05310 |
Asthma |
6.02E-03 |
hsa04933 |
AGE-RAGE signaling pathway in diabetic complications |
6.08E-03 |
hsa04620 |
Toll-like receptor signaling pathway |
7.44E-03 |
hsa04668 |
TNF signaling pathway |
8.67E-03 |
hsa04270 |
Vascular smooth muscle contraction |
1.24E-02 |
hsa05202 |
Transcriptional misregulation in cancer |
1.60E-02 |
hsa05160 |
Hepatitis C |
1.87E-02 |
hsa00600 |
Sphingolipid metabolism |
2.05E-02 |
hsa04672 |
Intestinal immune network for IgA production |
2.05E-02 |
hsa05144 |
Malaria |
2.29E-02 |
hsa05030 |
Cocaine addiction |
2.29E-02 |
hsa04024 |
cAMP signaling pathway |
2.56E-02 |
hsa04713 |
Circadian entrainment |
2.63E-02 |
hsa05221 |
Acute myeloid leukemia |
3.41E-02 |
hsa04921 |
Oxytocin signaling pathway |
3.63E-02 |
hsa04924 |
Renin secretion |
4.60E-02 |
Table 3: KEGG analysis of DEGs between 8 h post infection and uninfected sample groups
pathway_ID |
PATHWAY_DES |
P value |
|---|---|---|
hsa03030 |
DNA replication |
6.02E-22 |
hsa03460 |
Fanconi anemia pathway |
6.12E-14 |
hsa03430 |
Mismatch repair |
7.51E-12 |
hsa04110 |
Cell cycle |
1.29E-09 |
hsa03440 |
Homologous recombination |
1.56E-09 |
hsa03420 |
Nucleotide excision repair |
1.63E-07 |
hsa03410 |
Base excision repair |
7.99E-07 |
hsa04115 |
p53 signaling pathway |
2.55E-04 |
hsa05161 |
Hepatitis B |
4.38E-04 |
hsa00230 |
Purine metabolism |
7.48E-04 |
hsa00240 |
Pyrimidine metabolism |
1.30E-03 |
hsa05162 |
Measles |
7.84E-03 |
hsa04114 |
Oocyte meiosis |
1.16E-02 |
hsa00790 |
Folate biosynthesis |
1.27E-02 |
hsa05222 |
Small cell lung cancer |
1.77E-02 |
hsa05215 |
Prostate cancer |
2.10E-02 |
hsa00120 |
Primary bile acid biosynthesis |
2.14E-02 |
hsa00670 |
One carbon pool by folate |
3.28E-02 |
hsa04916 |
Melanogenesis |
3.71E-02 |
hsa05206 |
MicroRNAs in cancer |
4.40E-02 |
hsa04390 |
Hippo signaling pathway |
4.74E-02 |
hsa05219 |
Bladder cancer |
4.84E-02 |
Table 4: KEGG analysis of DEGs between 8 h post-infection and 3 h post-infection groups
pathway_ID |
PATHWAY_DES |
P value |
|---|---|---|
hsa03030 |
DNA replication |
4.67E-11 |
hsa03460 |
Fanconi anemia pathway |
7.15E-10 |
hsa03440 |
Homologous recombination |
7.57E-09 |
hsa04110 |
Cell cycle |
7.79E-08 |
hsa03430 |
Mismatch repair |
1.46E-07 |
hsa03410 |
Base excision repair |
1.92E-04 |
hsa00230 |
Purine metabolism |
1.14E-03 |
hsa03420 |
Nucleotide excision repair |
1.38E-03 |
hsa03450 |
Non-homologous end-joining |
1.57E-03 |
hsa00790 |
Folate biosynthesis |
2.06E-03 |
hsa05162 |
Measles |
2.78E-03 |
hsa04115 |
p53 signaling pathway |
3.34E-03 |
hsa00240 |
Pyrimidine metabolism |
4.05E-03 |
hsa05168 |
Herpes simplex infection |
5.15E-03 |
hsa05210 |
Colorectal cancer |
7.28E-03 |
hsa05206 |
MicroRNAs in cancer |
7.40E-03 |
hsa00670 |
One carbon pool by folate |
7.40E-03 |
hsa04114 |
Oocyte meiosis |
1.07E-02 |
hsa05222 |
Small cell lung cancer |
1.23E-02 |
hsa05161 |
Hepatitis B |
1.41E-02 |
hsa05217 |
Basal cell carcinoma |
1.60E-02 |
hsa00062 |
Fatty acid elongation |
1.60E-02 |
hsa05200 |
Pathways in cancer |
1.75E-02 |
hsa04550 |
Signaling pathways regulating pluripotency of stem cells |
2.98E-02 |
hsa04623 |
Cytosolic DNA-sensing pathway |
3.14E-02 |
hsa05215 |
Prostate cancer |
4.48E-02 |
hsa04622 |
RIG-I-like receptor signaling pathway |
4.62E-02 |
hsa05164 |
Influenza A |
4.63E-02 |
hsa04390 |
Hippo signaling pathway |
4.84E-02 |
hsa05160 |
Hepatitis C |
5.00E-02 |
RNA sequencing revealed divergent gene expression patterns after infection
A hierarchical clustering was performed to generate a heatmap of the 1194 DEGs after stimulation using the FPKM values (Figure 5). These DEGs were partitioned mainly into four distinct expression patterns. Cluster 1 showed a steady increase and cluster 2 changed smoothly before rising. The expression level of cluster 3 was first decreased, and cluster 4 first rose before failing.
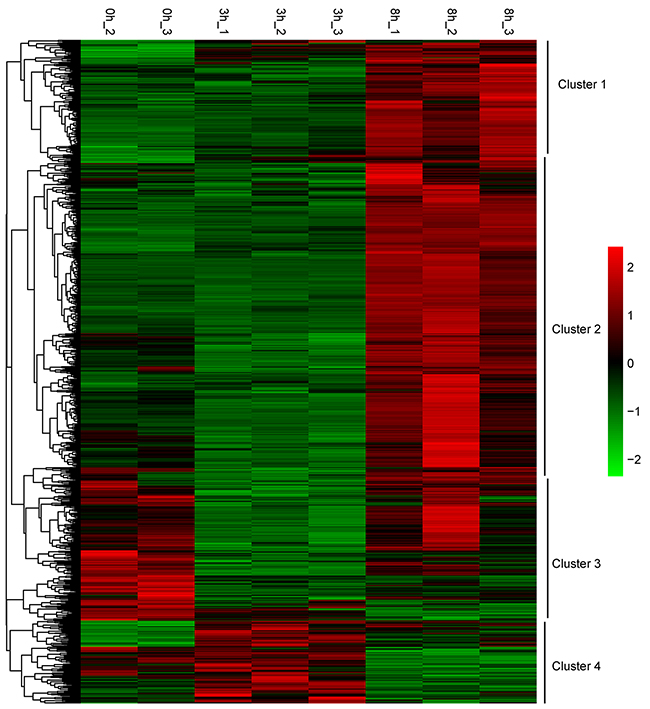
Figure 5: Transcription heatmap of 1194 DEGs for the three groups, with subcluster classification. Color scale is shown in the right side. Up-regulated or down-regulated genes are presented by red or green bars.
In order to determine the elaborate expression patterns of these differential genes, trend analysis was performed using the OmicShare tools. A total of 8 gene cluster modules were generated for the samples and three profiles (profile 4, 2 and 7) were significantly enriched (P-value <0.001) (Figure 6A). Profile 4 included the largest number of genes (499 genes), indicating that most genes expressed with the model of changing smoothly before rising (Figure 6A and 6B). 298 genes were first decreased (profile 2) and 135 genes were expressed with a steady increase (profile 7) (Figure 6A and 6B). The profiles presented different genetic functions by gene ontology (Figure 6C) and most genes responsible for “binding”, “cell”, “cell part”, “cellular process”, “metabolic process”, “organelle”, “response to stimulus” and “single-organism process”. Profile 4 had a relatively higher percentage of genes responsible for “cell”, “cell part”, “organelle” and “organelle part” than the other two profiles. Profile 4 and 7 had similar percentages of genes responsible for “binding”, “biological regulation”, “cellular process”, “metabolic process”, “response to stimulus” and “single-organism process”, and both of these profiles had enrichment percentages higher than profile 2.
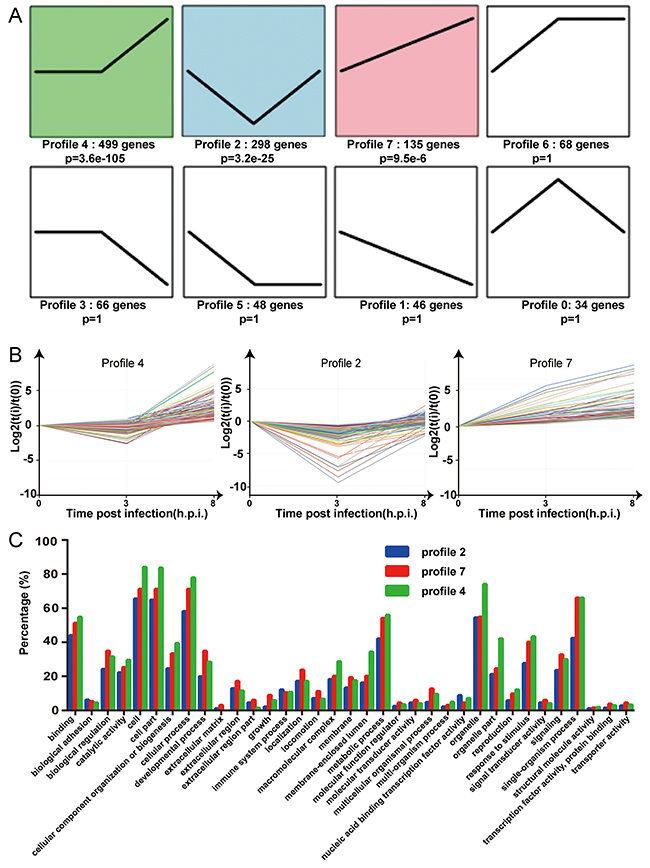
Figure 6: Trend analysis of the 1194 differentially expressed genes. (A) Different expression patterns of 1194 DEGs were partitioned into 8 profiles. The number of the DEGs and p value assigned to each profile is shown. (B) Characteristic expression patterns represented in profiles 2, 4 and 7 (p<0.001). Experimental points are indicated on the x axis: 0 for the uninfected group, 3 for 3 h.p.i, and 8 for 8 h.p.i. The y axis shows the normalized expression values. (C) The percentages of the differentially expressed genes related to the GO classifications for the three paired groups are shown. Blue = profile 2, green = profile 4, red = profile 7.
The DEGs associated with “cell growth and death” and “immune response” induced by orf virus
Cell growth and death are key processes utilized by the host to regulate lifecycle. The expression of 38 genes associated with cell growth and death were significantly up-regulated by ORFV infection at 8 h post-infection, except for CDC25B and FOS (Figure 7A and Supplementary Table 2). Among them, many genes are associated with the cell cycle. For example, E2F1, SKP2, CCNE1 and CDC25A are involved in G1-S transition of the cell cycle. MCMs are the putative replicative helicases essential for DNA replication initiation and elongation in eukaryotic cells. CDC6 is involved in the initiation of DNA replication and participates in checkpoint controls that ensure DNA replication is complete prior to initiation of mitosis. Supplementary Table 3 shows the expression levels of the DEGs involved in the cell cycle. A range of genes that are involved in regulating the cell cycle have been up-regulated, including CDK1, CDK2, CDC6, E2F1, SKP2, CCNE1, KNTC1, BRCA2, BCL2 and CDK5R1. Of course, negative regulation was also activated. For instance, RBL1 and BRCA1, which participate in negative regulation of the cell cycle, were up-regulated. These data suggest that the cell cycle progression was induced by viral infection. Meanwhile, the expression levels of some genes associated with cell death were significantly increased at 8 h after infection, including APAF1, BCL-2, FOS, TNFSF10, PMAIP1, LMNB1, PARP2 and BCL2L11. For instance, pro-apoptotic gene BCL2L11 was elevated with an average fold change of 3.51 (corrected p-value <0.001). Eight genes (APAF1, RRM2, TP73, CCNE1, CCNE2, CDK1, CDK2, PPM1D and PMAIP1) associated with the p53 signaling pathway, which can regulate the growth and death of the host cells, were activated. This result indicated that cell growth and death were activated by the orf virus at 8 hours post infection.
Meanwhile, significant changes in gene expression of the DEGs associated with immune response were observed (Figure 7B). The immune function of each gene is listed in Supplementary Table 4. Many genes were down-regulated at 3 hours post-infection, while some were increased. For example, TNFSF13B, FOS, POLR3G and PRKCE were down-regulated at 3 h post infection, while ITGB7 and THBD were up-regulated. Most immune genes were up-regulated during the period 3-8 hours post-infection. For instance, TNFSF13B, involving in the stimulation of B- and T-cells and the regulation of humoral immunity, was increased 2.13 fold during the time. TNFAIP3, ULBP1 and TIAM1 were consistently down-regulated by viral infection, while CCL8, CCL11, CXCL11, NCF2, CSF3 and PRKCB were significantly up-regulated after infection. Innate immune response and adaptive immunity were activated by these genes. Chemokines were up-regulated to attract T cells, monocytes and granulocytes. These data show that the defense response of host was established in response to viral infection.
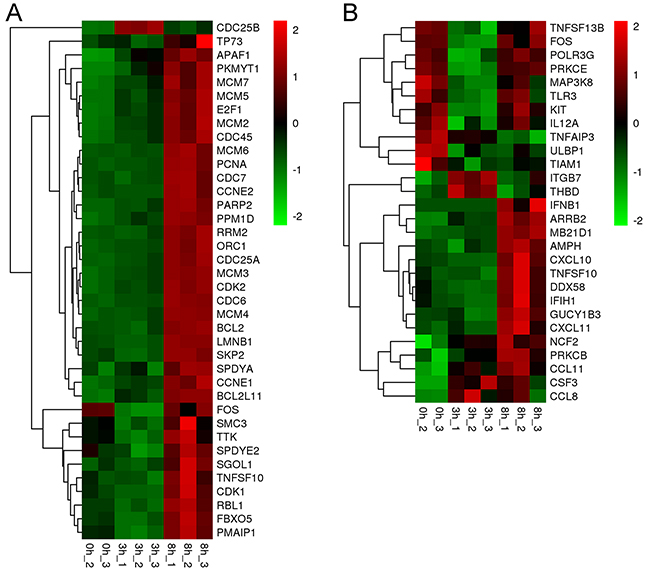
Figure 7: ORFV induced a range of differentially expressed genes associated with “growth and death” and “immune response”. (A) Significantly (fold change>2 or <-2 and corrected p-value<0.05) up-regulated (red) or down-regulated (green) genes for the different pathways associated to growth and death are shown. (B) Significantly up-regulated or down-regulated genes associated with immune response are shown.
RT-PCR analysis
Fifteen detectable genes from Illumina sequencing were randomly chosen to be further verified by quantitative real-time PCR with the same samples used in RNA-SEQ. Up- or down-regulation of the average RT-PCR fold change for the samples were correlated with that in the sequencing results (Figure 8). Only the expression of PLCB2 between the two methods was inconsistent. Although some variations were detected, > 90% of the results were reliable. Therefore, the expression changes of the DEGs indeed existed after orf virus infection.
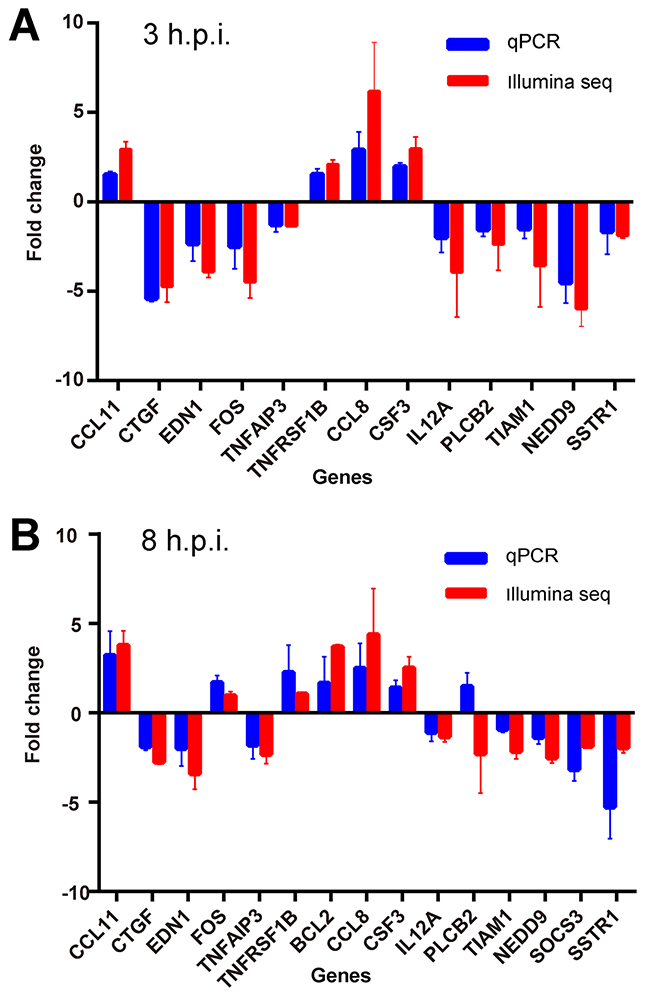
Figure 8: Validation of differentially expressed genes by real-time PCR (RT-PCR). (A) RT-PCR was performed with the same samples used in RNA-SEQ. The average value and standard deviation of the independent experiments for the paired group 0 h.p.i vs. 3 h.p.i are plotted in comparison with the fold increase data obtained from Illumina sequencing. (B) The results of the paired group 0 h.p.i. vs. 8 h.p.i. are shown.
DISCUSSION
In order to understand the intricate interactions between the host and the orf virus, deep sequencing was performed on mRNA libraries of HFF-1 cells incubated with ORFV. Because the virus can replicate and propagate in HFF-1 cells (Supplementary Figure 2A, 2B), we examined the samples at 0, 3 and 8 h.p.i. with ORFV (MOI=5) according to the cytopathic effects (CPE) in cells incubated with serial dilutions of virus at different time phases (Supplementary Figure 2C, 2D). Nine data sets were obtained from the Illumina platform and contained between 17.4 and 22.9 million reads after trimming and removal of low quality reads. When the data was normalized to the uninfected samples, most down-regulated transcripts could be detected at 3 h.p.i. and were seen to be over-expressed at 8 h.p.i. The expression levels of some genes obtained from qPCR were similar to the data of sequencing, suggesting that the expression profiles from RNA-seq were credible. Some variation existed, as expected, due to the concordance of the two methods [10].
Friebe et al. used microarrays to compare the effect of ORFV and active recombinant stimulation on gene expression patterns in mouse peritoneal cells [11]. Their results indicated that different fragments of ORFV induce/inhibit the transcription of similar genes relevant to the protective effects of ORFV. CCL3, IL15_1, CASP11_1, RASA4, and CCL5 were greatly up-regulated by ORFV NZ2 and ORFV D1701, while TGFB2, APRIL, ICAM2 and ITGA6 were strongly down-regulated [11]. However, the genes identified by Friebe et al. exhibited insignificant expression changes in our experimental system. This discrepancy is likely due to the different cell types utilized in the studies. In the present study, 28 immune genes relevant to the protective effects were detected with significant changes during infection. The genes in the toll-like receptor signaling pathway and TNF signaling pathway were inhibited at early stage. Fleming et al. reported that the inflammation response was limited by several ORFV genes which suppress the production of inflammatory factors [12]. For example, the IL-10-like virokine encoded by ORFV127 inhibits the production of proinflammatory cytokines, including TNF-α, IL-8, IFN-γ and GM-CSF, in host cells [13]. ORFV002, 024 and 121 have been reported as inhibitors of the NF-κB signalling pathway, an important inflammatory signaling response to harmful cellular stimuli [14-18]. These results are consistent with our findings at early stage of infection in HFF-1 cells. Following viral replication, the host immune system was activated to stimulate the expression of the genes which invovles in innate and adaptive immunity. Among them, CXCL10, CXCL11 and CCL11 are chemokines that direct cell migration in development, immunity, inflammation and cancer [19]. NCF2, neutrophil cytosolic factor 2, is induced by IFNγ and is specifically expressed in a number of immune-cell types, including B-cells [20]. NCF2 may increase the production of the reactive oxygen species (ROX) which promote B-cell activation and differentiation to increase inflammatory cytokine response and reduce viral burden [21]. IFNB1, the gene of interferon-β, has antiviral, antibacterial and anticancer activities [22, 23]. DDX58 and IFNH1 are innate immune receptors that act as cytoplasmic sensors of viral nucleic acids and play a major role in sensing viral infection. They can activate a cascade of antiviral responses including the induction of type I interferons and proinflammatory cytokines. PRKCB, encoding protein kinase C-beta, plays a key role in B-cell activation by regulating BCR-induced NF-kappa-B activation. This data is consistent with previous reports of host gene expression after vaccinia infection [24]. In accordance with the above results, we propose that the general features of ORFV infection may be shared across cell types. Undoubtedly, the results obtained in fibroblasts may not completely reflect those observed in epithelial cells, which are the natural target cell for the virus in the host.
Interferons play a critical role as a first line of defence against viral infection. The present data shows that the type I interferon response was inhibited early in the infection, which was consistent with previous studies. Harvey et al. [25] showed that ORFV is able to block the expression of IFN stimulated genes and inhibits the JAK/STAT signaling pathway by dephosphorylating STAT1. In this study, we found differentially expressed genes, IL12A and CSF3, which are associated with the JAK/STAT signaling pathway. Orf virus inhibited the expression of IL12A, which can activate the members of the JAK/STAT signaling pathways and induce IFN-gamma production [26]. Another study showed that ORFV057 impaired the JAK/STAT pathway by dephosphorylating STAT1 to inhibit interferon stimulated gene expression [25]. The shorter isoform of the OV020 protein has the capability to bind double-stranded RNA (dsRNA), dsRNA-activated protein kinase (PKR), inactivate PKR, and thus act as an in vitro antagonist of the interferon response [27]. However, the mechanism of the suppression induced by the orf virus requires additional investigation. Interestingly, the expression of associated genes in the type I signaling pathway were up-regulated at 8 h post infection, which may contribute to the activation of host immune system. Among the DEGs, OASL, encoding 2’-5’-oligoadenylate synthetase-like protein, was significantly over-expressed from 3 to 8 hours post-infection (fold change=42.5, corrected p-value <0.001). OASL develops broad antiviral activity against viruses that are primarily sensed through RIG-I [28]. In this study, the associated genes (IFIH1, IFNB1, DDX58, CXCL10 and IL12A) in the RIG-I-like receptor signaling pathway were increased obviously at 8 h post-infection(p<0.05), compared to 3 h post-infection. Viruses can manipulate the immune response of the host by various strategies and the activation of the OASL-pathway may help host cells to overcome viral escape and avoidance of innate immunity.
Infection with orf virus has critical effects in cell cycle progression (Supplementary Table 3). The expression of some genes, which are associated with cell cycle checkpoint and cell cycle arrest, were up-regulated at 8 hours post infection, including CDK2, RBBP8, CDK1, KNTC1, CDC25A, BRCA1, and BRCA2. It is well known that several cyclin-dependent kinases (CDKs) can be activated by CDC25A/B/C in the cell cycle. The up-regulation of CDC25A, being controlled through PI3K-Akt-mTOR signaling, can promote cell proliferation [29]. Orf virus causes localized proliferative skin lesions after infection and the lesions evolve through erythema, papule, vesicle, pustule, and scab formation [30]. The proliferative skin lesions may be attributed to the ORFV-induced promotion of the cell cycle. The ORFV poxvirus anaphase promoting complex regulator (PACR), a homologue of the subunit 11 of anaphase-promoting complex subunit (APC11), is believed to manipulate the cell cycle and enhance viral DNA synthesis by competing with APC11 for incorporation into the anaphase-promoting complex/cyclosome (APC/C) [31]. The anaphase-promoting complex plays a crucial role in cell cycle regulation, including the duration of G0/G1 and the exit from mitosis, by directing the ubiquitin-proteasome-dependent degradation of a range of proteins participating in the cell cycle [32]. The expression of PACR contributes to the creation of a stage of the cell cycle to support viral replication [12]. Meanwhile, the proliferation of infected host cells was activated when anaphase-promoting complex activity was decreased, but with an increased metabolic state. Another study shows that the VEGF-E encoded by the orf virus can regulate keratinocyte proliferation [33]. Its specific expression induces substantial intra-islet endothelial cell proliferation and the formation of hemangioma-like lesions [34]. Whether the VEGF-E protein can manipulate the cell cycle needs to be elucidated through further study. Of course, negative regulation was also activated. For instance, the human Myt1 kinase (PKMYT1) acts as a negative regulator of G2/M transition by phosphorylation of the CDK1 kinase specifically when CDK1 is complexed to cyclins and was up-regulated at 8 h.p.i. [35, 36].
Apoptotic cell death and autophagy are vital host defenses to limit viral replication and can be induced by extracellular inducers such as TNF, apoptosis stimulating fragment ligand and IFN, as well as intracellular pathways activated by macromolecular synthesis of molecules, such as viral dsRNA, after infection [12]. A range of apoptotic genes were increased with an average fold change >2 and q<0.05 after infection with orf virus. The elevated expression of the genes may have resulted in the activation of caspases that subsequently cleave a variety of cellular proteins, leading to cell death. For instance, TNFSF10 encodes a cytokine that binds to its receptor to induce apoptosis. P53 signaling pathway was activated to regulate apoptosis by orf virus. CCNE1, CCNE2, CDK1, CDK2, TP73, RRM2, APAF1, PPM1D, and PMAIP1 were up-regulated at 8 h.p.i. PMAIP1 is a gene which promotes activation of caspases and apoptosis by altering the mitochondrial membrane and efflux of apoptogenic proteins. Apoptotic peptidase activating factor 1 (Apaf-1) is an important regulator of the mitochondrial apoptotic pathway to induce programmed cell death [37, 38]. In the present study, Bcl-2, an anti-apoptotic member of the Bcl-2 family, was up-regulated. Proteins of the Bcl-2 family play a key role in specifically regulating mitochondrial apoptosis. The up-regulation of Bcl-2 may be associated with an anti-apoptotic factor of ORFV encoded by genes such as ORFV125. ORFV125 encoded protein inhibits apoptosis by translocating to the mitochondria and blocking the release of cytochrome C [39].
In summary, this study provides an in-depth analysis of the differences in genome expression profiles of human foreskin fibroblast cells infected with orf virus strain OV-GO. A number of differential genes associated with signal transduction, cell cycle, antiviral immune response and virus-induced apoptosis were identified. A range of immune genes were up-regulated to activate the innate and adaptive immunity. Meanwhile, the cell cycle program was promoted after infection, which may be due to some ORFV immunomodulatory genes. Immunomodulatory molecules of the orf virus might affect the quality of the immune response induced by host cells. ORFV may be an effective vaccine, with some reasonable gene modifications, against a broad spectrum of pathogens and tumors.
MATERIALS AND METHODS
Virus and cell line
The OV-GO strain of ORFV was isolated from a goat in the Fujian province of China that had been diagnosed with orf [40, 41]. The virus strain was grown and tittered as described previously [42]. Human foreskin fibroblast (HFF-1) cell line was obtained from ATCC (Manassas, VA, USA). HFF-1 cells were cultured at 37°C in DMEM complemented with 15% FBS (Gemini, USA), containing penicillin (100 U/ml) and streptomycin (100µg/ml).
Cell cultures, RNA extraction, mRNA-Seq
HFF-1 cells were stimulated for 0, 3 or 8 hours with live ORFV at a multiplicity of infection (MOI) of 5. Following the incubation, total RNA was extracted using TRIZOL Reagent (Life Technologies, USA), according to the manufacturer’s instructions. The quantity and quality of the samples were determined on a NanoDrop ND-2000 and Agilent Bioanalyzer 2100 (RIN>9.5, 28S/18S>=1.6). Oligo-dT coated magnetic beads were used to isolate the poly-A containing mRNA molecules. Following purification, the mRNA was fragmented into small pieces and reverse transcribed into double-stranded cDNA fragments. After an end repair process and the addition of a single ‘A’ base, the cDNA fragments were ligated to the Illumina adapters. The products were purified and enriched via PCR to create the final cDNA library. The quantification and qualification of the library were carried out using Qubit® 2.0 Fluorometer and Agilent Bioanalyzer 2100 (con.=3.5-5.8ng/μL, peak length.=347-367 bp). The cDNA libraries were pooled at a concentration of 10 pM prior to clustering. Single-end read sequencing (20 million, 50 bp, single-end reads) was performed on an Illumina HiSeq2500 sequencer.
Bioinformatics analyses of the transcriptome data
To trim adapters, PCR primer sequences, ribosome RNA and low quality base reads, the raw RNA-seq reads were processed with the FASTX-Toolkit. Reads with a length less than 25 nt were discarded. The clean reads were mapped to the hg19 human reference genome (http://hgdownload.cse.ucsc.edu/goldenPath/hg19/bigZips/chromFa.tar.gz) using TopHat version 2, allowing for 2 nt of mismatch [43]. For a better comparison of the gene expression levels across different genes and different samples, the counts of each unigene in each sample were normalized using trimmed mean of M-values (TMM). FPKM (fragments per kilobase of exon model per million mapped reads) value was used to calculate the expression level for each gene [44-46]. The data were normalized to the RNA-seq data from the HFF-1 samples without incubation with orf virus (or samples 3 hours post-infection.). False discovery rates were computed by the EdgeR package, which was used to estimate the common dispersion [47]. Genes with a q-value (corrected p-value) less than 0.05 and a fold change greater than 2 were categorized as differentially expressed. All the identified differentially expressed genes (DEGs) were mapped to the terms in GO database to analyze functional significance. The DEGs were also mapped to terms in the KEGG PATHWAY Database for pathway analysis. The principle component analysis (PCA), cluster and trend analyses were performed using the OmicShare tools, a free online platform for data analysis (www.omicshare.com/tools).
Quantitative real-time RT-PCR
The total RNA for each sample was used to prepare cDNA with the cDNA Synthesis Kit (Biotool, USA), according to the manufacturer’s protocol. Real-time quantitative PCR (RT-PCR) was performed using the TransStart Tip Green qPCR SuperMix Kit (Transgen, China), according to the manufacturer’s instructions, with the appropriate primers (Supplementary Table 5). Briefly, the reaction protocol was 30 s at 94oC, 43 cycles of 5 s at 94 °C and 34 s at 60 °C. The relative quantitation was performed using the ΔΔCt method and the expression of detectable genes was normalized to the reference gene β-actin. The qPCR experiments were carried out in quadruplicate with 3 independent repeats. Expression level of the genes are shown as the normalized cycle threshold (ΔCt = Ct target gene – Ct reference gene, ΔΔCt = ΔCt post-infection – ΔCt un-infected) [48].
Western blots
Western blots were used to assess the expression level of ORFV protein. HFF-1 cells were incubated with ORFV at 0, 6, 12, 24, 36, and 48 h. The infected cells were lysed in 1× loading buffer and boiled for 15min before centrifugation. The samples were resolved by SDS-PAGE in 10% gels, followed by blotting to PVDF membranes. Then the membranes were blocked with 5% skim milk and probed with antibody anti-ORFV086 and anti-ORFV079. After washing, the blots were incubated with secondary goat anti-rabbit IgG-(HRP). Finally, they were washed and developed using a chemiluminescent substrate.
Statistical analysis
An empirical Bayesian analysis was used to shrink the dispersions towards a consensus value, effectively borrowing information between genes [46, 49]. Differential expression was assessed for each gene using an exact test analogous to Fisher’s exact test [46, 50]. Genes with a q-value lower than 0.05 and with a fold change greater than 2 were considered differentially expressed.
Author contributions
Shuhong Luo, Wenbo Hao, Ming Li, Yingsong Wu and Daniel L Rock participated in design of the study. Daxiang Chen, Mingjian Long, Bin Xiao, Yu Chen, Yufeng Xiong, Huiqin Chen, Zhenzhan Kuang, Daoyuan Gong, Haijian He,Yong Wang, and Fang Liu performed the experiments. Daxiang Chen, Shuhong Luo, Wenbo Hao and Bin Xiao analyzed the data and wrote the manuscript. All authors have read and approved the final manuscript.
ACKNOWLEDGMENTS
The authors are grateful to Xuexi Yang for his suggestions and support in preparing this paper.
CONFLICTS OF INTEREST
The authors declare no conflicts of interest.
FUNDING
This study was supported by grants (No. 31672536 and No.31170147) from the National Natural Science Foundation of China (NSFC). This project was partially supported by the Foshan University senior talent start fund (20161110004) and the Foshan University high-level university fund (20170131020).This project was partially supported by the Agriculture and Food Research Initiative Competitive Grant no. 2012- 67015-19289 from the USDA National Institute of Food and Agriculture. The funders had no role in study design, data collection and analysis, decision to publish or preparation of the manuscript.
REFERENCES
1. Spyrou V, Valiakos G. Orf virus infection in sheep or goats. Vet Microbiol. 2015; 181:178–82.
2. Büttner M, Rziha HJ. Parapoxviruses: from the lesion to the viral genome. J Vet Med B Infect Dis Vet Public Health. 2002; 49:7–16.
3. Thurman RJ, Fitch RW. Images in clinical medicine. Contagious ecthyma. N Engl J Med. 2015; 372:e12.
4. Peng F, Chen Z, Zheng SY, Li HM, Du J, Zhang JZ. A Case of Orf Identified by Transmission Electron Microscopy. Chin Med J (Engl). 2016; 129:108–09.
5. Rajkomar V, Hannah M, Coulson IH, Owen CM. A case of human to human transmission of orf between mother and child. Clin Exp Dermatol. 2016; 41:60–63.
6. Lederman ER, Green GM, DeGroot HE, Dahl P, Goldman E, Greer PW, Li Y, Zhao H, Paddock CD, Damon IK. Progressive ORF virus infection in a patient with lymphoma: successful treatment using imiquimod. Clin Infect Dis. 2007; 44:e100–03.
7. Weber O, Mercer AA, Friebe A, Knolle P, Volk HD. Therapeutic immunomodulation using a virus—the potential of inactivated orf virus. Eur J Clin Microbiol Infect Dis. 2013; 32:451–60.
8. Rintoul JL, Lemay CG, Tai LH, Stanford MM, Falls TJ, de Souza CT, Bridle BW, Daneshmand M, Ohashi PS, Wan Y, Lichty BD, Mercer AA, Auer RC, et al. ORFV: a novel oncolytic and immune stimulating parapoxvirus therapeutic. Mol Ther. 2012; 20:1148–57.
9. Tai LH, de Souza CT, Bélanger S, Ly L, Alkayyal AA, Zhang J, Rintoul JL, Ananth AA, Lam T, Breitbach CJ, Falls TJ, Kirn DH, Bell JC, et al. Preventing postoperative metastatic disease by inhibiting surgery-induced dysfunction in natural killer cells. Cancer Res. 2013; 73:97–107.
10. Wang C, Gong B, Bushel PR, Thierry-Mieg J, Thierry-Mieg D, Xu J, Fang H, Hong H, Shen J, Su Z, Meehan J, Li X, Yang L, et al. The concordance between RNA-seq and microarray data depends on chemical treatment and transcript abundance. Nat Biotechnol. 2014; 32:926–32.
11. Friebe A, Friederichs S, Scholz K, Janssen U, Scholz C, Schlapp T, Mercer A, Siegling A, Volk HD, Weber O. Characterization of immunostimulatory components of orf virus (parapoxvirus ovis). J Gen Virol. 2011; 92:1571–84.
12. Fleming SB, Wise LM, Mercer AA. Molecular genetic analysis of orf virus: a poxvirus that has adapted to skin. Viruses. 2015; 7:1505–39.
13. Haig DM, Thomson J, McInnes CJ, Deane DL, Anderson IE, McCaughan CA, Imlach W, Mercer AA, Howard CJ, Fleming SB. A comparison of the anti-inflammatory and immuno-stimulatory activities of orf virus and ovine interleukin-10. Virus Res. 2002; 90:303–16.
14. Diel DG, Delhon G, Luo S, Flores EF, Rock DL. A novel inhibitor of the NF-{kappa}B signaling pathway encoded by the parapoxvirus orf virus. J Virol. 2010; 84:3962–73.
15. Diel DG, Luo S, Delhon G, Peng Y, Flores EF, Rock DL. A nuclear inhibitor of NF-kappaB encoded by a poxvirus. J Virol. 2011; 85:264–75.
16. Diel DG, Luo S, Delhon G, Peng Y, Flores EF, Rock DL. Orf virus ORFV121 encodes a novel inhibitor of NF-kappaB that contributes to virus virulence. J Virol. 2011; 85:2037–49.
17. Ning Z, Zheng Z, Hao W, Duan C, Li W, Wang Y, Li M, Luo S. The N terminus of orf virus-encoded protein 002 inhibits acetylation of NF-κB p65 by preventing Ser(276) phosphorylation. PLoS One. 2013; 8:e58854.
18. Chen D, Zheng Z, Xiao B, Li W, Long M, Chen H, Li M, Rock DL, Hao W, Luo S. Orf Virus 002 Protein Targets Ovine Protein S100A4 and Inhibits NF-κB Signaling. Front Microbiol. 2016; 7:1389.
19. Kufareva I. Chemokines and their receptors: insights from molecular modeling and crystallography. Curr Opin Pharmacol. 2016; 30:27–37.
20. Cunninghame Graham DS, Morris DL, Bhangale TR, Criswell LA, Syvänen AC, Rönnblom L, Behrens TW, Graham RR, Vyse TJ. Association of NCF2, IKZF1, IRF8, IFIH1, and TYK2 with systemic lupus erythematosus. PLoS Genet. 2011; 7:e1002341.
21. Vené R, Delfino L, Castellani P, Balza E, Bertolotti M, Sitia R, Rubartelli A. Redox remodeling allows and controls B-cell activation and differentiation. Antioxid Redox Signal. 2010; 13:1145–55.
22. Gonzales-van Horn SR, Farrar JD. Interferon at the crossroads of allergy and viral infections. J Leukoc Biol. 2015; 98:185–94.
23. Qin XQ, Beckham C, Brown JL, Lukashev M, Barsoum J. Human and mouse IFN-beta gene therapy exhibits different anti-tumor mechanisms in mouse models. Mol Ther. 2001; 4:356–64.
24. Guerra S, Nájera JL, González JM, López-Fernández LA, Climent N, Gatell JM, Gallart T, Esteban M. Distinct gene expression profiling after infection of immature human monocyte-derived dendritic cells by the attenuated poxvirus vectors MVA and NYVAC. J Virol. 2007; 81:8707–21.
25. Harvey R, McCaughan C, Wise LM, Mercer AA, Fleming SB. Orf virus inhibits interferon stimulated gene expression and modulates the JAK/STAT signalling pathway. Virus Res. 2015; 208:180–88.
26. Gee K, Guzzo C, Che Mat NF, Ma W, Kumar A. The IL-12 family of cytokines in infection, inflammation and autoimmune disorders. Inflamm Allergy Drug Targets. 2009; 8:40–52.
27. Tseng YY, Lin FY, Cheng SF, Tscharke D, Chulakasian S, Chou CC, Liu YF, Chang WS, Wong ML, Hsu WL. Functional analysis of the short isoform of orf virus protein OV20.0. J Virol. 2015; 89:4966–79.
28. Zhu J, Ghosh A, Sarkar SN. OASL-a new player in controlling antiviral innate immunity. Curr Opin Virol. 2015; 12:15–19.
29. Fernandez-Vidal A, Ysebaert L, Didier C, Betous R, De Toni F, Prade-Houdellier N, Demur C, Contour-Galcéra MO, Prévost GP, Ducommun B, Payrastre B, Racaud-Sultan C, Manenti S. Cell adhesion regulates CDC25A expression and proliferation in acute myeloid leukemia. Cancer Res. 2006; 66:7128–35.
30. Haig DM, Mercer AA. Ovine diseases. Orf. Vet Res. 1998; 29:311–26.
31. Mo M, Fleming SB, Mercer AA. Orf virus cell cycle regulator, PACR, competes with subunit 11 of the anaphase promoting complex for incorporation into the complex. J Gen Virol. 2010; 91:3010–15.
32. Pines J. Cubism and the cell cycle: the many faces of the APC/C. Nat Rev Mol Cell Biol. 2011; 12:427–38.
33. Wise LM, Inder MK, Real NC, Stuart GS, Fleming SB, Mercer AA. The vascular endothelial growth factor (VEGF)-E encoded by orf virus regulates keratinocyte proliferation and migration and promotes epidermal regeneration. Cell Microbiol. 2012; 14:1376–90.
34. Fagiani E, Lorentz P, Bill R, Pavotbawan K, Kopfstein L, Christofori G. VEGF receptor-2-specific signaling mediated by VEGF-E induces hemangioma-like lesions in normal and in malignant tissue. Angiogenesis. 2016; 19:339–58.
35. Rohe A, Erdmann F, Bäßler C, Wichapong K, Sippl W, Schmidt M. In vitro and in silico studies on substrate recognition and acceptance of human PKMYT1, a Cdk1 inhibitory kinase. Bioorg Med Chem Lett. 2012; 22:1219–23.
36. Toledo CM, Ding Y, Hoellerbauer P, Davis RJ, Basom R, Girard EJ, Lee E, Corrin P, Hart T, Bolouri H, Davison J, Zhang Q, Hardcastle J, et al. Genome-wide CRISPR-Cas9 Screens Reveal Loss of Redundancy between PKMYT1 and WEE1 in Glioblastoma Stem-like Cells. Cell Reports. 2015; 13:2425–39.
37. De Zio D, Maiani E, Cecconi F. Apaf1 in embryonic development - shaping life by death, and more. Int J Dev Biol. 2015; 59:33–39.
38. Campioni M, Santini D, Tonini G, Murace R, Dragonetti E, Spugnini EP, Baldi A. Role of Apaf-1, a key regulator of apoptosis, in melanoma progression and chemoresistance. Exp Dermatol. 2005; 14:811–18.
39. Westphal D, Ledgerwood EC, Hibma MH, Fleming SB, Whelan EM, Mercer AA. A novel Bcl-2-like inhibitor of apoptosis is encoded by the parapoxvirus ORF virus. J Virol. 2007; 81:7178–88.
40. Chi X, Zeng X, Li W, Hao W, Li M, Huang X, Huang Y, Rock DL, Luo S, Wang S. Genome analysis of orf virus isolates from goats in the Fujian Province of southern China. Front Microbiol. 2015; 6:1135.
41. Chi X, Zeng X, Hao W, Li M, Li W, Huang X, Wang S, Luo S. Heterogeneity among orf virus isolates from goats in Fujian Province, Southern China. PLoS One. 2013; 8:e66958.
42. Li W, Ning Z, Hao W, Song D, Gao F, Zhao K, Liao X, Li M, Rock DL, Luo S. Isolation and phylogenetic analysis of orf virus from the sheep herd outbreak in northeast China. BMC Vet Res. 2012; 8:229.
43. Trapnell C, Pachter L, Salzberg SL. TopHat: discovering splice junctions with RNA-Seq. Bioinformatics. 2009; 25:1105–11.
44. Mortazavi A, Williams BA, McCue K, Schaeffer L, Wold B. Mapping and quantifying mammalian transcriptomes by RNA-Seq. Nat Methods. 2008; 5:621–28.
45. Anders S, Pyl PT, Huber W. HTSeq—a Python framework to work with high-throughput sequencing data. Bioinformatics. 2015; 31:166–69.
46. Robinson MD, Oshlack A. A scaling normalization method for differential expression analysis of RNA-seq data. Genome Biol. 2010; 11:R25.
47. Benjamini Y, Drai D, Elmer G, Kafkafi N, Golani I. Controlling the false discovery rate in behavior genetics research. Behav Brain Res. 2001; 125:279–84.
48. Pretorius A, Faber FE, van Kleef M. Immune gene expression profiling of PBMC isolated from horses vaccinated with attenuated African horsesickness virus serotype 4. Immunobiology. 2016; 221:236–44.
49. Robinson MD, Smyth GK. Moderated statistical tests for assessing differences in tag abundance. Bioinformatics. 2007; 23:2881–87.
50. Robinson MD, Smyth GK. Small-sample estimation of negative binomial dispersion, with applications to SAGE data. Biostatistics. 2008; 9:321–32.