
INTRODUCTION
As the second most common genitourinary malignancy, bladder cancer (BC) is a significant public health problem worldwide, with urothelial cell carcinoma (UC) accounting for nearly 90% of all primary BCs [1] and muscle-invasive BC (MIBC) for approximately 25 % of high mortality BCs. Clinical presentation is heterogeneous, and despite the availability of accurate histology-based classification systems it is difficult to predict prognosis and response to therapy. BC diagnosis is based on a combination of urine cytology, cystoscopy, and bladder biopsy. However, urine cytology is poorly sensitive to early, low-grade lesions, whereas cystoscopy is invasive, expensive, and only detects large lesions [2, 3].
Human trophoblast cell surface antigen 2 (Trop-2), a 40-kDa transmembrane glycoprotein encoded by the TACSTD2 gene [4], has first been identified in human trophoblast and choriocarcinoma cell lines [5]. Its short intracytoplasmic tail has a key role in controlling several pathways that regulate cellular functions such as cell-cell adhesion, cell proliferation, and mobility [6, 7]. Trop-2 protein expression is often increased in a variety of epithelial cancers [8, 9]. A role as a marker of human prostate cancer stem cells has been proposed for it, particularly in cancer initiation and progression [10–12]. Trop-2 overexpression has been correlated with an aggressive malignant phenotype and poor prognosis [13–19]. The data reviewed above have made it an attractive diagnostic and prognostic marker candidate. Recently, Trop-2 is also being tested as a druggable target, since an anti-Trop-2 antibody-drug conjugate is being used to treat patients with several metastatic neoplasms, including triple-negative breast cancer and non-small-cell and small-cell lung cancer [20].
MicroRNAs (miRNAs) are short, non-coding RNAs that have attracted strong interest for their ability to affect the post-transcriptional stability of target mRNAs [21, 22]. Alteration of their expression has been described in several human diseases including cancer [23–29]. In particular, miR-125b is deregulated in a variety of malignancies, where it acts both as a tumour suppressor and as a promoter [30, 31]. MiR-125b is significantly down-modulated in BC bladder tissue compared with normal tissue [32]. A recent miRNA profiling and bioinformatic study has suggested that miR-125b-5p, along with CDK4 and CDK6 genes, may be involved in the BC pathway [33], and a subsequent investigation has associated it with MIBC progression and aggressiveness [34]. Moreover, according to recent evidence Trop-2 is a miR-125b target [35], but no data are available on the modulation of Trop-2/miR-125b in human BC. In this study, the levels of Trop-2 and miR-125b were investigated in normal bladder tissue and in urothelium from BC patients, to explore their potential as new diagnostic/prognostic biomarkers.
RESULTS
Tissue samples
A consecutive series of 40 samples was analysed. They were 9 specimens of healthy tissue, 21 specimens of non-invasive BC and 10 specimens of invasive BC collected from 40 subjects, of whom 31 (77.5%) were males (respectively n=6, n=18, and n=7). No significant association was detected between BC group and gender and there were no significant differences in age distribution between controls and cases.
Trop-2 expression in normal and cancer tissue
To determine whether Trop-2 protein levels were altered in human BC, Trop-2 immunostaining was performed in control and BC tissue. Normal human skin was used as a positive control (Figure 1A).
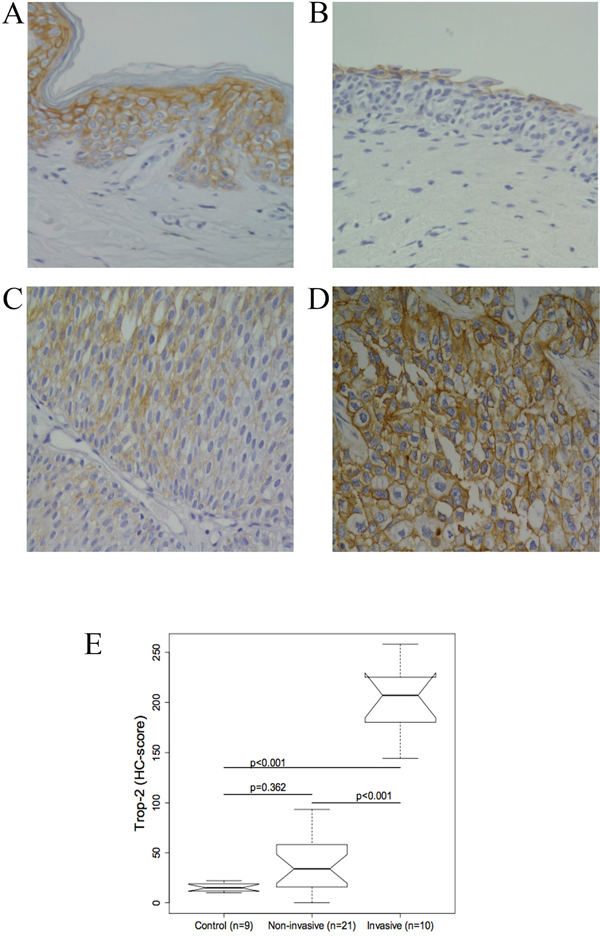
Figure 1: Representative immunohistochemical Trop-2 staining in normal bladder tissue and urothelium from patients with bladder cancer (BC). (A) Normal human skin was the positive control. (B) Normal bladder urothelium: Trop-2 expression in superficial urothelial cells. (C) Non-invasive BCs: cells are moderately stained. (D) Invasive BCs: strong Trop-2 expression. (original magnification, 40×) (E) Boxplot of the Trop-2 immunohistochemical score (HC score). Trop-2 protein staining was significantly different between invasive BCs and controls and between non-invasive and invasive BCs (all p<0.001). The difference between controls and non-invasive BCs was not significant (p = 0.362).
In normal tissue, Trop-2 staining was mainly confined to the superficial layer of the bladder urothelium, while stromal and endothelial cells were not stained. The immunostaining was strong in the superficial layer and very weak in the deeper layer (Figure 1B, 1E).
Different levels of Trop-2 were measured in different tumour stages. Compared with normal tissue Trop-2 levels were higher in non-invasive BC types (PUNLMP, and low- and high-grade papillary urothelial cancer) (Figure 1C, 1E), where staining of tumour cells ranged from negative to intermediate (Figure 1C). The invasive BCs showed Trop-2 protein overexpression that peaked in the cells invading the muscle (Figure 1D).
Trop-2 expression was significantly higher in invasive BCs compared both with normal bladder and with non-invasive BCs (both p ≤ 0.001), thus positively correlating with disease severity, whereas the difference between control and non-invasive BC tissue was not significant (Figure 1E).
MiR-125b expression and correlation with Trop-2 levels in bladder tissue
The possible role of miR-125b as a modulator of Trop-2 in urothelial BC was explored by measuring miR-125b levels in bladder tissue using real-time qPCR. MiR-125b expression was significantly lower in non-invasive (p ≤ 0.001) as well as invasive BCs (p=0.005) compared with control specimens, whereas the difference between invasive and non-invasive BCs was not significant (Figure 2). Quantile regression analysis showed significantly higher Trop-2 values in invasive BCs compared with the control group in all three quartiles, whereas Trop-2 values in the non-invasive BC group were significantly higher only in the 3rd quartile. Moreover, a significant negative association between log (miR-125b) and Trop-2 was found in the 3rd quartile (Figure 3, Table 1). The present findings show that miR-125b up-regulation checks Trop-2 expression.
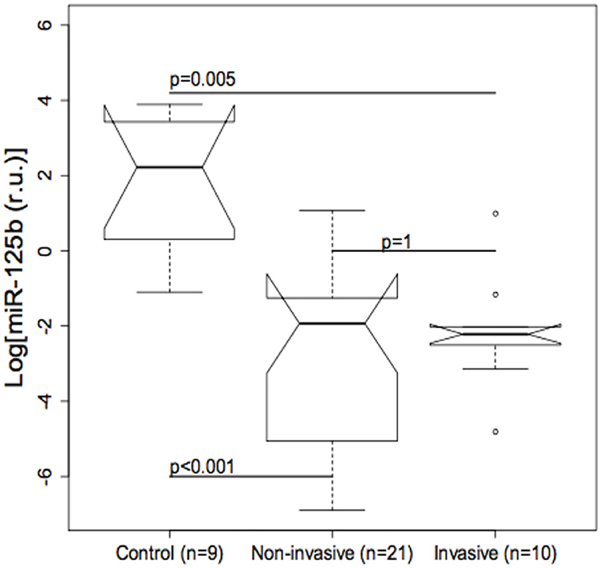
Figure 2: Boxplot of miR-125b values in bladder tumour and control tissue. The difference between non-invasive (p<0.001) and invasive (p=0.005) urothelial bladder cancers (BCs) compared with controls is significant, whereas the difference between non-invasive and invasive BCs is not significant.
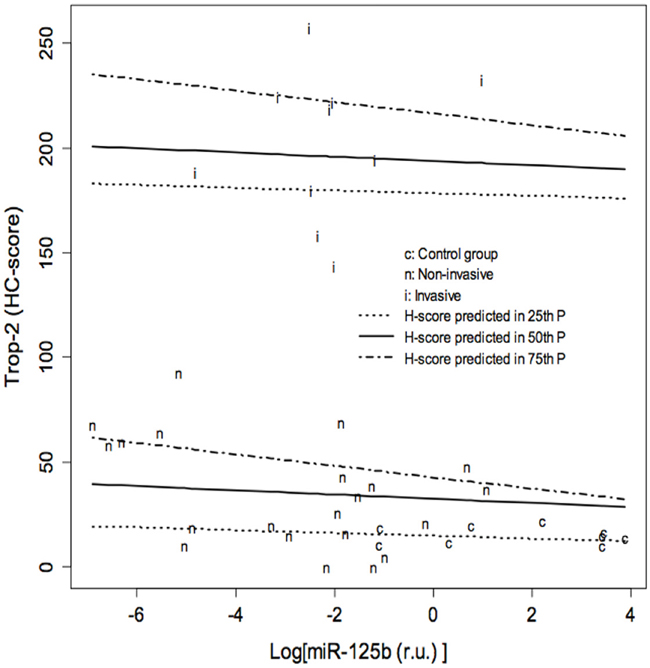
Figure 3: Results of quantile regression analysis of the effect of log (miR-125b) on the Trop-2 immunohistochemical score (HC score) in the three groups of specimens. Results of quantile regression analysis for each quartile. The Trop-2 values of invasive bladder cancers (BC) are significantly higher compared to the control group in all three quartiles, whereas the values of non-invasive BCs are significantly higher only in the 3rd quartile. A significant negative association between log (miR-125b) and Trop-2 is found in the 3rd quartile. CI: Confidence Intervals. t= 0.25, t= 0.5, t=0.75: 25th, 50th and 75th percentiles of HC score distribution, respectively.
Table 1: Results of quantile regression analysis of the effect of log (miR-125b) on the Trop-2 immunohistochemical score (HC score) in the three groups of specimens
τ= 0.25 |
τ= 0.5 |
τ= 0.75 |
||||
|---|---|---|---|---|---|---|
Regression |
95% CI |
Regression |
95% CI |
Regression |
95% CI |
|
Group: Non-invasive vs Control |
2.64 |
-15.72; 15.51 |
14.55 |
-25.01; 25.55 |
18.22 |
0.03; 41.73 |
Group: Invasive vs Control |
166 |
137; 193 |
176 |
131; 212 |
192 |
182; 214 |
Log [miR-125b (r.u.)] |
-0.65 |
-6.48; 2.2 |
-1.01 |
-5.9; 1.77 |
-2.72 |
-4.82; -1.22 |
MiR-125b expression and correlation with Trop-2 level in cell cultures and their role in proliferation and migration
Transfection with a miR-125b mimic induced a very similar effect as endogenous miR-125b expression. The miR-125b overexpression induced by transient transfection was associated with a significant Trop-2 protein reduction in UROtsa (Figure 4A, 4C) and TCCSUP cells (Figure 4B, 4D).
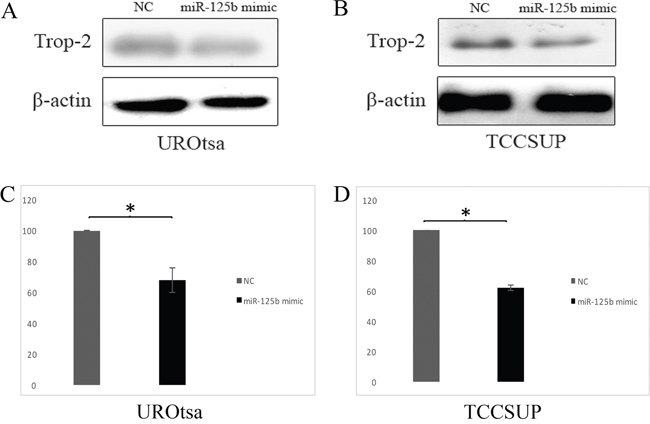
Figure 4: Effects of miR-125b on Trop-2 expression in transfected UROtsa and TCCSUP cells and negative control (NC). (A) Representative western blot of Trop-2 in UROtsa cells transfected with a miR-125b mimic and NC. (B) Representative western blot of Trop-2 in TCCSUP cells transfected with a miR-125b mimic and NC. (C) Densitometry graph of Trop-2 expression in UROtsa cells. (D) Densitometry graph of Trop-2 expression in TCCSUP cells. Trop-2 is significantly downregulated by the action of miR-125b both in UROtsa (A, C) and TCCSUP (B, D) cells. Data are expressed as percentage of Trop-2 expression in cells transfected with miR-125b compared to cells transfected with the NC (considered as 100%). P values are from paired samples t-test. *p≤0.01.
In UROtsa cells transfected with the miR-125b mimic, a significant reduction in the proliferation rate was measured between 48 h and 72 h compared with the cells transfected with the negative control (p ≤ 0.05, Figure 5A), whereas the growth rate of TCCSUP cells was not significantly affected (Figure 5B). In the wound healing assay, transfected UROtsa cells were not significantly different from control cells (Figure 6A, 6B), whereas transfected TCCSUP cells showed a significantly lower migration rate compared with control cells 12 h after incubation (Figure 6C, 6D); however, 24 h after incubation, they cells filled the wound in both conditions.
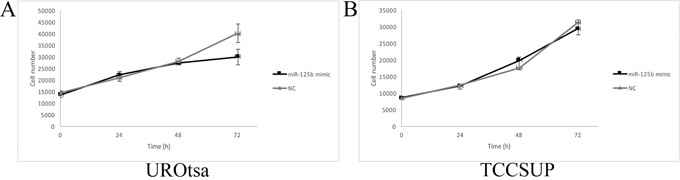
Figure 5: Cell growth curves of transfected UROtsa (A) and TCCSUP (B) cells. (A) In UROtsa cells growth was modulated by the miR-125b mimic 72 h after transfection compared to cells transfected with the negative control (NC). (n=5) p≤0.03 (B) In TCCSUP cells there were no differences between cells transfected with the miR-125b mimic and NC. (n=5) p≥0.05.
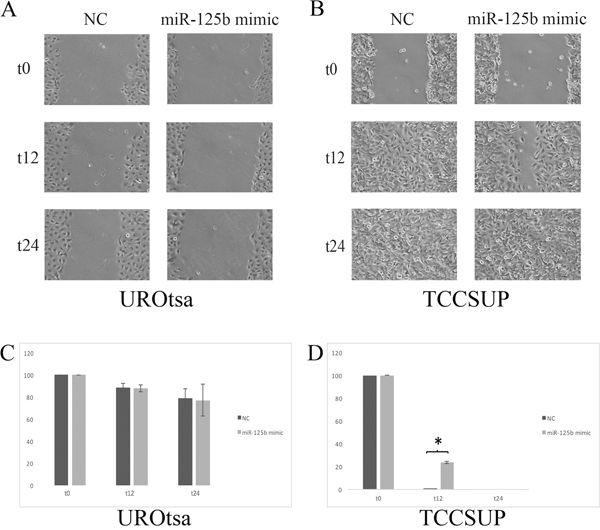
Figure 6: (A) Effect of transient transfection on UROtsa cell mobility assessed with the wound healing assay. (B) There are no significant differences. (C) Transient transfection of TCCSUP cells with miR-125b enhanced wound closure. Wound closure is complete at t24 hours. At t12 hours (D) there was a significant difference (*=p≤0.05) between TCCSUP cells transfected with the negative control (NC) and those transfected with the miR-125b mimic.
DISCUSSION
Trop-2 protein participates in cellular process involved in tumour development and progression, such as proliferation and mobility [7–19]. Drugs targeting Trop-2 are a novel anti-cancer therapeutic strategy [20]. However, there are no data regarding Trop-2 in BC. This study shows for the first time that Trop-2 expression increases with increasing BC severity, showing a weak expression in normal bladder and a strong expression in invasive BC. Following the demonstration that Trop-2 mRNA is a target for miR-125b in head and neck squamous cell carcinoma [35], we decided to analyse the Trop-2/miR-125b axis in several types of BC. An inverse correlation was detected between Trop-2 and miR-125b expression, that was particularly strong in invasive BCs. These data suggest that Trop-2 is a target of miR-125b also in the bladder. To validate these findings, two different cell lines, UROtsa and TCCSUP cells, were employed in functional studies. Using transfection, we demonstrated that Trop-2 is a miR-125b target in both cell lines, which suggests that miR-125b plays a role in modulating Trop-2 protein expression in both normal bladder and cancer cell lines. Trop-2 expression decreased when cells were transfected with miR-125b, supporting the evidence obtained in bladder tissue. Moreover, since Trop-2 is crucially involved in cell proliferation and motility [7, 9, 12], we investigated the role of miR-125b in UROtsa and TCCSUP cell proliferation and motility by transfecting them with a miR-125b mimic. The results of this assay confirmed that the up-regulation of miR-125b and the consequent down-regulation of Trop-2 correlated with a reduced proliferation rate, suggesting that Trop-2 enhances urothelial cell proliferation. In addition, wound healing assay with transiently transfected cells showed that the miR-125b up-regulation and Trop-2 down-regulation inhibited cell migration suggesting that Trop-2 enhances bladder cell proliferation rate and motility. Interestingly, the cell proliferation and migration assays confirmed the immunohistochemical findings obtained in tissue sections, showing significantly increased Trop-2 levels and miR-125b down-regulation in the invasive BC types. The present data agree with the oncogenic role of Trop-2 proposed by Nakanishi and co-workers [35], reinforcing the notions that it plays a pivotal role in cancer pathogenesis and that miR-125b could be a modulator of this process. These findings are also consistent with a role for miR-125b in cancer development and progression, described in previous papers [36–42]. In particular, Zhao et al. [43] showed that overexpression of miR-125b significantly inhibited cell growth and suppressed migratory ability by Sphingosine Kinase 1 (SphK1) down-regulation in T24 bladder cancer cell line. Although we have used two different cell lines, the above reported data support our findings on miR-125b involvement in bladder cancer progression confirming the role of Trop-2 as oncogene. It is known that the majority of miRNAs does not act alone but in cluster and that each miRNA has more than one target. It is reasonable to think that the upregulation of miR-125b expression alters the balance between miRNAs/mRNA targets clusters thus resulting in a significant effect on a set of proteins. In conclusion, one of the most important novelty of our work is the identification and validation of a new target of miR-125b, like Trop2, in the context of BC, thus confirming an important role of both molecules in BC development.
Future studies should address the identification of other miRNAs involved in Trop-2 modulation in BC development and progression and evaluate the relevance of miRNAs as diagnostic/prognostic markers and as druggable targets for innovative therapeutic approaches.
MATERIALS AND METHODS
Tissue sample analysis
The procedure for this research project complies with the World Medical Association Declaration of Helsinki (World Medical Association. https://www.wma.net/policies-post/wma-declaration-of-helsinki-ethical-principles-for-medical-research-involving-human-subjects/. Accessed 25 Feb 2016.). All procedures were performed according to relevant national regulations and institutional guidelines. The study was approved by the Ethics committee on investigations involving human samples (Università Politecnica delle Marche, Italy). The study included 31 tissue specimens of UC (Table 2) and 9 specimens of normal urothelium. All specimens came from consecutive specimens collected from the Department of Urology (Università Politecnica delle Marche–United Hospitals, Ancona, Italy) and were processed and analysed at the Pathological Anatomy Section of the same institution. Patients’ clinical data were obtained from the records of the Pathological Anatomy Section. Tumour staging was according to the 2010 TNM classification system [44], whereas the BC histopathological classification was according to the 2016 World Health Organization [45]. All samples were fixed in 4 % neutral buffered formaldehyde solution for approximately 24 h before processing. Specimens were then routinely processed for paraffin embedding at temperatures not exceeding 56 °C. The diagnosis was made on sections stained with haematoxylin-eosin.
Table 2: Histological characteristics
Characteristics |
No. of cases n=31 |
|---|---|
Histological grade |
|
PUNLMP |
9 |
Papillary low-grade |
6 |
Papillary high-grade |
6 |
Invasive |
10 |
pT category |
|
Ta |
18 |
T1 |
3 |
T2b |
3 |
T3a |
1 |
T3b |
4 |
T4a |
2 |
pN (n=10) |
|
Nx |
1 |
N0 |
1 |
N1 |
1 |
N2 |
7 |
Immunohistochemical procedures
Immunohistochemical staining was performed in 4-μm-thick paraffin-embedded tissue sections. Sections were deparaffinized and rehydrated with xylene and a graded series of ethyl alcohols (from 100 % to 50 %) before incubation with 3 % hydrogen peroxide for 30 min to block endogenous peroxidase activity. Non-specific antibody binding was blocked with normal goat serum diluted 1:75 (30 min at room temperature). Afterwards, sections were incubated overnight at 4 °C with anti-Trop-2 mouse monoclonal antibody (no. SC-376181, Santa Cruz Biotechnology, Dallas, TX, USA) diluted 1:200 in phosphate buffered saline (PBS). After washing in PBS, the antigen was visualized by the streptavidin-biotin-peroxidase complex method (Vector Laboratories, Burlingame, CA, USA) using a biotinylated goat anti-mouse secondary antibody diluted 1:200. 3’, 3’- diaminobenzidine hydrochloride (Sigma-Aldrich, St Louis, MO, USA) was used as the chromogen. Sections were counterstained with Mayer’s haematoxylin, dehydrated, and mounted in Eukitt solution (Kindler GmbH and Co., Freiburg, Germany). Negative controls were obtained by replacing the primary or secondary antibody with PBS. Additional negative controls included isotype-matched immunoglobulins (no. SC-2025, Santa Cruz Biotechnology). Normal human skin was used as a positive control for Trop-2 staining [8].
Immunohistochemical scoring
Four fields per section were randomly chosen and examined at 40× magnification. Staining intensity was scored as 0, 1, 2, or 3 (respectively negative, weak, intermediate, and strong). We counted 250 cells/field (1000 cells/sample). The average percentage of positive cells was calculated for each BC type. An immunohistochemical score (HC) for each specimen was calculated by multiplying staining intensity by the percentage of positive cells {HC score = (% of weakly positive cells × 1) +(% of cells showing intermediate positivity × 2) +(% of strongly positive cells × 3)}. The HC scores therefore ranged from 0 (negative) to 300 (all cells displaying strong staining intensity) [46].
MicroRNA extraction from bladder tissue and cell lines
The FFPE RNA/DNA Purification Kit (Norgen Biotek Corporation, Thorold, ON, Canada) was used for total mRNA extraction from 10-μm-thick formalin-fixed paraffin-embedded tissue sections according to the manufacturer’s instructions.
For RNA extraction, cells seeded in 6-well plates were lysed with TRIzol reagent (Ambion, Life Technologies, Carlsbad, CA, USA); lysates were collected and RNA purified with Direct-zol RNA MiniPrep kit (Zymo Research Corp., Irvine, CA, USA) according to the manufacturer’s recommendations. Total RNAs were stored at -80 °C until use.
Quantitative real-time PCR
The expression of miR-125b and RNU48 (endogenous control) was measured by qPCR. Total RNA was converted to cDNA using the TaqMan microRNA reverse transcription kit and the TaqMan MicroRNA assay primers (all from Thermo Fisher, Monza, Italy) according to the manufacturer’s instructions. The mixture was incubated at 16 °C for 30 min, at 42 °C for 30 min, and at 85 °C for 5 min.
Subsequently, quantitative real-time PCR was performed with TaqMan MicroRNA assay probes and the TaqMan Universal Master mix (Thermo Fisher) using reverse transcription product. The following thermal cycle protocol was performed using the Rotor-Gene Q real-time PCR cycler (Qiagen, Hilden, Germany): initial denaturation at 95 °C for 2 min followed by 40 cycles of 95 °C for 15 sec and 60 °C for 1 min.
Data were analysed with real-time PCR Rotor Gene Q Software 2 (Thermo Fisher). MiR-125b-fold changes were calculated by the delta Ct method (2-ΔCt) and its expression was determined using RNU48. All reactions were run in duplicate.
Cell culture and miR-125b transfection in UROtsa and TCCSUP cells
UROtsa immortalized human urothelial cells (Rossi et al, Environ Health Perspect. 2001) and TCCSUP human bladder transitional carcinoma cells were cultured in Dulbecco’s Modified Eagle’s Medium (DMEM) supplemented with 10 % foetal bovine serum (FBS), 1% L-glutamine (all from Lonza, Basel, Switzerland) and 1 % penicillin/streptomycin (Sigma Aldrich, St Louis, MO, USA). Cells were grown at 37 °C in an atmosphere of 5 % CO2 and 95 % humidity. The medium was changed twice a week and cells were split 1:3 every 7 days, using a mixture of trypsin-EDTA (Lonza, Cologne, Germany). UROtsa cells were a kind gift from Scott H. Garrett (Department of Urology, West Virginia University at Morgantown, West Virginia, USA). TCCSUP cells were kindly provided by Axel Ullrich (Max-Planck Institute of Biochemistry, Department of Molecular Biology, Martinsried, Germany). All cell lines were free of mycoplasma contamination as routinely assessed by PCR analysis [47].
Transient transfection
Transient miRNA transfection was performed using the X-tremeGENE 9 transfection reagent (Roche Applied Science, Mannheim, Germany) according to the manufacturer’s instructions. Cells were seeded at a density of 2 x 10⁴/cm2 and transfected 12 h later with the mirVana miR-125b mimic or the negative control (Life Technologies, Carlsband, CA, USA). The miRNA mimic was used at the optimized concentration of 30 nM with the X-tremeGENE 9 transfection reagent (3:1 volume ratio). Transfected cells were incubated for 48 h before assaying. Untreated cells incubated with complete medium were used as an additional control. The level of miR-125b expression in both UROtsa and TCCSUP transfected cells was assessed by RT-PCR. UROtsa cells showed a very low basal expression level of miR-125b while TCCSUP cells showed an high basal expression level of miR-125b. Notably, the differences of miR125b increase after transfection were statistically significant in both cell lines (p<0.01 and p=0.039 respectively).
Western blot analysis of Trop-2 from transfected UROtsa and TCCSUP cells
UROtsa and TCCSUP pellets were lysed in PBS 1 X, 0.1 % SDS, 1 % Nonidet-P40, 12 mM sodium deoxycholate, 1 mM sodium orthovanadate, 1 mM PMSF, and 1.7 μg/ml aprotinin. Samples were centrifuged at 14,000 rpm for 20 min at 4 °C. Protein supernatants were stored at -80 °C and quantified using the Bradford assay and a standard curve of bovine serum albumin (USB Corporation, Cleveland, OH, USA) concentrations ranging from 2 to 10 μg. Absorbance was read at 595 nm.
Equal amounts of protein in Laemmli sample buffer (4 % SDS, 10 % β-mercaptoethanol, 20 % glycerol, 0.004 % bromophenol blue, and 0.125 M Tris-HCl) were loaded and fractionated over a 15 % sodium dodecyl sulphate-polyacrylamide gel (SDS-PAGE) run at 110 V. The proteins were electrophoretically transferred to polyvinylidene fluoride membranes at 100 V for 1 h. Then membranes were incubated in 5 % milk (USB Corporation, Cleveland, OH, USA) in TBS/0.05 % Tween (TBS-T) for 1 h at room temperature to block non-specific protein binding. Blocked membranes were incubated overnight at 4 °C with primary antibodies: mouse anti-Trop-2, 1:250 (no. SC-376181) and goat anti-β-actin, 1:2000 (no. SC-1616), both from Santa Cruz Biotechnology. Membranes were washed 3 times with TBS-T and incubated with appropriate secondary antibodies conjugated with horseradish peroxidase; the anti-mouse reagent was diluted 1:1500 and the anti-goat reagent 1:3000. Detection of protein bands was performed with the SuperSignal West Pico Chemiluminescent Substrate (ECL) (Thermo Scientific, Waltham, MA, United States) as recommended by the manufacturer. Band intensity was quantified using Quantity One software (Bio-Rad Laboratories, Hercules, CA, USA). The relative quantity of Trop-2 was normalized against β-actin expression.
Cell growth assay of cells transfected with miR-125b
For the cell growth assay, transfected cells were seeded at a density of 2 x 10⁴/cm2 in 96-well plates (5 replica wells/data point, 1 plate/time point). Transient transfections were performed as described above. Cells from each time point (0, 24, 48, 72 h) were fixed with 4 % paraformaldehyde for 40 min at room temperature. Cell growth was measured by staining with crystal violet (Sigma-Aldrich) [48]. Absorbance of acetic acid-released stain was quantified at 560 nm.
Cell numbers were calculated from standard reference curves of serially diluted cell samples.
Wound healing assay of cells transfected with miR-125b
Wound healing assay was performed using transfectants. Confluent cell monolayers were scratched with a 200-μl sterile pipette tip and gap areas were monitored at 0, 12 h, and 24 h under an inverted microscope (Nikon, Minato, Tokyo, Japan). Images of the same fixed fields were obtained at every time point. Gap areas were quantified using ImageJ software (https://imagej.nih.gov/ij/).
Statistical analysis
Due to the small sample size and the non-normal distribution as evaluated with the Shapiro test, the expression of Trop-2 and miR-125b in BC and control tissue specimens was tested with non-parametric approaches. MiR-125b levels were analysed after log transformation. Median and interquartile range (IQR) were used as a measure of centrality and variability, respectively, and graphically represented as boxplots. The Kruskal-Wallis test was applied to between-group comparisons. Quantile regression [49] was performed using the HC score as the dependent variable and BC groups and log (miR-125b) as explanatory factors. Quantile regression allowed estimating quantile-specific effects by describing the impact of exposure not only on the centre but also on each region of interest of the outcome distribution (e.g. distribution tails). Three parts of the HC score distribution were considered in the present analysis: 25th, 50th and 75th percentiles. Results were provided as regression coefficient estimates and 95 % confidence intervals (95% CI): if the 95 % CI did not include zero value, the regression coefficients were considered significantly different from 0. The R statistical program was used for the analyses and a probability of 0.05 was set as the threshold for statistical significance.
Data from cell experiments were expressed as the mean ± standard deviation (SD). The differences between the groups were analysed with Student’s t-test when two groups were compared and p-value of <0.05 was considered to be statistically significant.
Author contributions
D.M., F.O.: have designed the study, analyzed and interpreted the data, drafted the manuscript, and critically revised the article. C.A., C.L.: have designed the study, performed the experiments, acquired, analyzed and interpreted the data, and drafted the manuscript. R.L., E.G.: have designed the study and performed experiments. R.G.: has designed the study, performed the statistical analysisandcritically revised the article. G.T., C.C., S.R.G., A.P.: have critically revised the article. S.A.: has designed the study and critically revised the article. R.M.: has provided the bladder samples, designed the study and critically revised the article. All authors have approved the final version of the article.
ACKNOWLEDGMENTS
We thank Dr Teresa Lorenzi for her technical assistance. Caterina Licini is supported by PhD fellowships, Chiara Avellini and Giovanni Tossetta are supported by post doc fellowship of Polytechnic University of Marche, Italy.
CONFLICTS OF INTEREST
The authors report no conflicts of interest
FUNDING
This study was supported by grants from Università Politecnica delle Marche to D.M., F.O, R.M., S.G.
REFERENCES
1. Stein JP, Lieskovsky G, Cote R, Groshen S, Feng AC, Boyd S, Skinner E, Bochner B, Thangathurai D, Mikhail M, Raghavan D, Skinner DG. Radical cystectomy in the treatment of invasive bladder cancer: long-term results in 1,054 patients. J Clin Oncol. 2001; 19:666–75.
2. van Rhijn BW, van der Poel HG, van der Kwast TH. Urine markers for bladder cancer surveillance: a systematic review. Eur Urol. 2005; 47:736–48.
3. Karabacak OR, Cakmakci E, Ozturk U, Demirel F, Dilli A, Hekimoglu B, Altug U. Virtual cystoscopy: the evaluation of bladder lesions with computed tomographic virtual cystoscopy. Can Urol Assoc J. 2011; 5:34–37.
4. Calabrese G, Crescenzi C, Morizio E, Palka G, Guerra E, Alberti S. Assignment of TACSTD1 (alias TROP1, M4S1) to human chromosome 2p21 and refinement of mapping of TACSTD2 (alias TROP2, M1S1) to human chromosome 1p32 by in situ hybridization. Cytogenet Cell Genet. 2001; 92:164–65.
5. Lipinski M, Parks DR, Rouse RV, Herzenberg LA. Human trophoblast cell-surface antigens defined by monoclonal antibodies. Proc Natl Acad Sci USA. 1981; 78:5147–50.
6. Guerra E, Trerotola M, Aloisi AL, Tripaldi R, Vacca G, La Sorda R, Lattanzio R, Piantelli M, Alberti S. The Trop-2 signalling network in cancer growth. Oncogene. 2013; 32:1594–600.
7. McDougall AR, Tolcos M, Hooper SB, Cole TJ, Wallace MJ. Trop2: from development to disease. Dev Dyn. 2015; 244:99–109.
8. Stepan LP, Trueblood ES, Hale K, Babcook J, Borges L, Sutherland CL. Expression of Trop2 cell surface glycoprotein in normal and tumor tissues: potential implications as a cancer therapeutic target. J Histochem Cytochem. 2011; 59:701–10.
9. Trerotola M, Cantanelli P, Guerra E, Tripaldi R, Aloisi AL, Bonasera V, Lattanzio R, de Lange R, Weidle UH, Piantelli M, Alberti S. Upregulation of Trop-2 quantitatively stimulates human cancer growth. Oncogene. 2013; 32:222–33.
10. Goldstein AS, Lawson DA, Cheng D, Sun W, Garraway IP, Witte ON. Trop2 identifies a subpopulation of murine and human prostate basal cells with stem cell characteristics. Proc Natl Acad Sci USA. 2008; 105:20882–87.
11. Garraway IP, Sun W, Tran CP, Perner S, Zhang B, Goldstein AS, Hahm SA, Haider M, Head CS, Reiter RE, Rubin MA, Witte ON. Human prostate sphere-forming cells represent a subset of basal epithelial cells capable of glandular regeneration in vivo. Prostate. 2010; 70:491–501.
12. Trerotola M, Jernigan DL, Liu Q, Siddiqui J, Fatatis A, Languino LR. Trop-2 promotes prostate cancer metastasis by modulating β(1) integrin functions. Cancer Res. 2013; 73:3155–67.
13. Ambrogi F, Fornili M, Boracchi P, Trerotola M, Relli V, Simeone P, La Sorda R, Lattanzio R, Querzoli P, Pedriali M, Piantelli M, Biganzoli E, Alberti S. Trop-2 is a determinant of breast cancer survival. PLoS One. 2014; 9:e96993.
14. Liu T, Liu Y, Bao X, Tian J, Liu Y, Yang X. Overexpression of TROP2 predicts poor prognosis of patients with cervical cancer and promotes the proliferation and invasion of cervical cancer cells by regulating ERK signaling pathway. PLoS One. 2013; 8:e75864.
15. Ohmachi T, Tanaka F, Mimori K, Inoue H, Yanaga K, Mori M. Clinical significance of TROP2 expression in colorectal cancer. Clin Cancer Res. 2006; 12:3057–63.
16. Mühlmann G, Spizzo G, Gostner J, Zitt M, Maier H, Moser P, Gastl G, Zitt M, Müller HM, Margreiter R, Ofner D, Fong D. TROP2 expression as prognostic marker for gastric carcinoma. J Clin Pathol. 2009; 62:152–58.
17. Fong D, Moser P, Krammel C, Gostner JM, Margreiter R, Mitterer M, Gastl G, Spizzo G. High expression of TROP2 correlates with poor prognosis in pancreatic cancer. Br J Cancer. 2008; 99:1290–95.
18. Lin JC, Wu YY, Wu JY, Lin TC, Wu CT, Chang YL, Jou YS, Hong TM, Yang PC. TROP2 is epigenetically inactivated and modulates IGF-1R signalling in lung adenocarcinoma. EMBO Mol Med. 2012; 4:472–85.
19. Chen MB, Wu HF, Zhan Y, Fu XL, Wang AK, Wang LS, Lei HM. Prognostic value of TROP2 expression in patients with gallbladder cancer. Tumour Biol. 2014; 35:11565–69.
20. Goldenberg DM, Cardillo TM, Govindan SV, Rossi EA, Sharkey RM. Trop-2 is a novel target for solid cancer therapy with sacituzumab govitecan (IMMU-132), an antibody-drug conjugate (ADC). Oncotarget. 2015; 6:22496–512. https://doi.org/10.18632/oncotarget.4318
21. Albertini MC, Olivieri F, Lazzarini R, Pilolli F, Galli F, Spada G, Accorsi A, Rippo MR, Procopio AD. Predicting microRNA modulation in human prostate cancer using a simple String IDentifier (SID1.0). J Biomed Inform. 2011; 44:615–20.
22. Gurtner A, Falcone E, Garibaldi F, Piaggio G. Dysregulation of microRNA biogenesis in cancer: the impact of mutant p53 on Drosha complex activity. J Exp Clin Cancer Res. 2016; 35:45.
23. Visone R, Pallante P, Vecchione A, Cirombella R, Ferracin M, Ferraro A, Volinia S, Coluzzi S, Leone V, Borbone E, Liu CG, Petrocca F, Troncone G, et al. Specific microRNAs are downregulated in human thyroid anaplastic carcinomas. Oncogene. 2007; 26:7590–95.
24. Bera A, Das F, Ghosh-Choudhury N, Kasinath BS, Abboud HE, Choudhury GG. microRNA-21-induced dissociation of PDCD4 from rictor contributes to Akt-IKKβ-mTORC1 axis to regulate renal cancer cell invasion. Exp Cell Res. 2014; 328:99–117.
25. Cheng CM, Shiah SG, Huang CC, Hsiao JR, Chang JY. Up-regulation of miR-455-5p by the TGF-β-SMAD signalling axis promotes the proliferation of oral squamous cancer cells by targeting UBE2B. J Pathol. 2016; 240:38–49.
26. Baba O, Hasegawa S, Nagai H, Uchida F, Yamatoji M, Kanno NI, Yamagata K, Sakai S, Yanagawa T, Bukawa H. MicroRNA-155-5p is associated with oral squamous cell carcinoma metastasis and poor prognosis. J Oral Pathol Med. 2016; 45:248–55.
27. Ye JJ, Cao J. MicroRNAs in colorectal cancer as markers and targets: recent advances. World J Gastroenterol. 2014; 20:4288–99.
28. Courthod G, Franco P, Palermo L, Pisconti S, Numico G. The role of microRNA in head and neck cancer: current knowledge and perspectives. Molecules. 2014; 19:5704–16.
29. Shah NR, Chen H. MicroRNAs in pathogenesis of breast cancer: implications in diagnosis and treatment. World J Clin Oncol. 2014; 5:48–60.
30. Feliciano A, Castellvi J, Artero-Castro A, Leal JA, Romagosa C, Hernández-Losa J, Peg V, Fabra A, Vidal F, Kondoh H, Ramón Y Cajal S, Lleonart ME. miR-125b acts as a tumor suppressor in breast tumorigenesis via its novel direct targets ENPEP, CK2-α, CCNJ, and MEGF9. PLoS One. 2013; 8:e76247.
31. Guan Y, Yao H, Zheng Z, Qiu G, Sun K. MiR-125b targets BCL3 and suppresses ovarian cancer proliferation. Int J Cancer. 2011; 128:2274–83.
32. Ratert N, Meyer HA, Jung M, Lioudmer P, Mollenkopf HJ, Wagner I, Miller K, Kilic E, Erbersdobler A, Weikert S, Jung K. miRNA profiling identifies candidate mirnas for bladder cancer diagnosis and clinical outcome. J Mol Diagn. 2013; 15:695–705.
33. Canturk KM, Ozdemir M, Can C, Öner S, Emre R, Aslan H, Cilingir O, Ciftci E, Celayir FM, Aldemir O, Özen M, Artan S. Investigation of key miRNAs and target genes in bladder cancer using miRNA profiling and bioinformatic tools. Mol Biol Rep. 2014; 41:8127–35.
34. Xu Z, Yu YQ, Ge YZ, Zhu JG, Zhu M, Zhao YC, Xu LW, Yang XB, Geng LG, Dou QL, Jia RP. MicroRNA expression profiles in muscle-invasive bladder cancer: identification of a four-microRNA signature associated with patient survival. Tumour Biol. 2015; 36:8159–66.
35. Nakanishi H, Taccioli C, Palatini J, Fernandez-Cymering C, Cui R, Kim T, Volinia S, Croce CM. Loss of miR-125b-1 contributes to head and neck cancer development by dysregulating TACSTD2 and MAPK pathway. Oncogene. 2014; 33:702–12.
36. Le MT, Shyh-Chang N, Khaw SL, Chin L, Teh C, Tay J, O’Day E, Korzh V, Yang H, Lal A, Lieberman J, Lodish HF, Lim B. Conserved regulation of p53 network dosage by microRNA-125b occurs through evolving miRNA-target gene pairs. PLoS Genet. 2011; 7:e1002242.
37. Wu JG, Wang JJ, Jiang X, Lan JP, He XJ, Wang HJ, Ma YY, Xia YJ, Ru GQ, Ma J, Zhao ZS, Zhou R. MiR-125b promotes cell migration and invasion by targeting PPP1CA-Rb signal pathways in gastric cancer, resulting in a poor prognosis. Gastric Cancer. 2015; 18:729–39.
38. Jiang F, Liu T, He Y, Yan Q, Chen X, Wang H, Wan X. MiR-125b promotes proliferation and migration of type II endometrial carcinoma cells through targeting TP53INP1 tumor suppressor in vitro and in vivo. BMC Cancer. 2011; 11:425.
39. Li Q, Wu Y, Zhang Y, Sun H, Lu Z, Du K, Fang S, Li W. miR-125b regulates cell progression in chronic myeloid leukemia via targeting BAK1. Am J Transl Res. 2016; 8:447–59.
40. Li Y, Chao Y, Fang Y, Wang J, Wang M, Zhang H, Ying M, Zhu X, Wang H. MTA1 promotes the invasion and migration of non-small cell lung cancer cells by downregulating miR-125b. J Exp Clin Cancer Res. 2013; 32:33.
41. Alpini G, Glaser SS, Zhang JP, Francis H, Han Y, Gong J, Stokes A, Francis T, Hughart N, Hubble L, Zhuang SM, Meng F. Regulation of placenta growth factor by microRNA-125b in hepatocellular cancer. J Hepatol. 2011; 55:1339–45.
42. Ying X, Wei K, Lin Z, Cui Y, Ding J, Chen Y, Xu B. MicroRNA125b suppresses ovarian cancer progression via suppression of the epithelial-mesenchymal transition pathway by targeting the SET protein. Cell Physiol Biochem. 2016; 39:501–10.
43. Zhao X, He W, Li J, Huang S, Wan X, Luo H, Wu D. MiRNA-125b inhibits proliferation and migration by targeting SphK1 in bladder cancer. Am J Transl Res. 2015; 7:2346–54.
44. Edge SB, Byrd DR, Compton CC. AJCC cancer staging manual. 7th ed. Chicago: Springer; 2009. pp. 569–77.
45. Grignon DJ, Al-Ahmandie H, Algaba F, Moch H, Humphrey PA, Ulbright TM, Reuter VE. Urotelial tumours. In: Moch H, Humphrey PA, Ulbright TM, Reuter VE, editors. WHO Classification of Tumours of urinary system and male genital organ. Lyon: IARC press; 2016. pp. 81–107.
46. Igarashi T, Teramoto K, Ishida M, Hanaoka J, Daigo Y. Scoring of PD-L1 expression intensity on pulmonary adenocarcinomas and the correlations with clinicopathological factors. ESMO Open. 2016; 1:e000083.
47. Toji LH, Lenchitz TC, Kwiatkowski VA, Sarama JA, Mulivor RA. Validation of routine mycoplasma testing by PCR. In Vitro Cell Dev Biol Anim. 1998; 34:356–58.
48. Orsulic S, Li Y, Soslow RA, Vitale-Cross LA, Gutkind JS, Varmus HE. Induction of ovarian cancer by defined multiple genetic changes in a mouse model system. Cancer Cell. 2002; 1:53–62.
49. Briollais L, Durrieu G. Application of quantile regression to recent genetic and -omic studies. Hum Genet. 2014; 133:951–66.