
Introduction
Tuberculous peritonitis (TBP) and peritonitis carcinomatosa (PC) are the main causes of exudative ascites. It is important to distinguish TBP from PC for their different treatment strategies and prognoses. However, the differentiation is not an easy task because both of them may present similar symptoms such as abdominal tenderness [1]. Bacteria culture and interferon-γ release assays (IGRAs) are not able to solve the problem completely since bacteria culture is time-consuming with limited sensitivity of less than 80% [2], and the long waiting period for the result might compromise the prognosis of tuberculosis [3]. Moreover, IGRAs require high cost and complicated technology [4-6], making it unavailable in remote areas. Additionally, as IGRAs were mainly applied to pulmonary tuberculosis and high risk group [7-10], it is still uncertain whether IGRAs are conferred to enough sensitivity and specificity in extrapulmonary tuberculosis [11].
Tumor markers were developed to distinguish malignancy from benign conditions, but it also turns out confusing under certain circumstances. Carbohydrate antigen 125 (CA 125), usually elevated in ovarian neoplasms, has also been reported to elevate in TBP by many papers [12-20]. However, they have not properly determined the disparity of CA125 levels in TBP and PC. Moreover, carcinoembryonic antigen (CEA), which is mainly found to elevate significantly in adenocarcinoma involving abdominal organs [21], were seldom investigated in TBP.
Therefore, this study aimed to determine the levels of CA 125 and CEA, and the diagnostic efficacy of CA 125 and/or CEA to differentiate TBP from PC in ascitic patients with TBP or PC.
Materials and methods
Patients
Patients with ascites diagnosed with TBP or PC in West China Hospital between 2009 and 2013 were reviewed. TBP was confirmed by either positive pathological findings (acid-fasting stain/smear positive and/or caseous necrosis), or strong clinical evidence consistent with TBP and responsive to the full course of tuberculosis chemotherapy. Meanwhile, PC was diagnosed by findings of carcinoma cells in ascites and/or positive biopsy findings.
Patients were excluded if any item listed below was fulfilled: 1) neither CA 125 nor CEA was measured; 2) patients with TBP suffered from tuberculosis in other sites (eg. lung, pleural cavity and bone); 3) treatment-experienced to tuberculosis or tumor; 4) comorbidity of liver cirrhosis, congestive heart failure or nephrotic syndrome; 5) high-dosage intake of diuretics, or large volume paracentesis before measurements of CA 125 and CEA.
Study design
The patients with TBP were assigned to TBP group. As the traditional opinion held that CA125 elevated significantly in female patients with the ovarian tumor, the patients with PC were sequentially classified into two groups by whether the primary tumor location was ovarian or not: the ovarian carcinoma-related PC group (OCA group) and the non-ovarian carcinoma-related PC group (non-OCA group).
The baseline characteristics of each patient were collected. Both CA 125 and CEA were measured by electrochemiluminescence immunoassay with the same kit (Roche, Basel, Switzerland), and their levels in serum and ascites were recorded respectively. Meanwhile, data incompleteness for CA 125 and CEA was also recorded for the bias evaluation. The relationships between tumor markers and four factors (age, gender, underlying condition and ascites volume) were also detected to evaluate the influence of potential influential factors on tumor markers.
In the previous clinical work, we found a trend in patients that TBP and non-OCA PC had lower levels of CA 125 than that of OCA-related PC, and non-OCA-related PC and OCA-related PC had higher levels of CEA than that of TBP. Therefore, we proposed a hypothesis that TBP and PC might be differentiated by CEA multiplying CA 125 for the combinative use of CA 125 and CEA might magnify the power of CA 125 to differentiate TBP from PC. Therefore, the composite index (CI) was calculated by CA 125×CEA in serum and ascites separately, and receiver operator characteristics (ROC) curves and area under curves (AUCs) for CA 125, CEA and CI were also obtained.
Statistical analysis
Data were mainly tested by Chi-square test or analysis of variance (ANOVA) depending on the type of data, and the nonparametric test (Wilcoxon rank sum test or Nemenyi test) was employed if the quantitative data lacked the homogeneity of variances. Pearson correlation analysis was applied to determine the correlation between the serum level and the ascites level of tumor markers. Additionally, the ROC curve was applied to determine the power of different parameters (serum and ascites CA 125, CEA and CI) to distinguish PC from TBP. All the statistical work was conducted with SPSS 19.0 software.
Results
Patient enrollment and data incompleteness
During January 2009 to December 2013, 2998 patients with ascites were diagnosed with TBP or PC in West China Hospital. After initial screening, 2706 patients were excluded. Finally, 101, 120 and 71 patients met our criteria and were assigned to TBP group, non-OCA group and OCA group, respectively (Figure 1). As for data incompleteness, it was generally comparable except for serum CA 125 (Table 1).
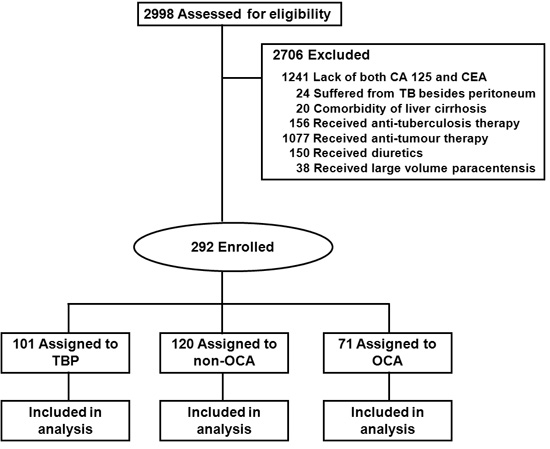
Figure 1: Flow of patients. Abbreviations: CA 125, carbohydrate antigen 125; CEA, carcinoembryonic antigen; non-OCA: non-ovarian carcinoma; OCA: ovarian carcinoma; TB: tuberculosis; TBP, tuberculous peritonitis.
Baseline characteristics
The patients in TBP group had a smaller average age than non-OCA group and OCA group, and the gender ratios of three groups were also different from each other (Table 1). For symptoms and signs, TBP group had larger proportions of manifestations such as diarrhea, fever and night sweat (Table 1). In aspect of the grading of ascites, the majority of patients in each group were categorized to grade 2 (Table 1).
The diagnoses of 79 patients (81.8%) in TBP group were confirmed by pathology and the remains (22 patients, 18.2%) were established if they were responsive to the empirical full course of tuberculosis chemotherapy. In non-OCA group, primary tumor foci were located in stomach (34 patients, 28.3%), followed by unidentified sites (29 patients, 24.2%), pancreas (23 patients, 19.2%), colon (16 patients, 13.3%), biliary tree (14 patients, 11.7%) and rectum (4 patients, 3.3%).
Table 1: Basic characteristics and data incompleteness
TBP |
non-OCA |
OCA |
P |
|
N |
101 |
120 |
71 |
NA |
Demography |
||||
Age (years, mean ± SD) |
40.8 ± 18.4†‡ |
61.9 ± 12.8† |
56.3 ± 12.4 |
< 0.001 |
Gender (male/female, n) |
45/56* |
71/49* |
0/71 |
< 0.001 |
Symptoms and signs |
||||
Abdominal pain, n (%) |
63 (62.4) |
78 (65) |
38 (53.5) |
0.279 |
Abdominal tenderness, n (%) |
79 (78.2) |
90 (75) |
46 (64.8) |
0.131 |
Constipation, n (%) |
7 (7.9) |
9 (7.5) |
5 (7.0) |
0.985 |
Diarrhoea, n (%) |
24 (23.8)* |
19 (15.8) |
5 (7.0) |
0.014 |
Fever, n (%) |
44 (43.6) *# |
8 (6.7) |
7 (9.9) |
< 0.001 |
Night sweat, n (%) |
29 (28.7) *# |
3 (2.5) |
5 (7.0) |
< 0.001 |
Grading of ascites |
||||
Grade 1, n (%) |
0 (0) |
0 (0) |
0 (0) |
0.500 |
Grade 2, n (%) |
64 (63.4) |
84 (70.0) |
45 (63.4) |
|
Grade 3, n (%) |
37 (36.6) |
36 (30.0) |
26 (36.6) |
|
Data incompleteness |
||||
Serum |
||||
CA125 missing, n (%) |
8 (7.9) |
7 (5.8) |
4 (5.6) |
0.775 |
CEA missing, n (%) |
9 (8.9) |
19 (15.8) |
13 (18.3) |
0.166 |
Ascites |
||||
CA125 missing, n (%) |
52# (51.5) |
82 (68.3) |
36 (50.7)# |
0.014 |
CEA missing, n (%) |
63 (62.4) |
90 (75) |
44 (62.0) |
0.072 |
P < 0.05: † vs. OCA, ‡ vs. non-OCA; P < 0.0125: * vs. OCA, # vs. non-OCA.
P values derived via ANOVA or chi-square test as appropriate.
The grading of ascites refers to EASL clinical practice guidelines on the management of ascites, spontaneous bacterial peritonitis, and hepatorenal syndrome in cirrhosis, which was issued in 2010. Detailedly, grade 1 ascites is defined as mild ascites only detectable by ultrasound; grade 2 ascites is defined as moderate ascites evident by moderate symmetrical distension of abdomen; grade 3 ascites is defined as large or gross ascites with marked abdominal distension.
Abbreviations: ANOVA, analysis of variance; CA 125, carbohydrate antigen 125; CEA, carcinoembryonic antigen; N, number; non-OCA, non-ovarian carcinoma; OCA, ovarian carcinoma; SD, standard deviation; TBP, tuberculous peritonitis.
CA 125 and CEA levels in serum and ascites
The serum and ascites CA 125 levels in TBP group and non-OCA group were both lower than those in OCA group. Differently, as for the serum and ascites CEA, non-OCA group took the highest rank, followed by OCA group and TBP group (Table 2). The correlation of the tumor marker level in serum and ascites existed, no matter whether it was CA 125 or CEA (CA 125: r2 = 0.641, P < 0.001; CEA: r2 = 0.536, P < 0.001).
Moreover, the female had higher levels of serum and ascites CA 125 than the male. Patients with the age ≥ 45 years bore higher levels of serum CEA, ascites CA 125 and ascites CEA, compared with those with the age < 45 years. However, the grading of ascites did not influence the levels of serum/ascites CA 125 or serum/ascites CEA (Table 3).
Considering all patients in OCA group were female, the results above of the influence of gender on the tumor makers might include significant bias. Therefore, when OCA group was excluded, and only TBP group and non-OCA group were compared, it turned out that no differences were found in serum CA 125, ascites CA 125 or ascites CEA (P for serum CA 125 0.126, serum CEA 0.015, ascites CA 125 0.519 and ascites CEA 0.132).
Table 2: Levels of CA 125 and CEA in serum and ascites
TBP |
non-OCA |
OCA |
P |
||||
Serum |
CA125 (U/ml) |
N |
93 |
113 |
67 |
NA |
|
Overall patients |
344.5 (160.5-563.6)* |
227.4 (101.3-475.7)* |
1219.0 (312.5-2781.0) |
< 0.001 |
|||
N |
39 |
65 |
0 |
NA |
|||
Male |
279.2 (156.3-498.0) |
237.7 (94.6-442.6) |
NA |
0.199 |
|||
N |
54 |
48 |
67 |
NA |
|||
Female |
392.5 (178.4-614.0)* |
227.0 (108.5-511.9)* |
1219.0 (312.5-2781.0) |
< 0.001 |
|||
CEA (ng/ml) |
N |
92 |
101 |
58 |
NA |
||
Overall patients |
1.2 (0.8-2.2)*# |
148.1 (16.1-1000.0) |
8.8 (5.4-26.4)# |
< 0.001 |
|||
N |
41 |
60 |
0 |
NA |
|||
Male |
1.2 (0.7-2.2)† |
197.4 (21.1-1000.0) |
NA |
< 0.001 |
|||
N |
51 |
41 |
58 |
NA |
|||
Female |
1.4 (0.8-2.2)*# |
39.5 (13.8-906.4) |
8.8 (5.4-26.4) |
< 0.001 |
|||
Ascites |
CA125 (U/ml) |
N |
49 |
38 |
35 |
NA |
|
Overall patients |
746.3 (337.6-1232.0)* |
984.5 (584.6-1618.3)* |
4454.0 (1404.0-5000.0) |
< 0.001 |
|||
N |
24 |
19 |
0 |
NA |
|||
Male |
638.8 (218.8-1238.5)† |
936.9 (855.2-1377.0) |
NA |
0.045 |
|||
N |
25 |
19 |
35 |
NA |
|||
Female |
804.7 (520.0-1206.0)* |
1032.0 (469.9-1921.0)* |
4454.0 (1404.0-5000.0) |
< 0.001 |
|||
CEA (ng/ml) |
N |
38 |
30 |
27 |
NA |
||
Overall patients |
0.7 (0.4-1.5)*# |
413.9 (14.3-1000.0) |
8.1 (3.9-260.3) |
< 0.001 |
|||
N |
17 |
16 |
0 |
NA |
|||
Male |
0.8 (0.5-2.1)† |
413.9 (61.5-990.8) |
NA |
< 0.001 |
|||
N |
21 |
14 |
27 |
NA |
|||
Female |
0.6 (0.4-1.3)*# |
309.5 (4.6-1000.0) |
8.1 (3.9-260.3) |
< 0.001 |
P values derived via Nemenyi test. P < 0.05: † vs. non-OCA; P < 0.0125: * vs. OCA, # vs. non-OCA. All data in this part are presented as median (25th percentile - 75th percentile).
Abbreviations: CA 125, carbohydrate antigen 125; CEA, carcinoembryonic antigen; N, number; NA, not applicable; non-OCA, non-ovarian carcinoma-related peritonitis carcinomatosa; OCA, ovarian carcinoma-related peritonitis carcinomatosa; TBP, tuberculous peritonitis.
Table 3: Influence of gender, age and ascites volume on CA 125 and CEA
Gender |
Age |
Grading of ascites |
|||||||||
Male |
Female |
P |
< 45 yrs |
≥ 45 yrs |
P |
Moderate |
Severe |
P |
|||
Serum |
CA 125 (U/ml) |
N |
104 |
169 |
78 |
195 |
181 |
92 |
|||
260.1 (107.9-466.0) |
453.9 (184.7-1299.5) |
< 0.001 |
323.9 (136.0-557.8) |
380.4 (135.9-930.0) |
0.157 |
296.9 (128.7-741.6) |
441.6 (182.6-898.2) |
0.152 |
|||
CEA (ng/ml) |
N |
101 |
150 |
76 |
175 |
164 |
87 |
||||
13.0 (1.3-309.3) |
6.0 (1.3-32.0) |
0.084 |
1.3 (0.8-3.0) |
13.2 (2.8-229.0) |
< 0.001 |
6.7 (1.2-82.0) |
7.0 (1.8-95.7) |
0.422 |
|||
Ascites |
CA 125 (U/ml) |
N |
43 |
79 |
36 |
86 |
78 |
44 |
|||
903.6 (352.9-1281.0) |
1290.0 (632.4-5000.0) |
0.001 |
893.4 (367.4-1215.0) |
1327.5 (714.5-4283.0) |
0.001 |
1007.2 (538.0-3187.0) |
1178.5 (743.0-1905.3) |
0.485 |
|||
CEA (ng/ml) |
N |
33 |
62 |
27 |
68 |
59 |
36 |
||||
2.3 (0.8-413.9) |
4.3 (0.6-99.4) |
0.760 |
0.9 (0.4-26.2) |
6.3 (1.0-397.9) |
0.010 |
7.3 (0.6-794.1) |
2.4 (0.8-29.9) |
0.433 |
|||
All data in Table 3 are presented as median (25th percentile - 75th percentile).
P values derived via Wilcoxon rank sum test.
Abbreviations: CA 125, carbohydrate antigen 125; CEA, carcinoembryonic antigen; N, number.
ROC curves to differentiate PC from TBP
Among the different ROC curves, serum CI, ascites CI, serum CEA and ascites CEA had larger AUCs, comparing with the AUCs of serum CA 125 and ascites CA 125 (Table 4, Figure 2). Furthermore, ascites CI displayed the best sensitivity, and serum CI displayed the best specificity, when the cut-offs were set to 2919.30 and 2303.13, respectively (Table 4).
Table 4: Differentiating PC from TBP by CA 125, CEA and CI
N |
AUC |
Cut-off |
Sensitivity |
Specificity |
YI |
PV+ |
PV- |
|
Serum CA 125 (U/ml) |
273 |
0.536 (0.469-0.604) |
857.30 |
0.300 |
0.914 |
0.214 |
87.1% |
59.7% |
Serum CEA (ng/ml) |
251 |
0.927 (0.891-0.962) |
3.64 |
0.887 |
0.978 |
0.865 |
98.6% |
83.3% |
Serum CI (U/ml × ng/ml) |
244 |
0.914 (0.876-0.951) |
2303.13 |
0.832 |
0.989 |
0.821 |
99.2% |
77.2% |
Ascites CA 125 (U/ml) |
122 |
0.753 (0.670-0.837) |
1375.50 |
0.548 |
0.878 |
0.425 |
87.0% |
56.6% |
Ascites CEA (ng/ml) |
95 |
0.907 (0.848-0.967) |
2.43 |
0.860 |
0.947 |
0.807 |
96.1% |
81.8% |
Ascites CI (U/ml × ng/ml) |
92 |
0.946 (0.902-0.991) |
2919.30 |
0.907 |
0.921 |
0.828 |
94.2% |
87.5% |
CI = CA 125 × CEA
Data of 95% CI of AUC are provided in the brackets.
Abbreviations: AUC, area under curve; CA 125, carbohydrate antigen 125; CEA, carcinoembryonic antigen; CI, composite index; N, number; TBP, tuberculous peritonitis; PC, peritonitis carcinomatosa; PV+: positive predict value; PV-: negative predict value; YI, Youden index.
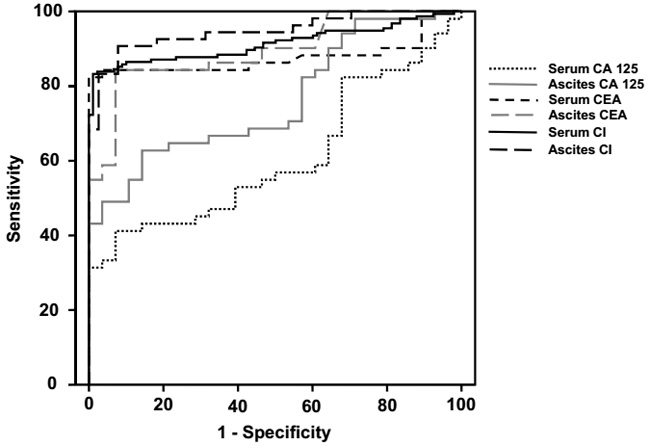
Figure 2: ROC curves of CA 125, CEA and CI in distinguishing PC from TBP. Abbreviations: CA 125, carbohydrate antigen 125; CEA, carcinoembryonic antigen; CI, composite index; PC, peritonitis carcinomatosa; ROC, receiver operator characteristic; TBP, tuberculous peritonitis.
Discussion
CA 125 is found on both healthy and malignant mesothelial and non-mesothelial cells [22] and it was investigated to increase in patients with TBP (See in Supplementary Table 1) [12-20]. However, the sample sizes of these studies were not large, most of which included 20-30 cases, and the main primary locations of carcinoma were ovary and stomach. In addition, nearly half of these studies were case series without control.
Comparing with these studies, our retrospective study included more cases and covered more tumor types. Although the age of patients impacted ascites CA 125, this study did suggest that different diseases affect the extent of elevation of serum and ascites CA 125. Detailedly, CA 125 in TBP group and non-OCA group reached to the level of several hundreds to a thousand. On the contrast, CA 125 in OCA group could reach to the level of several thousands. This distinction might be attributed to different nature of secretory cells in different diseases. As CA 125 is relatively specific in ovarian carcinoma and both tumor and tuberculosis can stimulate the release of CA 125, ovarian carcinoma exerts more potent stimulus on CA 125 secretion than non-ovarian carcinoma and tuberculosis, which might explain the aforementioned phenomenon.
This study also implied the elevation extent of CA 125 was not related with the amount of ascites, differing from the study of E. Zuckerman et al [23]. The discrepancy might be attributed to two reasons. Firstly, ascites due to liver cirrhosis is transudative, but TBP and PC give rise to exudative ascites. The different nature of ascites does not allow the theory proven in liver cirrhosis to be feasible in other populations. Secondly, the accurate method to measure the quantity of ascites has not been fully developed. The prevailing evaluation is qualitative, which is not accurate enough for analysis.
Although OCA-related PC can be distinguished from TBP by different elevation extent of CA 125, differentiation of TBP from non-OCA-related PC still remains a tough problem, because in this study CA 125 levels in TBP and non-OCA-related PC were found to overlap. However, CEA level in non-OCA group (non-OCA-related PC) reached to hundreds, but the CEA levels in TBP group and OCA group (OCA-related PC) were less than ten, which indicated that CEA elevation is less influenced by ovarian carcinoma, followed by tuberculosis.
Although it was supposed that the combined application of CA 125 and CEA was prone to distinguish PC from TBP with a much higher accuracy, comparing with CA 125 alone, both CI and CEA presented the similar diagnostic efficacy in differentiating PC from TBP. Nevertheless, CI still displayed slight diagnostic advantage comparing with CEA, which verified our proposed hypothesis that CI magnified the difference of CEA between TBP and PC by taking CA 125 into account.
Nevertheless, this study still has some disadvantages. Firstly, as a retrospective study, some data were missing, which introduced some bias to the results. Secondly, the epidemiological, geographical and economical factors were less concerned for it was a single-center study. These disadvantages call for sequential prospective studies in future to verify the conclusion drawn from this study.
In conclusion, CA 125 does increase in TBP and non-OCA-related PC, but it elevates more in OCA-related PC. CEA and CI are helpful in distinguishing PC from TBP, and CI is slightly superior to CEA in the differentiation. However, these diagnostic parameters require further validations by prospective cohort studies with larger sample size.
Acknowledgments
We would like to thank Dr. She-Yu Li (West China Hospital, Sichuan University) for his suggestions on statistics.
conflicts of interest
The authors declare no other conflicts of interest with regard to this manuscript.
Funding
This study was supported by the National Natural Science Foundation of China (Grant No. 81400637) and the Research Foundation for Residents of West China Hospital.
References
1. Muta Y, Kou T, Yazumi S. Tuberculous peritonitis mimicking peritonitis carcinomatosa. Clin Gastroenterol Hepatol. 2012; 10:A28.
2. Sanai FM, Bzeizi KI. Systematic review: tuberculous peritonitis - presenting features, diagnostic strategies and treatment. Aliment Pharm Therap. 2005; 22:685-700.
3. Chow KM, Chow VC, Hung LC, Wong SM, Szeto CC. Tuberculous peritonitis-associated mortality is high among patients waiting for the results of mycobacterial cultures of ascitic fluid samples. Clin Infect Dis. 2002; 35:409-413.
4. Kowada A, Takahashi O, Shimbo T, Ohde S, Tokuda Y, Fukui T. Cost effectiveness of interferon-gamma release assay for tuberculosis contact screening in Japan. Mol Diagn Ther. 2008; 12:235-251.
5. de Perio MA, Tsevat J, Roselle GA, Kralovic SM, Eckman MH. Cost-effectiveness of interferon gamma release assays vs tuberculin skin tests in health care workers. Archives of Internal Medicine. 2009; 169:179-187.
6. Deuffic-Burban S, Atsou K, Viget N, Melliez H, Bouvet E, Yazdanpanah Y. Cost-effectiveness of QuantiFERON-TB test vs. tuberculin skin test in the diagnosis of latent tuberculosis infection. Int J Tuberc Lung Dis. 2010; 14:471-481.
7. Park JS, Lee JS, Kim MY, Lee CH, Yoon HI, Lee SM, Yoo CG, Kim YW, Han SK, Yim JJ. Monthly follow-ups of interferon-gamma release assays among health-care workers in contact with patients with TB. Chest. 2012; 142:1461-1468.
8. van Zyl-Smit RN, Zwerling A, Dheda K, Pai M. Within-subject variability of interferon-g assay results for tuberculosis and boosting effect of tuberculin skin testing: a systematic review. PLoS ONE. 2009; 4:e8517.
9. Rangaka MX, Wilkinson KA, Glynn JR, Ling D, Menzies D, Mwansa-Kambafwile J, Fielding K, Wilkinson RJ, Pai M. Predictive value of interferon-gamma release assays for incident active tuberculosis: a systematic review and meta-analysis. Lancet Infect Dis. 2012; 12:45-55.
10. de Souza-Galvão ML, Latorre I, Altet-Gómez N, Jiménez-Fuentes MA, Milà C, Solsona J, Seminario MA, Cantos A, Ruiz-Manzano J, Domínguez J. Correlation between tuberculin skin test and IGRAs with risk factors for the spread of infection in close contacts with sputum smear positive in pulmonary tuberculosis. BMC Infect Dis. 2014; 14:258.
11. Shin JA, Chang YS, Kim HJ, Ahn CM, Byun MK. Diagnostic utility of interferon-gamma release assay in extrapulmonary tuberculosis. Diagn Microbiol Infect Dis. 2015; 82:44-48.
12. Bae SY, Lee JH, Park JY, Kim DM, Min BH, Rhee PL, Kim JJ. Clinical significance of serum CA-125 in Korean females with ascites. Yonsei Med J. 2013; 54:1241-1247.
13. Wang D, Zhang JJ, Huang HF, Shen K, Cui QC, Xiang Y. Comparison between peritoneal tuberculosis and primary peritoneal carcinoma: a 16-year, single-center experience. Chin Med J (Engl). 2012; 125:3256-3260.
14. Oge T, Ozalp SS, Yalcin OT, Kabukcuoglu S, Kebapci M, Arik D, Isikci T. Peritoneal tuberculosis mimicking ovarian cancer. Eur J Obstet Gynecol Reprod Biol. 2012; 162:105-108.
15. Kaya M, Kaplan MA, Isikdogan A, Celik Y. Differentiation of tuberculous peritonitis from peritonitis carcinomatosa without surgical intervention. Saudi J Gastroenterol. 2011; 17:312-317.
16. Choi CH, Kim CJ, Lee YY, Kim JS, Song T, Park HS, Kim MK, Kim TJ, Lee JW, Lee JH, Bae DS, Kim BG. Peritoneal tuberculosis: a retrospective review of 20 cases and comparison with primary peritoneal carcinoma. International Journal of Gynecological Cancer. 2010; 20:798-803.
17. Sharma JB, Jain SK, Pushparaj M, Roy KK, Malhotra N, Zutshi V, Rajaram S. Abdomino-peritoneal tuberculosis masquerading as ovarian cancer: a retrospective study of 26 cases. Arch Gynecol Obstet. 2010; 282:643-648.
18. Ulusoy AN, Karabicak I, Dicle K, Kefeli M, Tosun M, Cetinkaya M, Alper T, Ustun C. Peritoneal tuberculosis in premenopausal patients with elevated serum CA 125. Arch Gynecol Obstet. 2010; 282:639-642.
19. Mas MR, Comert B, Saglamkaya U, Yamanel L, Kuzhan O, Ateskan U, Kocabalkan F. CA-125; a new marker for diagnosis and follow-up of patients with tuberculous peritonitis. Digestive & Liver Disease. 2000; 32:595-597.
20. Simsek H, Savas MC, Kadayifci A, Tatar G. Elevated serum CA 125 concentration in patients with tuberculous peritonitis: a case-control study. Am J Gastroenterol. 1997; 92:1174-1176.
21. Louhimo J, Finne P, Alfthan H, Stenman UH, Haglund C. Combination of HCGbeta, CA 19-9 and CEA with logistic regression improves accuracy in gastrointestinal malignancies. Anticancer Research. 2002; 22:1759-1764.
22. Silberstein LB, Rosenthal AN, Coppack SW, Noonan K, Jacobs IJ. Ascites and a raised serum Ca 125--confusing combination. J R Soc Med. 2001; 94:581-582.
23. Zuckerman E, Lanir A, Sabo E, Rosenvald-Zuckerman T, Matter I, Yeshurun D, Eldar S. Cancer antigen 125: a sensitive marker of ascites in patients with liver cirrhosis. Am J Gastroenterol. 1999; 94:1613-1618.