
INTRODUCTION
Steroid-induced osteonecrosis of the femoral head is a disabling disease, particularly after the 2003 SARS(severe acute respiratory syndrome) outbreak in China, but the mechanism of whom is not completely understood [1]. Approximately 20,000–30,000 people are diagnosed with osteonecrosis in the United States each year [2]; the morbidity rate of non-traumatic femoral head osteonecrosis in Japan was 1.91/100,000 per year [3]. The natural course of femoral head osteonecrosis is necrosis, followed by collapse and osteoarthritis. Once collapse occurs, osteoarthritis and joint replacement is inevitable [4, 5]. Therefore, collapse must be treated surgically for femoral head osteonecrosis, and preventing collapse has been the focus of non-joint replacement therapy [6–14].Current studies of collapse are typically performed from the biological, biomechanical, or mechanobiological perspective [15–19]; however, the mechanism of collapse is unclear, leading to insufficient effective preventive measures and unsatisfactory efficacy of hip-preserving surgery. As the number of studies of miRNA in orthopedics has increased, specific miRNAs involved in femoral head osteonecrosis have been identified [20–24]. However, the developmental course of femoral head osteonecrosis is a dynamic process. Whether miRNA is differentially expressed in different states of osteonecrotic femoral head (non-collapse vs. collapse) remains unclear. Studies of differential miRNA expression may increase the understanding of the biological mechanisms underlying collapse. This study aimed to identify miRNAs differentially expressed in collapse and non-collapse areas of the osteonecrotic femoral head and validate these miRNAs using reverse transcription-polymerase chain reaction (RT-PCR) assays, and eventually predict the target genes and pathways of these miRNAs.
RESULTS
Quality control and results of differentially expressed miRNAs
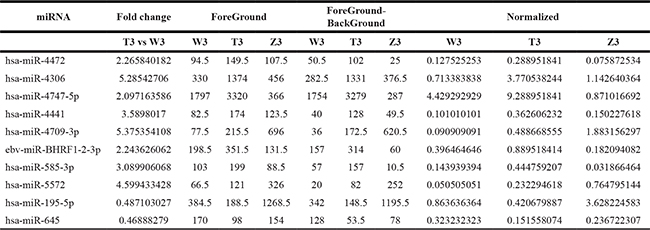
The 9 selected samples passed the quality control test .A total of 2085 differentially expressed miRNAs were detected in the 9 samples. Among the detected miRNAs, 433 miRNAs showed more than 1.5-fold differential expression in the T1 group compared to the W1 group (247 miRNAs were up-regulated and 186 miRNA were down-regulated); 344 miRNAs were differentially expressed by more than two-fold in the T2 group compared to the W2 group (225 miRNAs were up-regulated and 119 miRNAs were down-regulated); 107 miRNAs showed differential expression by more than two-fold in the T3 group compared to the W3 group (51 miRNAs were up-regulated and 56 miRNAs were down-regulated) (Figure 1). Combining the data from all three patients, 10 miRNA were differentially expressed by more than two-fold in the collapse area (T1+T2+T3) compared to the non-collapse area (W1+W2+W3) (8 miRNAs were up-regulated: hsa-miR-4472, hsa-miR-4306. hsa-miR-4747-5p, hsa-miR-4441, hsa-miR-4709-3p, ebv-miR-BHRF1-2-3p, hsa-miR-585-3p, and hsa-miR-5572, while 2 miRNAs were down-regulated: hsa-miR-195-5p and hsa-miR-645). Compared to the normal region, has-miR-195-5p showed the most significant down-regulation (Tables 1–3).
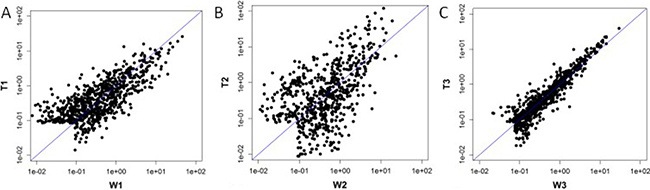
Figure 1: Scatter Plot: T1 vs W1 was showed 1A, T2 vs W2 was showed 1B,T3 vs W3 was showed 1C.
Table 1: Compared with the W1 , the number of differential expression of miRNAs (fold change > 1.5) in T1
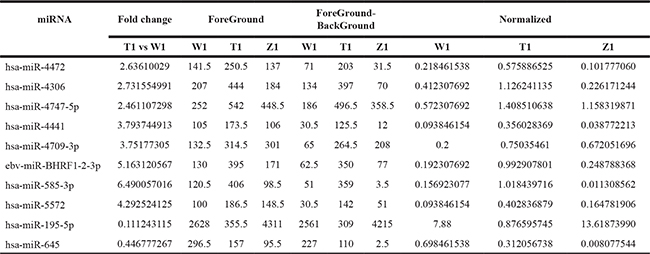
Table 2: Compared with the W2 , the number of differential expression of miRNAs (fold change > 1.5) in T2
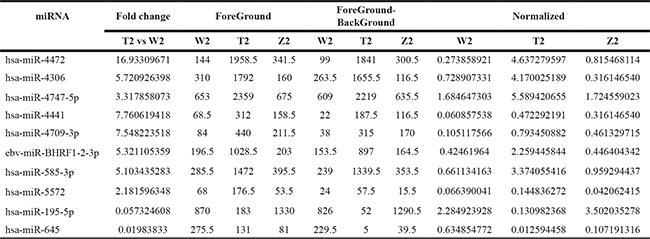
Table 3: Compared with the W3 , the number of differential expression of miRNAs (fold change >1.5) in T3
RT-PCR results of hsa-miR-195-5p
The following U6 primers were used for RT-PCR:F: 5′GCTTCGGCAGCACATAT ACTAAAAT3′, R: 5′CGCTTCACGAATTTGCGTGT CAT3′.The primer sequences of hsa-miR-195-5p were: GSP: 5′GGGGTAGCAGCACAGAAAT3′, R: 5′CAGTGCGTGTCGTGGAGT3′(GSP is a specific primer for miRNA, while R is a primer that matches the RT primer). The RT-PCR expression level of hsa-miR-195-5p was significantly lower in the collapse area (T1 T2 T3)than in the non-collapse area (W1 W2 W3) and normal area (Z1 Z2 Z3) . (Table 4) Comparison of the results from RT-PCR and the microarray data also indicated that hsa-miR-195-5p expression was downregulated.Amplification and melting curves were obtained (Figure 2).
Table 4: The RT-PCR results of hsa-miR-195-5p
Sample number |
U6Ct |
(hsa-miR-195-5p)Ct |
(hsa-miR-195-5p)Ct-U6Ct |
2-ΔΔCT |
|---|---|---|---|---|
T1 |
15.894 |
20.228 |
4.333 |
1.00 |
W1 |
15.867 |
17.137 |
1.270 |
8.36 |
Z1 |
15.521 |
16.211 |
0.689 |
12.50 |
T2 |
15.774 |
21.837 |
6.063 |
0.30 |
W2 |
15.871 |
17.946 |
2.074 |
4.78 |
Z2 |
15.555 |
18.715 |
3.160 |
2.25 |
T3 |
15.449 |
20.638 |
5.189 |
0.55 |
W3 |
15.752 |
20.307 |
4.555 |
0.86 |
Z3 |
15.848 |
18.838 |
2.990 |
2.54 |
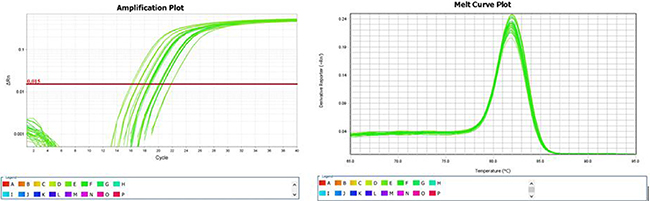
Figure 2: Amplification and melting curves of hsa-miR-195-5p.
Target genes,network ,GO analysis and KEGG pathway analysis of hsa-miR-195-5p
157 genes were perdicted as the target gene of hsa-miR-195-5p (Figures 3, 4). GO analysis and KEGG Pathway analysis were showed that pathway in cancer is significant (Figures 5, 6).
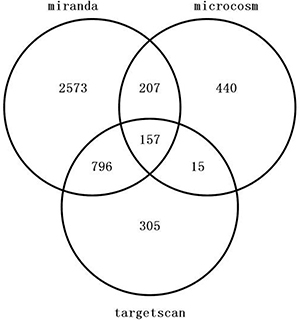
Figure 3: Venn diagram of target gene of hsa-miR-195-5p.
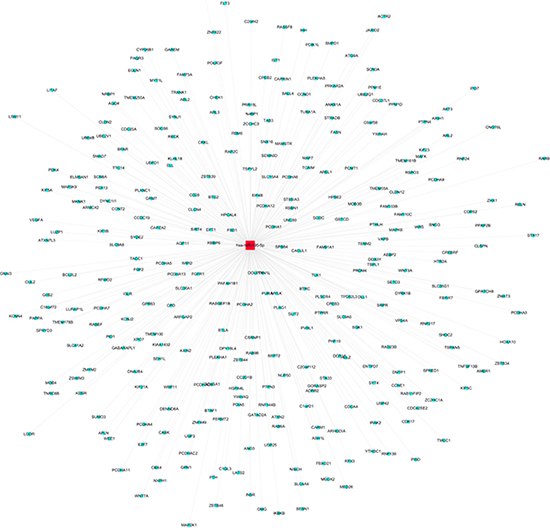
Figure 4: Network of target gene of hsa-miR-195-5p.
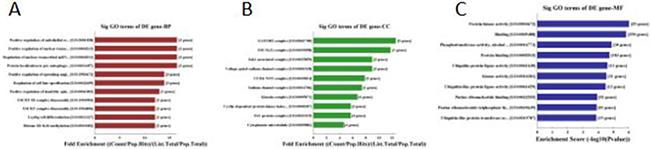
Figure 5: GO analysis of hsa-miR-195-5p: 5A was biological process, 5B was cellular component and 5C was molecular function.
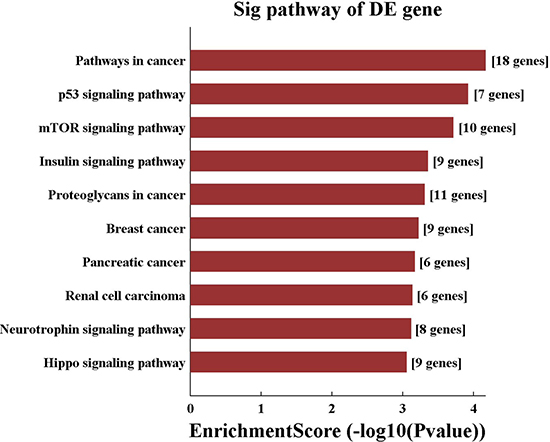
Figure 6: KEGG pathway analysis of hsa-miR-195-5p.
DISCUSSION
Previous studies have suggested that collapse occurs because of an imbalance between bone resorption and bone formation after femoral head osteonecrosis, resulting in femoral heads with reduced structural strength that are unable to bear external forces. The studies have also suggested that mechanical support and adjustment of bone cell metabolism can prevent collapse [25]. To comprehensively understand the biological behavior of osteocytes, an increasing number of studies have focused on the differential expression of miRNAs associated with osteonecrosis of the femoral head [23–24, 26–28]. We evaluated whether the decrease in structural strength was associated with the differential expression of relevant miRNAs, which may lead to faster apoptosis and an increased imbalance with bone metabolism. We found that in the osteonecrotic region, hsa-miR-195-5p was down-regulated in the collapse area compared to in the non-collapsed area. This is the first study examining the relationship between miRNA and femoral head collapse.
The anatomical structure of osteonecrotic femoral head has four layers: cartilage, osteonecrotic area, sclerotic area, and normal area. Recent studies have proposed that the decrease in structural strength is correlated with sclerotic area and osteonecrotic edge, enabling collapse prediction [16, 19]. During the pathological process, collapse of the osteonecrotic femoral head occurs because of continuous spreading of trabecular fracture, which is not a sudden process, and thus the osteonecrotic area includes the collapse area and non-collapse area. Femoral head collapse originates from subchondral fracture. Therefore, in this study, subchondral fracture in the osteonecrotic femoral head was defined as the collapse area, while the area in the osteonecrotic femoral head without subchondral fracture was defined as the non-collapse area. Non-collapse and collapse are different pathological stages of osteonecrotic femoral head. We not only developed a method for predicting the risk of collapse, but also provide a new insight into preventing collapse using gene editing techniques.
It has been reported that miR-195-5p is a tumor-suppressor gene that mainly suppresses cell proliferation and invasion and is down regulated in cancer patients [29–34]. This gene inhibits hepatocellular carcinoma by regulating PHF19 [30], regulates rectal cancer through CDK8, regulates osteosarcoma by inhibiting NKD1 [33], regulates prostate cancer through Fra-1 or RPS6KB1 [34]. Based on these results, we hypothesized that the mechanism of collapse involves down-regulation of miR-195-5p, which disrupts the proliferation of normal osteoblasts and accelerates cell apoptosis. This leads to a further decrease in structural strength within the femoral head and failure to support external forces, eventually resulting in collapse. Future studies should examine methods of increasing the expression of miR-195-5p to treat cancer and the collapse of femoral head osteonecrosis.
The limitations of this study were as follows: firstly, small sample size, but with reproducibility; secondly, target genes and pathways were only predicted and require further validation; In addition, whether collapse leads to miRNA changes or miRNA changes lead to collapse remains unknown. These factors exhibit a mutually causal relationship. In future studies, we will evaluate the genetic pathways of the collapse-associated differential miRNAs and gene editing technology to prevent and treat collapse.
MATERIALS AND METHODS
Material collection
Three patients were randomly selected from the hospital system in our department. Inclusion criteria were as follows: 1. diagnosed with steroid-induced femoral head osteonecrosis (a clear history of hormone use); 2. diagnosed with ACRO III/IV stage based on X-ray by 3 doctors; and 3. the surgeon and patient decided to perform the total hip joint replacement surgery. Exclusion criteria were as follows: 1. The cause of femoral head osteonecrosis was not clear or involved multiple factors; 2. Severe liver and kidney failure in which the patient could not tolerate surgery; And 3. Surgical strategy in which patient consent was not obtained. Informed consent was obtained from all patients and the ethical review committee of our hospital. According to the inclusion and exclusion criteria, three patients were selected. There were 2 males, one of whom at the age of 30 years used hormones to treat thrombocytopenic purpura, while the other, at the age of 46 years, used hormones to treat skin disease. At the age of 20 years, the female patient used hormones to treat systemic lupus erythematosus.
Sample selection
After surgery, femoral heads were removed and cleaned with saline. Three bone tissues (normal area, collapse area, and non-collapse area) were taken from femoral heads (Figure 7). Two doctors identified these tissues, and a total of 9 samples were obtained (T1 T2 T3, W1 W2 W3, and Z1 Z2 Z3). Bone tissues were immediately stored in liquid nitrogen and ground into powder (≥ 100 mg) in liquid nitrogen. The powder was transferred to an microcentrifuge tube, mixed with 1 mL Trizol, and stored at −70°C until use.
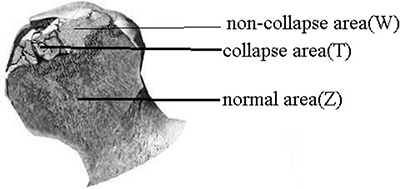
Figure 7: Bone tissues were taken from normal area, collapse area, and non-collapse area of femoral heads.
Total RNA extraction, RNA labeling, hybridization and microarray chip scanning [23]
Total RNA extraction and quality control
Total RNA was extracted from tissue cells using Trizol Reagent (Invitrogen life technologies) according to the manufacturer’s instructions; total RNA was extracted from whole blood using TRI reagent BD (MRCgene, TB-126). Total RNA was extracted from plasma and serum exosomes using TRIzol LS. RNAsey Mini Kit (QIAGEN) was used for RNA purification; NanoDrop ND-1000 was employed for measurement of RNA concentration after purification. RNA integrity was detected by electrophoresis.
RNA labeling and hybridization using the exiqon method [23]
After extraction, RNA samples underwent quality control and miRNA was labeled using miRCURYTM Array Power Labeling kit (Cat #208032-A, Exiqon). The detailed steps are described as follows:One microgram RNA sample was added to 2 μL water, and then 1 μL CIP buffer and CIP enzyme (Exiqon) were added to the RNA sample solution, and the mixture solution was incubated at 37°C for 30 min. The reaction in the sample solution was terminated at 95°C for 5 min, and then 3 μL labeling buffer, 1.5μL fluorescent label (Hy3™), 2.0 μL DMSO, and 2.0 μL labeling enzyme were added and the solution was incubated at 16°C for 1 h.The reaction in the samples was terminated at 65°C for 15 min.
After labeling, the sample was hybridized with miRCURYTM LNA Array (v.18.0) (Exiqon), and the subsequent procedures were conducted according to Exiqon’s experimental methods.the hybridization system used was the Nimblegen system (Nimblegen Systems Inc., Addison, WI, USA).The microarray chip was rinsed with Wash buffer kit (Exiqon) after hybridization.
The microarray chip was scanned by the axon GenePix 4000B Microarray Scanner [23]
GenePix Pro V6.0 was utilized to read the microarray scan images and the probe signals were selected. The median was taken and combined for the same probes. Probes >= 30.0 for the samples were kept and the median was standardized in all microarray chips. (Figure 8) miRNAs showing differential expressions of more than 1.5-fold were selected [24].
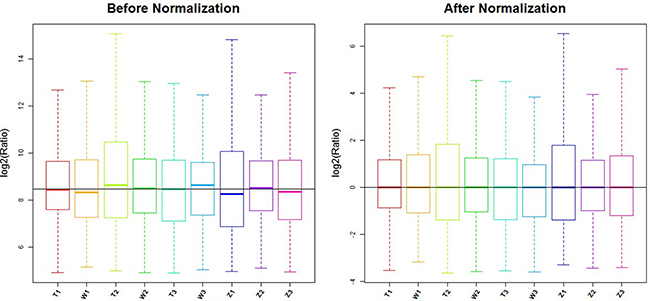
Figure 8: Box plot: after normalization, the median line of 9 samples were equal.
Verification of significantly differentially expressed miR-195-5p by RT-PCR
cDNA synthesis of RNA samples [23]. 20 μL of RT reaction mixture was prepared, then all cDNA samples were separately set up in the RT-PCR System (Applied Biosystems); The solution was mixed up to 8 μL and centrifuged at 5000 rpm for a short period.
The mixture was added to each well of a 384-well PCR plate, and then 2 μL corresponding cDNA was added to each well. The plate was sealed with sealing film and centrifuged. The 384-well PCR plate was placed in the RT-PCR amplification instrument to carry out the PCR reaction. U6 (internal reference) and all parameters were conducted.
The RT-PCR reaction was performed for the target miRNA in all samples and the internal reference gene (U6) separately. In Table 1, data analysis was performed using 2-ΔΔCT method. SPSS 20.0 (SPSS Inc., Chicago, Ill., USA) was employed for statistical analysis of the data.
Predication of target gene of miR-195-5p
TargetScan, mirBase and miRanda bioinformatics software were used to predict target genes. Gene Ontology(GO, http://www.geneontology.org/) analysis and Kyoto Encyclopedia of Genes and Genomes(KEGG, www.genome.jp/kegg/) pathway analysis were done respectively. The GO project covers three domains: Biological Process, Cellular Component and Molecular Function. Fisher’s exact test is used to find if there is more overlap between the differential expression (DE) list and the GO annotation list than would be expected by chance. The p-value denotes the significance of GO terms enrichment in the DE genes. The lower the p-value, the more significant the GO Term (p-value <= 0.05 ).Pathway analysis is a functional analysis mapping genes to KEGG pathways. The p-value denotes the significance of the Pathway correlated to the conditions. Lower the p-value, more significant is the Pathway(p-value cut-off is 0.05).
CONFLICTS OF INTEREST
None.
FUNDING
This research was supported by grants from the National Natural Science Foundation of China (No. 81373652).
REFERENCES
1. Guo KJ, Zhao FC, Guo Y, Li FL, Zhu L, Zheng W. The influence of age, gender and treatment with steroids on the incidence of osteonecrosis of the femoral head during the management of severe acute respiratory syndrome: a retrospective study. Bone Joint J. 2014; 96:259–62.
2. Lieberman JR, Berry DJ, Mont MA, Aaron RK, Callaghan JJ, Rajadhyaksha AD, Urbaniak JR. Osteonecrosis of the hip: management in the 21st century. Instr Course Lect. 2003; 52:337–55.
3. Ikeuchi K, Hasegawa Y, Seki T, Takegami Y, Amano T, Ishiguro N. Epidemiology of nontraumatic osteonecrosis of the femoral head in Japan. Mod Rheumatol. 2015; 25:278–81.
4. Kang JS, Moon KH, Kwon DG, Shin BK, Woo MS. The natural history of asymptomatic osteonecrosis of the femoral head. Int Orthop. 2013; 37:379–84.
5. Mont MA, Zywiel MG, Marker DR, McGrath MS, Delanois RE. The natural history of untreated asymptomatic osteonecrosis of the femoral head: a systematic literature review. J Bone Joint Surg Am. 2010; 92:2165–70.
6. Amanatullah DF, Strauss EJ, Di Cesare PE. Current management options for osteonecrosis of the femoral head: part 1, diagnosis and nonoperative management. Am J Orthop (Belle Mead NJ). 2011; 40:E186–92.
7. Lieberman JR, Engstrom SM, Meneghini RM, SooHoo NF. Which factors influence preservation of the osteonecrotic femoral head. Clin Orthop Relat Res. 2012; 470:525–34.
8. Zalavras CG, Lieberman JR. Osteonecrosis of the femoral head: evaluation and treatment. J Am Acad Orthop Surg. 2014; 22:455–64.
9. Hungerford DS. Osteonecrosis: avoiding total hip arthroplasty. J Arthroplasty. 2002; 17:121–4.
10. Nam KW, Kim YL, Yoo JJ, Koo KH, Yoon KS, Kim HJ. Fate of untreated asymptomatic osteonecrosis of the femoral head. J Bone Joint Surg Am. 2008; 90:477–484.
11. Marker DR, Seyler TM, McGrath MS, Delanois RE, Ulrich SD, Mont MA. Treatment of early stage osteonecrosis of the femoral head. The Journal of Bone and Joint Surgery Series A. 2008; 90:175–187.
12. Moya-Angeler J, Gianakos AL, Villa JC, Ni A, Lane JM. Current concepts on osteonecrosis of the femoral head. World J Orthop. 2015; 6:590–601.
13. Sen RK. Management of avascular necrosis of femoral head at pre-collapse stage. Indian J Orthop. 2009; 43:6–16.
14. Tripathy SK, Goyal T, Sen RK. Management of femoral head osteonecrosis: Current concepts. Indian J Orthop. 2015; 49:28–45.
15. Sun W, Li ZR, Wang BL, Liu BL, Zhang QD, Guo WS. Relationship between preservation of the lateral pillar and collapse of the femoral head in patients with osteonecrosis. Orthopedics. 2014; 37:e24–8.
16. Karasuyama K, Yamamoto T, Motomura G, Sonoda K, Kubo Y, Iwamoto Y. The role of sclerotic changes in the starting mechanisms of collapse: A histomorphometric and FEM study on the femoral head of osteonecrosis. Bone. 2015; 81:644–8.
17. Lee YK, Ha YC, Cho YJ, Suh KT, Kim SY, Won YY, Min BW, Yoon TR, Kim HJ, Koo KH. Does Zoledronate Prevent Femoral Head Collapse from Osteonecrosis? A Prospective, Randomized, Open-Label, Multicenter Study. J Bone Joint Surg Am. 2015; 97:1142–8.
18. Kubota S, Inaba Y, Kobayashi N, Tateishi U, Ike H, Inoue T, Saito T. Prediction of femoral head collapse in osteonecrosis using 18F-fluoride positron emission tomography. Nucl Med Commun. 2015; 36:596–603.
19. Yu T, Xie L, Zhang Z, Ke X, Liu Y. Prediction of osteonecrosis collapse of the femoral head based on the proportion of the proximal sclerotic rim. Int Orthop. 2015; 39:1045–50.
20. Yamasaki K, Nakasa T, Miyaki S, Yamasaki T, Yasunaga Y, Ochi M. Angiogenic microRNA-210 is present in cells surrounding osteonecrosis. J Orthop Res. 2012; 30:1263–70.
21. Yuan HF, Christina VR, Guo CA, Chu YW, Liu RH, Yan ZQ. Involvement of MicroRNA-210 Demethylation in Steroid-associated Osteonecrosis of the Femoral Head. Sci Rep. 2016; 6:20046.
22. Hao C, Yang S, Xu W, Shen JK, Ye S, Liu X, Dong Z, Xiao B, Feng Y. MiR-708 promotes steroid-induced osteonecrosis of femoral head, suppresses osteogenic differentiation by targeting SMAD3. Sci Rep. 2016; 6:22599.
23. Li P, Sun N, Zeng J, Zeng Y, Fan Y, Feng W, Li J. Differential expression of miR-672-5p and miR-146a-5p in osteoblasts in rats after steroid intervention. Gene. 2016; 591:69–73.
24. Wu X, Zhang Y, Guo X, Xu H, Xu Z, Duan D, Wang K. Identification of differentially expressed microRNAs involved in non-traumatic osteonecrosis through microRNA expression profiling. Gene. 2015; 565:22–9.
25. Gou WL, Lu Q, Wang X, Wang Y, Peng J, Lu SB. Key pathway to prevent the collapse of femoral head in osteonecrosis. Eur Rev Med Pharmacol Sci. 2015; 19:2766–74.
26. Du J, Liu W, Jin T, Zhao Z, Bai R, Xue H, Chen J, Sun M, Zhang X, Wang G, Wang J. A single-nucleotide polymorphism in MMP9 is associated with decreased risk of steroid-induced osteonecrosis of the femoral head. Oncotarget. 2016; 7:68434–68441. doi: 10.18632/oncotarget.12034.
27. Liu W, Mao L, Ji F, Chen F, Wang S, Xie Y. Icariside II activates EGFR-Akt-Nrf2 signaling and protects osteoblasts from dexamethasone. Oncotarget. 2016; 8:2594–2603. doi: 10.18632/oncotarget.13732.
28. Gu C, Xu Y, Zhang S, Guan H, Song S, Wang X, Wang Y, Li Y, Zhao G. miR-27a attenuates adipogenesis and promotes osteogenesis in steroid-induced rat BMSCs by targeting PPARγ and GREM1. Sci Rep. 2016; 6:38491.
29. Grünhagen J, Bhushan R, Degenkolbe E, Jäger M, Knaus P, Mundlos S, Robinson PN, Ott CE. MiR-497~195 cluster microRNAs regulate osteoblast differentiation by targeting BMP signaling. J Bone Miner Res. 2015; 30:796–808.
30. Xu H, Hu YW, Zhao JY, Hu XM, Li SF, Wang YC, Gao JJ, Sha YH, Kang CM, Lin L, Huang C, Zhao JJ, Zheng L, et al. MicroRNA-195-5p acts as an anti-oncogene by targeting PHF19 in hepatocellular carcinoma. Oncol Rep. 2015; 34:175–82.
31. Fei X, Qi M, Wu B, Song Y, Wang Y, Li T. MicroRNA-195-5p suppresses glucose uptake and proliferation of human bladder cancer T24 cells by regulating GLUT3 expression. FEBS Lett. 2012; 586:392–7.
32. Summerer I, Unger K, Braselmann H, Schuettrumpf L, Maihoefer C, Baumeister P, Kirchner T, Niyazi M, Sage E, Specht HM, Multhoff G, Moertl S, Belka C, et al. Circulating microRNAs as prognostic therapy biomarkers in head and neck cancer patients. Br J Cancer. 2015; 113:76–82.
33. Lian F, Cui Y, Zhou C, Gao K, Wu L. Identification of a plasma four-microRNA panel as potential noninvasive biomarker for osteosarcoma. PLoS One. 2015;10:e0121499.
34. Wu J, Ji A, Wang X, Zhu Y, Yu Y, Lin Y, Liu Y, Li S, Liang Z, Xu X, Zheng X, Xie L. MicroRNA-195-5p, a new regulator of Fra-1, suppresses the migration and invasion of prostate cancer cells. J Transl Med. 2015; 13:289.