
Introduction
Tuberculosis (TB) is a chronic infectious disease caused by Mycobacterium tuberculosis (MTB). Data from the global tuberculosis report estimated a worldwide incidence of 8.7 million cases, most of which occurred in Asia and Africa [1]. One-third of the world’s population is potentially infected with M. tuberculosis, but only 10% of the infected individuals eventually develop clinical TB, indicating that the host’s genetic and other factors (such as alcohol consumption, malnutrition, and human immunodeficiency virus infection) may play essential and complex roles in determining susceptibility and progression to tuberculosis [2-4]. An increasing number of studies have focused on the relationship between genetic variations of several genes and TB susceptibility [5, 6].
Currently, the gene encoding interferon-γ (IFNG) is the most extensively studied gene regarding tuberculosis susceptibility. Human IFNG is located on chromosome 12 (12q14) and has four exons spanning approximately 6 kb. Interferon-γ (IFN-γ), which is encoded by IFNG and produced by T helper 1 (Th1) lymphocytes, is upregulated and secreted as a major cytokine to activate macrophages, and is critical for the control of M. tuberculosis infection [7]. Cases of active TB are characterized by decreased production of IFN-γ from the peripheral blood mononuclear cells compared with that observed in latent infection. In addition, local and systemic IFN-γ levels correlate with the severity of the disease [8].
Lio et al. first noted a significant association between the +874A/T polymorphism (rs2430561) in IFNG and protection against TB in Sicilia (P < 0.05) [9]. The SNP +874 (A/T) is located at the 5′-end of a CA repeat in the first intron of the human IFNG [10]. The +874 T-allele is linked to the 12 CA repeats, whereas the A-allele is linked to the non-twelve CA repeats [11]. The specific sequence of the T-allele provides a binding site for the transcription factor nuclear factor-κB [12, 13]. As nuclear factor-κB induces IFN-γ expression, the presence of the T-allele correlates with high IFN-γ expression, whereas that of the A-allele correlates with low expression.
Many epidemiologic studies, including meta-analyses [14, 15], suggested associations between IFNG +874 T/A (rs2430561) polymorphism and the risk of developing TB. However, the data were inconsistent, partly because of differences in study populations and case ascertainment criteria, or small sample sizes with a high rate of false-positives and limited power of detecting modest associations. Considering the important role of IFNG +874 T/A (rs2430561) polymorphism in TB development, we studied all eligible case-control studies that included characteristics such as ethnicity of the patients, types of tuberculosis, and control sources.
Results
Study characteristics
Using various combinations of key terms, 152 article titles were retrieved by a literature search using the PubMed and SinoMed databases. As shown in Figure 1, 66 articles were excluded after screening the abstracts of the manuscripts. The full texts were evaluated, and 47 additional articles were excluded because of the following reasons: duplication (two), meta-analysis (seven), review (twelve), discussion on polymorphism in other diseases (tegumentary leishmaniasis and leprosy) (two), other SNPs in IFNG (one), IFNG receptor gene polymorphisms (fifteen), and other genes (three), and lacked case-control study (five). Finally, 39 different articles [9, 16-53] concerning IFNG +874 T/A (rs2430561) polymorphism and TB susceptibility were included in our meta-analysis (Table 1). Overall, 42 case-control studies with 8,574 cases and 9,011 controls were retrieved based on the search criteria. The controls were mainly healthy populations. First, we checked the Minor Allele Frequency (MAF) reported for the five main worldwide populations in the 1000 Genomes Browser: East Asian, 0.8413; European, 0.5378; African, 0.8327; American, 0.7464; and South Asian, 0.6104. The MAF in our analysis was 0.324 and 0.382 in the case and control group, respectively, both lower than the results in the 1000 Genomes Browser database. Then, the frequency of the T-allele was found to be significantly higher in case individuals of Caucasian ethnicity than in those of African or mixed ethnicities (41.3% vs. 22.9%, P = 0.005, or 41.3% vs. 27.2%, P = 0.017, respectively). A similar trend was found in the control group (Figure 2). Except for seven studies [16, 21, 26, 30, 36, 38, 43], the distribution of genotypes in all the controls was in agreement with Hardy-Weinberg equilibrium (HWE).
Table 1: Basic information for included studies of the association between IFNG +874 T/A (rs2430561) polymorphism site and tuberculosis susceptibility.
First author |
Year |
Origin |
Source of Control |
Ethnicity |
Type |
Sample size |
Case |
Control |
Case |
Control |
Control |
Methods |
NOS |
|||||||||||
Ref No |
TT |
TA |
AA |
MAF |
HWE |
TT |
TA |
AA |
MAF |
HWE |
||||||||||||||
Amim*[34] |
2008 |
Brazil |
HB |
Mixed |
TB |
<100 |
93 |
266 |
15 |
25 |
53 |
0.296 |
0.0006 |
67 |
88 |
111 |
0.417 |
0.001 |
PCR-ARMS |
6 |
||||
Anand[21] |
2010 |
India |
HB |
Asian |
PTB |
<100 |
62 |
66 |
7 |
27 |
28 |
0.331 |
0.898 |
8 |
25 |
33 |
0.311 |
0.35 |
PCR-ASP |
6 |
||||
Ansari*[53] |
2009 |
Pakistan |
HB |
Asian |
PTB |
>100 |
111 |
188 |
27 |
47 |
37 |
0.455 |
0.123 |
25 |
87 |
76 |
0.364 |
0.98 |
PCR-ARMS |
7 |
||||
Ansari*[53] |
2009 |
Pakistan |
HB |
Asian |
EPTB |
<100 |
77 |
188 |
12 |
36 |
29 |
0.389 |
0.881 |
25 |
87 |
76 |
0.364 |
0.98 |
PCR-ARMS |
7 |
||||
Anuradha*[27] |
2008 |
India |
PB |
Asian |
Children TB |
<100 |
25 |
90 |
5 |
13 |
7 |
0.46 |
0.815 |
29 |
42 |
19 |
0.555 |
0.6 |
PCR |
6 |
||||
Asgharzadeh[64] |
2016 |
Iran |
PB |
Asian |
TB |
>100 |
124 |
200 |
10 |
42 |
72 |
0.25 |
0.281 |
28 |
81 |
91 |
0.342 |
0.15 |
PCR-ARMS |
8 |
||||
Bhanothu[47] |
2015 |
India |
HB |
Asian |
EPTB |
>100 |
175 |
100 |
45 |
87 |
43 |
0.506 |
0.941 |
29 |
62 |
9 |
0.6 |
0.003 |
ARMS-MG/ MP-PCR |
6 |
||||
Cooke*[36] |
2006 |
UK |
PB |
African |
PTB |
>100 |
667 |
597 |
20 |
159 |
488 |
0.149 |
0.115 |
13 |
166 |
415 |
0.162 |
0.45 |
PCR-ARMS |
6 |
||||
Ding*[26] |
2008 |
China |
PB |
Asian |
TB |
>100 |
301 |
310 |
19 |
89 |
193 |
0.211 |
0.052 |
32 |
114 |
164 |
0.287 |
0.07 |
sequencing |
8 |
||||
Etokebe*[40] |
2005 |
Croatia |
HB |
Caucasian |
TB |
>100 |
242 |
519 |
53 |
122 |
67 |
0.471 |
0.637 |
103 |
282 |
134 |
0.47 |
0.04 |
PCR-ASP |
6 |
||||
Fitness*[48] |
2004 |
Malawi |
PB |
African |
TB |
>100 |
451 |
703 |
12 |
134 |
305 |
0.175 |
0.549 |
17 |
219 |
467 |
0.179 |
0.14 |
PCR-ARMS |
8 |
||||
Gutlapalli[32] |
2016 |
India |
HB |
Asian |
TB |
>100 |
247 |
129 |
73 |
123 |
51 |
0.544 |
0.951 |
60 |
58 |
11 |
0.689 |
0.56 |
PCR-ARMS |
6 |
||||
Hashemi[20] |
2011 |
Iran |
PB |
Asian |
PTB |
>100 |
142 |
166 |
18 |
84 |
40 |
0.422 |
0.011 |
33 |
111 |
22 |
0.533 |
0.001 |
PCR-ARMS |
7 |
||||
Hu[45] |
2015 |
China |
PB |
Asian |
TB |
>100 |
360 |
480 |
36 |
124 |
200 |
0.272 |
0.013 |
67 |
201 |
212 |
0.349 |
0.08 |
PCR-ARMS |
7 |
||||
Hwang*[50] |
2007 |
Korea |
PB |
Asian |
PTB |
<100 |
80 |
80 |
1 |
13 |
66 |
0.094 |
0.696 |
0 |
21 |
59 |
0.131 |
0.17 |
PCR-ARMS |
7 |
||||
Leandro[43] |
2013 |
Brazil |
PB |
Mixed |
TB |
>100 |
172 |
179 |
22 |
78 |
72 |
0.354 |
0.902 |
26 |
91 |
62 |
0.399 |
0.42 |
PCR-ARMS |
8 |
||||
Lee[44] |
2015 |
Taiwan |
PB |
Asian |
TB |
>100 |
200 |
202 |
131 |
56 |
13 |
0.795 |
0.046 |
144 |
54 |
4 |
0.846 |
0.68 |
TaqMan |
8 |
||||
Lio[9] |
2002 |
Italy |
PB |
Caucasian |
PTB |
<100 |
45 |
97 |
4 |
30 |
11 |
0.422 |
0.013 |
25 |
47 |
25 |
0.5 |
0.06 |
PCR-ARMS |
8 |
||||
Lopez- Maderuelo*[39] |
2003 |
Spain |
PB |
Caucasian |
PTB |
>100 |
113 |
100 |
11 |
40 |
62 |
0.274 |
0.238 |
19 |
50 |
31 |
0.44 |
0.88 |
PCR |
6 |
||||
Ma*[49] |
2007 |
China |
PB |
Asian |
PTB |
<100 |
60 |
60 |
2 |
10 |
48 |
0.117 |
0.138 |
8 |
20 |
32 |
0.3 |
0.11 |
PCR-SSP |
6 |
||||
Mabunda[29] |
2015 |
Brazil |
HB |
Mixed |
PTB |
>100 |
101 |
360 |
3 |
32 |
66 |
0.188 |
0.708 |
21 |
136 |
203 |
0.247 |
0.77 |
TaqMan |
7 |
||||
Moran*[30] |
2007 |
USA |
PB |
African |
TB |
>100 |
240 |
174 |
9 |
87 |
144 |
0.219 |
0.348 |
11 |
65 |
98 |
0.25 |
0.96 |
sequencing |
7 |
||||
Moran*[30] |
2007 |
USA |
PB |
Caucasian |
TB |
<100 |
161 |
64 |
24 |
92 |
45 |
0.435 |
0.039 |
16 |
31 |
17 |
0.492 |
0.8 |
sequencing |
7 |
||||
Moran*[30] |
2007 |
USA |
PB |
Caucasian |
TB |
<100 |
319 |
98 |
24 |
96 |
199 |
0.226 |
0.013 |
10 |
26 |
62 |
0.235 |
0.01 |
sequencing |
7 |
||||
Mosaad[42] |
2010 |
Egypt |
HB |
Caucasian |
TB |
>100 |
110 |
118 |
32 |
60 |
18 |
0.563 |
0.253 |
52 |
60 |
6 |
0.695 |
0.03 |
PCR-ARMS |
6 |
||||
Onay*[22] |
2010 |
Turkey |
HB |
Caucasian |
Children TB |
<100 |
40 |
67 |
9 |
22 |
9 |
0.5 |
0.527 |
16 |
35 |
16 |
0.5 |
0.71 |
PCR-ARMS |
6 |
||||
Oral*[35] |
2006 |
Turkey |
PB |
Caucasian |
TB |
<100 |
81 |
50 |
21 |
29 |
31 |
0.438 |
0.014 |
8 |
21 |
21 |
0.37 |
0.48 |
PCR-SSP |
8 |
||||
Rossouw*[38] |
2003 |
UK |
PB |
African |
TB |
>100 |
313 |
235 |
25 |
102 |
186 |
0.243 |
0.078 |
26 |
98 |
111 |
0.319 |
0.53 |
PCR |
6 |
||||
Sallakci*[33] |
2007 |
Turkey |
HB |
Caucasian |
TB |
>100 |
361 |
115 |
50 |
182 |
129 |
0.391 |
0.262 |
26 |
58 |
31 |
0.478 |
0.91 |
sequencing |
6 |
||||
Selma*[25] |
2011 |
Tunisia |
PB |
African |
TB |
>100 |
223 |
150 |
38 |
85 |
100 |
0.361 |
0.009 |
22 |
86 |
42 |
0.433 |
0.04 |
PCR-RFLP |
7 |
||||
Selvaraj*[52] |
2008 |
India |
HB |
Asian |
PTB |
>100 |
160 |
178 |
20 |
72 |
68 |
0.35 |
0.889 |
23 |
76 |
79 |
0.342 |
0.48 |
PCR-RFLP |
7 |
||||
Shen[28] |
2013 |
China |
PB |
Asian |
Children TB |
>100 |
189 |
164 |
136 |
53 |
0 |
0.859 |
0.024 |
133 |
29 |
2 |
0.899 |
0.77 |
sequencing |
6 |
||||
Tso*[37] |
2005 |
Hong Kong |
HB |
Asian |
TB |
>100 |
385 |
451 |
17 |
101 |
267 |
0.175 |
0.068 |
55 |
190 |
206 |
0.332 |
0.28 |
sequencing |
6 |
||||
Vallinoto*[23] |
2010 |
Brazil |
PB |
Mixed |
TB |
>100 |
162 |
156 |
11 |
58 |
93 |
0.247 |
0.635 |
24 |
86 |
46 |
0.429 |
0.12 |
PCR-ASO |
7 |
||||
Vidyarani*[31] |
2006 |
India |
HB |
Asian |
PTB |
>100 |
129 |
127 |
14 |
54 |
61 |
0.318 |
0.694 |
20 |
52 |
55 |
0.362 |
0.2 |
PCR-ARMS |
6 |
||||
Wang*[54] |
2011 |
China |
HB |
Asian |
PTB |
>100 |
273 |
297 |
3 |
78 |
192 |
0.154 |
0.107 |
3 |
84 |
210 |
0.151 |
0.08 |
PCR-RFLP |
6 |
||||
Wang*[24] |
2010 |
China |
PB |
Asian |
PTB |
>100 |
521 |
526 |
14 |
80 |
427 |
0.104 |
<0.001 |
10 |
91 |
425 |
0.105 |
0.06 |
PCR-RFLP |
6 |
||||
Wit*[51] |
2011 |
South Africa |
PB |
Mixed |
TB |
>100 |
500 |
315 |
40 |
194 |
266 |
0.274 |
0.579 |
33 |
124 |
158 |
0.301 |
0.24 |
PCR-RFLP |
6 |
||||
Wu*[41] |
2008 |
China |
PB |
Asian |
PTB |
<100 |
61 |
122 |
1 |
10 |
50 |
0.098 |
0.554 |
2 |
24 |
96 |
0.114 |
0.72 |
PCR-RFLP |
8 |
||||
Yang*[57] |
2010 |
China |
HB |
Asian |
PTB |
>100 |
189 |
191 |
6 |
41 |
142 |
0.14 |
0.168 |
3 |
49 |
139 |
0.143 |
0.57 |
PCR-SSP |
6 |
||||
Zhong[55] |
2014 |
China |
HB |
Asian |
PTB |
>100 |
142 |
166 |
4 |
26 |
112 |
0.119 |
0.117 |
7 |
49 |
110 |
0.189 |
0.61 |
TaqMan |
6 |
||||
Zhuang[56] |
2009 |
China |
HB |
Asian |
PTB |
>100 |
167 |
167 |
12 |
53 |
102 |
0.231 |
0.172 |
37 |
70 |
60 |
0.431 |
0.06 |
PCR-SSP |
5 |
||||
HWE: Hardy–Weinberg equilibrium; HB: hospital-based; PB: population-based; TB: tuberculosis; PTB: pulmonary TB, EPTB: extra-pulmonary TB; PCR-FLIP: polymerase chain reaction and restrictive fragment length polymorphism; PCR-ARMS: polymerase chain reaction-amplification refractory mutation specific; PCR-ASP: allele specific primers by polymerase chain reaction, PCR-SSP: polymerase chain reaction-sequence specific primer; PCR-ASO: polymerase chain reaction-allele-specific oligonucleotide; ARMS-MG/MP-PCR: Amplification refractory mutation system-multi gene/multi primer polymerase chain reaction; NOS: Newcastle-Ottawa Scale; *: studies reported in previous meta-analysis; bold: these nine studies including both PTB and EPTB.
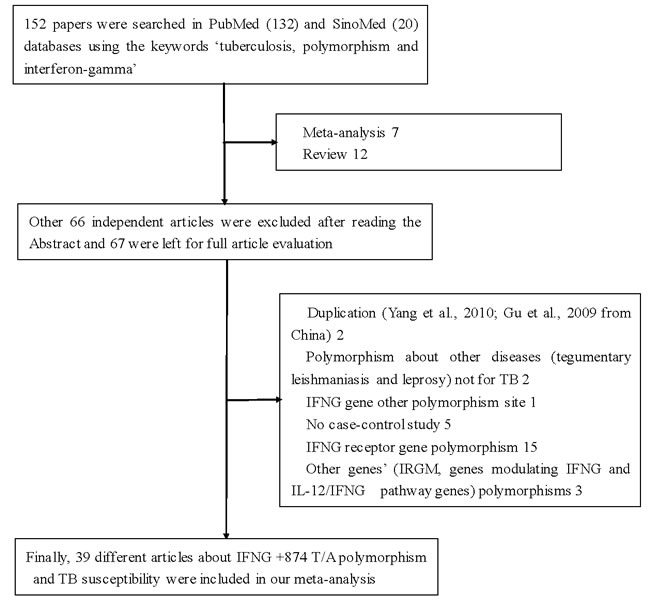
Figure 1: Flowchart illustrating the search strategy used to identify association studies for IFNG +874 T/A (rs2430561) polymorphism and tuberculosis risk.
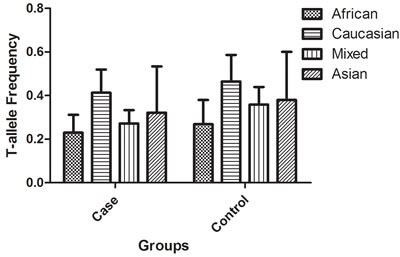
Figure 2: T-allele frequencies for the IFNG +874 T/A (rs2430561) polymorphism among cases/controls stratified by ethnicity. Vertical line, T-allele frequency; Horizontal line, ethnicity type.
Quantitative synthesis
In the overall analysis, a significant protective association could be observed between TB risk and the variant genotype of IFNG +874 T/A (rs2430561) polymorphism in different genetic models. For example, for the additive model (TA vs. AA), odds ratios (OR) = 0.71, 95% confidence intervals (CI) = 0.63-0.80, P-value of heterogeneity test (Ph) = 1×10⁻⁶, and in the dominant model, OR = 0.68, 95% CI = 0.60-0.77, Ph = 1×10⁻⁶ (Figure 3, Table 2). If some studies that do not conform to HWE were removed, these associations were not affected.
In the ethnicity type subgroup, this pattern of positive association was maintained in the whole genetic models. For example, for the allelic effect, OR = 0.84, 95% CI = 0.75-0.95, Ph = 0.276 for Africans; OR = 0.73, 95% CI = 0.63-0.84, Ph = 1×10⁻⁶ for Asians; OR = 0.79, 95% CI = 0.65-0.97, Ph = 0.013 for Caucasians; OR = 0.67, 95% CI = 0.52-0.84, Ph = 0.009 for mixed ethnicity (Figure 4, Table 2). Similar results were detected in the source of control analysis. For example, in the dominant model, OR = 0.69, 95% CI = 0.54-0.86, Ph = 1×10⁻⁶ for HB, and OR = 0.68, 95% CI = 0.59-0.79, Ph = 1×10⁻⁶ for PB (Figure 5, Table 2).
In the stratified analysis by TB type, significant associations were found with both pulmonary tuberculosis (PTB) and extra-pulmonary tuberculosis (EPTB) risks and IFNG +874 T/A (rs2430561) polymorphism in the five genetic models. For example, for the additive model (TT vs. AA), OR = 0.60, 95% CI = 0.44-0.81, Ph = 1×10⁻⁶ for PTB, and OR = 0.45, 95% CI = 0.27-0.75, Ph = 0.007 for EPTB (Figure 6, Table 2).
To improve our study, finally we made stratified subgroup analyses according to genotyping methods and sample size. Some positive associations were also found in this section (Table 2).
Table 2: Total and stratified subgroup analysis for IFNG +874 T/A(rs2430561) polymorphism site and tuberculosis susceptibility.
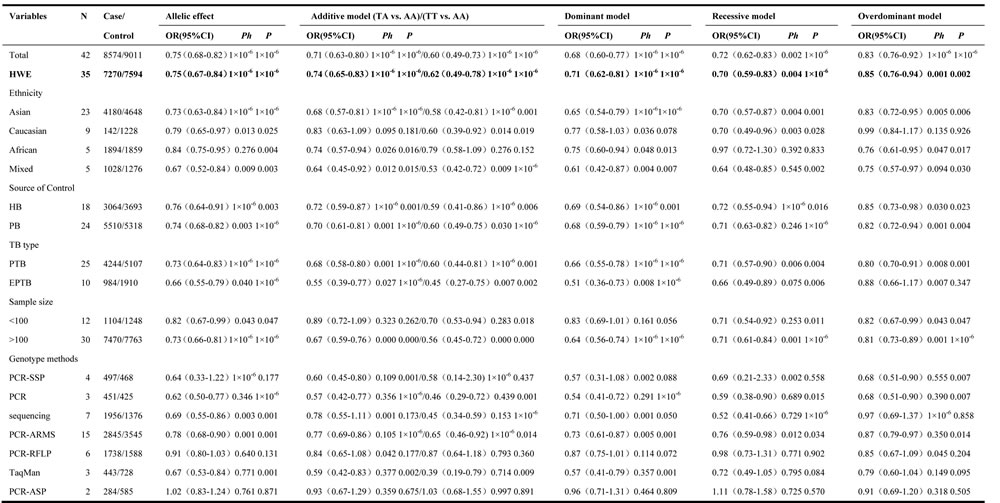
Ph: value of Q-test for heterogeneity test; P: Z-test for the statistical significance of the OR. HWE: Except for seven studies[20,25,30,34,40,42,47], the distribution of genotypes in the controls in remaining 35 studies was in agreement with HWE, and it reports the meta-analysis results of studies showing no deviation from the HWE.
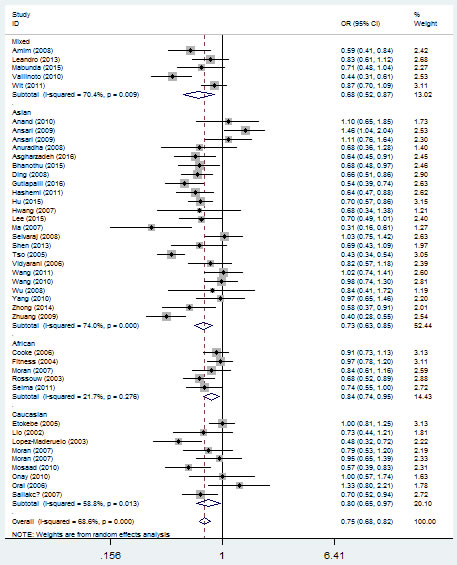
Figure 3: Forest plot of tuberculosis risk associated with IFNG +874 T/A (rs2430561) polymorphism (additive model, TA vs. AA) in the whole. The squares and horizontal lines correspond to the study-specific OR and 95% CI. The area of the squares reflects the weight (inverse of the variance). The diamond represents the summary OR and 95% CI.
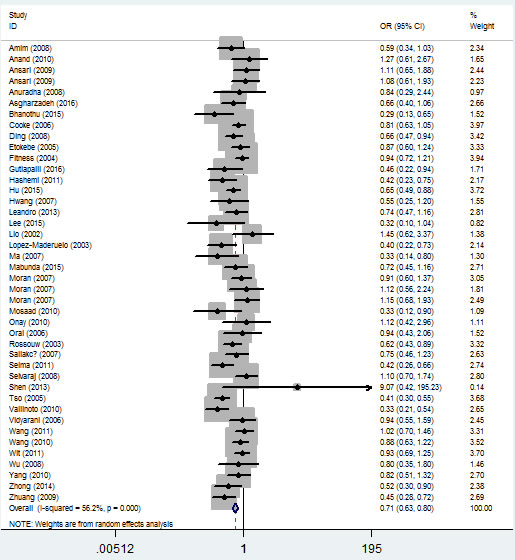
Figure 4: Forest plot of tuberculosis risk associated with IFNG +874 T/A (rs2430561) polymorphism (the allelic effect) by ethnicity. The squares and horizontal lines correspond to the study-specific OR and 95% CI. The area of the squares reflects the weight (inverse of the variance). The diamond represents the summary OR and 95% CI.
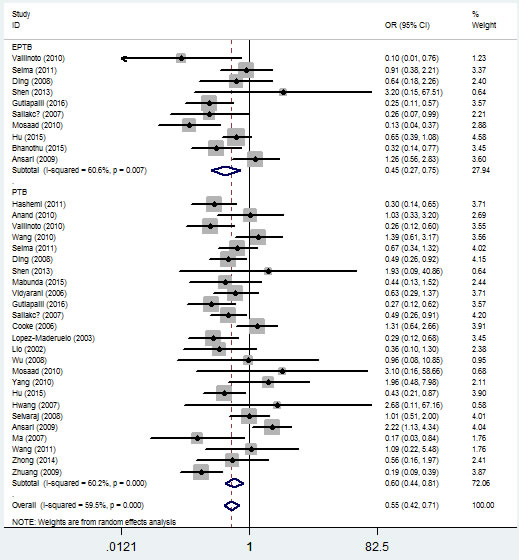
Figure 5: Forest plot of tuberculosis risk associated with IFNG +874 T/A (rs2430561) polymorphism (dominant model) by source of control. The squares and horizontal lines correspond to the study-specific OR and 95% CI. The area of the squares reflects the weight (inverse of the variance). The diamond represents the summary OR and 95% CI.
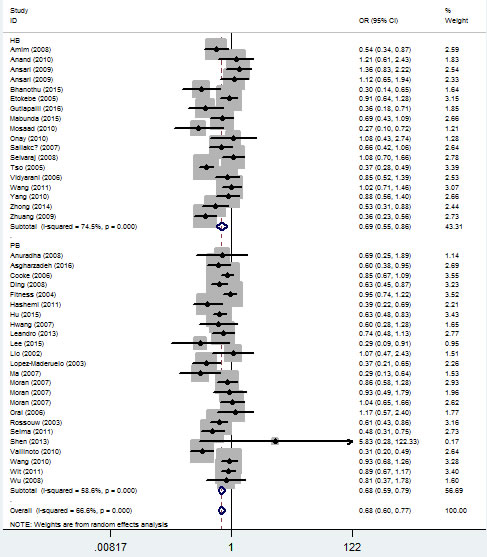
Figure 6: Forest plot of tuberculosis risk associated with IFNG +874 T/A (rs2430561) polymorphism (additive model, TT vs. AA) by type of tuberculosis. The squares and horizontal lines correspond to the study-specific OR and 95% CI. The area of the squares reflects the weight (inverse of the variance). The diamond represents the summary OR and 95% CI.
Bias diagnosis and sensitivity analysis
The Begg’s funnel plot and Egger’s test were performed to access the publication bias of the literature. The shape of the funnel plot did not reveal any obvious asymmetry, and the Egger’s test suggested the absence of publication bias. For example, in the additive model (TA vs. AA) analysis, z = 1.11, P = 0.269 for Begg’s test and t = −0.87, P = 0.389 for Egger’s test (Figures 7, 8, Table 3). We used a sensitivity analysis to determine whether modification of the meta-analysis inclusion criteria affected the results. No single study qualitatively influenced the summary ORs, as indicated by the sensitivity analysis (for example, the allelic effect, Figure 9).
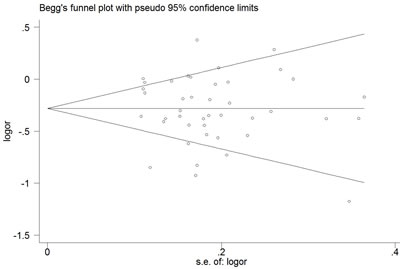
Figure 7: Begg’s funnel plot for publication bias test (additive model, TA vs. AA). Each point represents a separate study for the indicated association. Log [OR], natural logarithm of OR. Horizontal line, mean effect size.
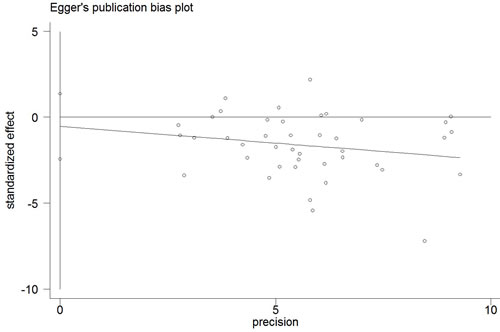
Figure 8: Egger’s publication bias plot (additive model, TA vs. AA).
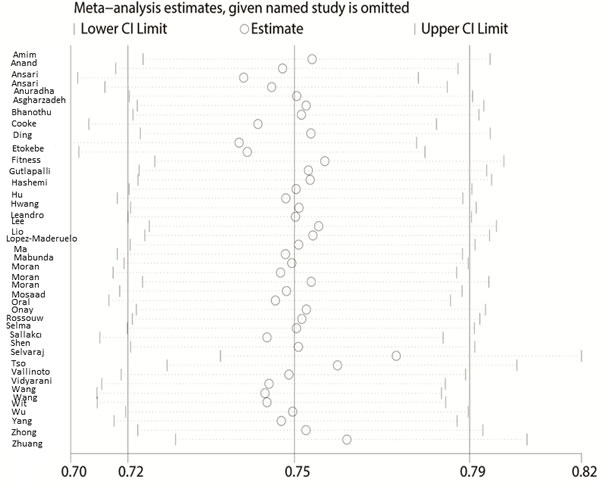
Figure 9: Sensitivity analysis between IFNG +874 T/A (rs2430561) polymorphism and tuberculosis risk (the allelic effect).
Discussion
To understand the pathogenesis of TB and better predict individual risk, it is important to identify the SNPs that affect the function of genes contributing to TB susceptibility. Genome-wide association studies (GWAS) allow genotyping of frequent genetic polymorphisms in the genome without assuming the genomic location of the causal variants. As most of the genome has been surveyed, GWAS eliminates the disadvantages associated with the single polymorphism or candidate gene approach where only a few polymorphisms are investigated [54]. However, GWAS may identify false associations, and therefore, replication or validation of the results in independent populations is essential [55]. A Wellcome Trust Case-Control Consortium-based study initiated GWAS that considered up to 2,000 cases and controls each for tuberculosis and malaria. This study identified NRAMP1, IFNG, NOS2A, MBL, VDR, and certain TLR-associated genes as important for susceptibility to TB and malaria, and the list has been growing ever since [55-57].
Lio et al. [9] were the first to investigate the association between IFNG +874 T/A (rs2430561) polymorphism and the risk of developing TB. Since then, other researchers have reproduced their work on IFNG in different populations and for two disparate types of TB. However, the results were confounding, even within populations. Meta-analysis provides a means for effectively increasing the size of the sample by pooling data from individual correlation studies, thus enhancing the statistical power of the analysis to estimate genetic effects [58]. We used this method to demonstrate statistically significant genetic associations.
To the best of our knowledge, this is the first systematic meta-analysis exploring the associations between IFNG polymorphism and TB risk. Our analysis involved about 8,574 individuals with TB and 9,011 controls. The main discovery of our study was that the T-allele of the IFNG +874 T/A (rs2430561) polymorphism showed a protective effect for TB susceptibility, which was consistent with the observation that the presence of the T-allele correlates with high IFN-γ expression and increased resistance to M. tuberculosis infection, whereas the A-allele correlates with low expression. The highlight of our article is that we classified TB into PTB and EPTB, which assisted in the analysis of effective target sites for different types of TB, and thereby, we provided a novel concept compared to the previously published meta-analyses [14, 15].
Although considerable efforts and resources have been invested in examining the possible associations between IFN gene polymorphisms and TB risk, certain inherent limitations exist. First, although we collected all eligible studies, the sample sizes of these studies were not large enough to provide adequate statistical power to evaluate the association between this polymorphism and TB risk, particularly for certain ethnicities. Thus, not only was there an increased likelihood of type I/II error, but also a lack of sufficient statistical power to evaluate the association between these polymorphisms and tuberculosis risk. Second, because of the complex nature of the immune system and the polygenic nature of complex diseases, such as TB, it has become increasingly evident that gene-gene interactions play a far more important part in an individual’s susceptibility to tuberculosis than single polymorphisms would on their own [59]. Specific environmental and lifestyle factors, including age, sex, smoking habits, familial history, and disease stage, may possibly alter the associations between IFNG polymorphisms and TB. Therefore, it is necessary to evaluate the roles of specific environmental factors and lifestyles in disease prognosis.
In spite of these drawbacks, our meta-analysis provided several advantages. First, a substantial number of cases and controls were pooled from different studies, which significantly increased the statistical power of the analysis. Second, no publication bias was found and the Newcastle-Ottawa Scale (NOS) scores of the included studies indicated high quality. Third, our study contained the highest number of individuals so far, which conferred increased statistical power and credibility. The power of this meta-analysis of +874 T/A (rs2430561) polymorphism was greater than 0.95, which suggested that the data was trustworthy.
In conclusion, our present meta-analysis suggests that the +874 T/A (rs2430561) polymorphism in IFNG may be associated with the risk of developing TB. Further studies that consider additional gene-environment interactions and are based on larger sample sizes should be conducted to elucidate the role of IFNG polymorphisms in the etiology and clinical characteristics of TB development.
Table 3: Publication bias tests (Begg’s funnel plot and Egger’s test for publication bias test) for IFNG +874 T/A(rs2430561) polymorphism.
Egger's test |
Begg's test |
||||||
Genetic type |
Coefficient |
Standard error |
t |
P value |
95%CI of intercept |
z |
P value |
Allelic effect |
-0.521 |
0.946 |
-0.55 |
0.585 |
(-2.432,1.390) |
0.26 |
0.795 |
Additive model (TA vs. AA) |
-0.443 |
0.509 |
-0.87 |
0.389 |
(-1.473, 0.587) |
1.11 |
0.269 |
Additive model (TT vs. AA) |
-0.08 |
0.345 |
-0.23 |
0.817 |
(-0.778, 0.617) |
0.09 |
0.931 |
Dominant model |
-0.414 |
0.545 |
-0.76 |
0.452 |
(-1.516, 0.688) |
1 |
0.319 |
Recessive model |
-0.108 |
0.381 |
0.28 |
0.779 |
(-0.663, 0.878) |
0.76 |
0.448 |
Overdominant model |
-0.559 |
0.687 |
-0.81 |
0.42 |
(-1.945, 0.829) |
0.89 |
0.347 |
Materials and Methods
Search strategy
We searched the PubMed and SinoMed (http://www.sinomed.ac.cn/) databases through October 2016, using the keywords “tuberculosis,” “TB,” “polymorphism,” and “IFN-gamma.” One hundred and fifty-two articles were retrieved, 39 of which satisfied our inclusion criteria. We also screened references of the retrieved articles and reviewed all articles via a manual search.
Inclusion and exclusion criteria
For inclusion, studies were required to (i) assess the association between TB risk and IFNG +874 T/A (rs2430561) polymorphism; (ii) be case-controlled, and (iii) contain all three kinds of genotypes (TT, TA, and AA) for cases and controls. Studies were excluded if they (i) included no control population; (ii) did not report genotype frequency data, and (iii) were duplicated publications.
Quality score assessment
The NOS [60] was selected to assess the quality of each study. This measure assesses aspects of the methodologies used in observational studies, which are related to the study quality, including selection of cases, comparability of populations, and ascertainment of exposure to risks. The NOS rating ranges from zero stars (worst) to nine stars (best). Studies with a score of seven stars or greater were considered to be of high quality.
Data extraction
Two authors independently extracted the data that complied with the selection criteria. These data included the first author’s last name, year of publication, country of origin, ethnicity of the study population, TB type, genotypes of both the case and control groups, source of control, HWE/ MAF in both case and control groups, and genotyping method. Ethnicity was categorized as Caucasian, Asian, African, and mixed population. The control subgroups were population-based (PB) and hospital-based (HB). The TB type included PTB and EPTB. All included studies were classified as larger (both number of case and control ≥ 100 samples) and medium-sized studies. The NOS score was also shown in this section.
Statistical analysis
Based on the genotype frequencies for cases and controls, OR with 95% CI were used to measure the strength of the associations between the +874 T/A (rs2430561) single nucleotide polymorphism (SNP) in IFNG and TB risk. The statistical significance of the OR was determined with the Z-test. The heterogeneity assumption among studies was evaluated using a χ2-based Q-test. A P-value of > 0.10 for the Q-test indicated a lack of heterogeneity among studies. If significant heterogeneity was detected, the DerSimonian-Laird random-effects model was used; otherwise, the Mantel-Haenszel fixed-effects model was chosen [61, 62]. We investigated the relationship between IFNG +874 T/A (rs2430561) polymorphism and tuberculosis risk by testing the allelic effect (T vs. A), additive model (TT vs. AA and TA vs. AA), dominant model (T carriers vs. AA), recessive model (TT vs. A carriers), and overdominant model (TA vs. AA + TT). A sensitivity analysis was performed by successively omitting studies to assess the stability of the results. The departure of frequencies of the IFNG +874 T/A (rs2430561) polymorphism from the expected under HWE was assessed by Pearson’s χ2 test, and P < 0.05 was considered significant [63]. Publication bias was assessed by both Egger’s test and Begg’s test, and a P-value < 0.05 was considered significant [64]. All statistical tests for this meta-analysis were performed using the Stata software version 11.0 (StataCorp LP, College Station, TX, USA). The power of our meta-analysis was calculated online using the website http://www.power-analysis.com/.
Genotyping methods
Genotyping of the IFNG +874 T/A (rs2430561) SNP was conducted using methods described in the retrieved literature, such as polymerase chain reaction-restriction fragment length polymorphism (PCR-RFLP), polymerase chain reaction-amplification refractory mutation specific (PCR-ARMS), polymerase chain reaction-allele specific primers (PCR-ASP), polymerase chain reaction-sequence specific primer (PCR-SSP), polymerase chain reaction-allele-specific oligonucleotide (PCR-ASO), and amplification refractory mutation system-multi gene/multi primer polymerase chain reaction (ARMS-MG/MP-PCR).
Abbreviations
TB, tuberculosis; PB, population-based; HB, hospital-based; MTB, Mycobacterium tuberculosis; IFNG, interferon-γ; Th1, T helper 1; PTB, pulmonary tuberculosis; EPTB, extra-pulmonary tuberculosis; HWE, Hardy-Weinberg equilibrium; MAF, Minor Allele Frequency; GWAS, Genome-wide association studies; NOS, Newcastle-Ottawa Scale; PCR-RFLP, polymerase chain reaction-restriction fragment length polymorphism; PCR-ARMS, polymerase chain reaction-amplification refractory mutation specific; PCR-ASP, polymerase chain reaction-allele specific primers; PCR-SSP, polymerase chain reaction-sequence specific primer; PCR-ASO, polymerase chain reaction-allele-specific oligonucleotide; ARMS-MG/MP-PCR, amplification refractory mutation system-multi gene/multi primer polymerase chain reaction.
CONFLICTS OF INTEREST
The authors declare no conflict of interest.
References
1 WHO. Global tuberculosis report. World Health Organization, Geneva. 2012.
2. Dolin PJ, Raviglione MC, Kochi A. Global tuberculosis incidence and mortality during 1990-2000. Bull World Health Organ. 1994;72:213-220.
3. Casanova JL, Abel L. The human model: a genetic dissection of immunity to infection in natural conditions. Nat Rev Immunol. 2004;4:55-66.
4. Dorman SE, Hatem CL, Tyagi S, Aird K, Lopez-Molina J, Pitt ML, Zook BC, Dannenberg AM Jr, Bishai WR, Manabe YC. Susceptibility to tuberculosis: clues from studies with inbred and outbred New Zealand Whiterabbits. Infect Immun. 2004;72:1700-1705.
5. Möller M, Hoal EG. Current findings, challenges and novel approaches in human genetic susceptibility to tuberculosis. Tuberculosis (Edinb). 2010;90:71-83.
6. Yim JJ, Selvaraj P. Genetic susceptibility in tuberculosis. Respirology. 2010;15:241-256.
7. Lee J, Kornfeld H. Interferon-γ Regulates the Death of M. tuberculosis-Infected Macrophages. J Cell Death. 2010;3:1-11.
8. Condos R, Rom WN, Liu YM, Schluger NW. Local immune responses correlate with presentation and outcome in tuberculosis. Am J Respir Crit Care Med. 1998;157:729-735.
9. Lio D, Marino V, Serauto A, Gioia V, Scola L, Crivello A, Forte GI, Colonna-Romano G, Candore G, Caruso C. Genotype frequencies of the +874T-->A single nucleotide polymorphism in the first intron of theinterferon-gamma gene in a sample of Sicilian patients affected by tuberculosis. Eur J Immunogenet. 2002;29:371-374.
10. Bream JH, Carrington M, O’Toole S, Dean M, Gerrard B, Shin HD, Kosack D, Modi W, Young HA, Smith MW. Polymorphisms of the human IFNG gene noncoding regions. Immunogenetics. 2000;51:50-58.
11. Pravica V, Perrey C, Stevens A, Lee JH, Hutchinson IV. A single nucleotide polymorphism in the first intron of the human IFN-gamma gene: absolute correlation with a polymorphic CA microsatellite marker of high IFN-gamma production. Hum Immunol. 2000;61:863-866.
12. Pravica V, Asderakis A, Perrey C, Hajeer A, Sinnott PJ, Hutchinson IV. In vitro production of IFN-gamma correlates with CA repeat polymorphism in the human IFN-gammagene. Eur J Immunogenet. 1999;26:1-3.
13. Bream JH, Ping A, Zhang X, Winkler C, Young HA. A single nucleotide polymorphism in the proximal IFN-gamma promoter alters control of gene transcription. Genes Immun. 2002;3:165-169.
14. Tian C, Zhang Y, Zhang J, Deng Y, Li X, Xu D, Huang H, Huang J, Fan H. The +874T/A polymorphism in the interferon-γ gene and tuberculosis risk: an update by meta-analysis. Hum Immunol. 2011;72:1137-1142.
15. de Albuquerque AC, Rocha LQ, de Morais Batista AH, Teixeira AB, Dos Santos DB, Nogueira NA. Association of polymorphism +874 A/T of interferon-γ and susceptibility to the development of tuberculosis: meta-analysis. Eur J Clin Microbiol Infect Dis. 2012;31:2887-2895.
16. Hashemi M, Sharifi-Mood B, Nezamdoost M, Moazeni-Roodi A, Naderi M, Kouhpayeh H, Taheri M, Ghavami S. Functional polymorphism of interferon-γ (IFN-γ) gene +874T/A polymorphism is associated withpulmonary tuberculosis in Zahedan, Southeast Iran. Prague Med Rep. 2011;112:38-43.
17. Prabhu Anand S, Harishankar M, Selvaraj P. Interferon gamma gene +874A/T polymorphism and intracellular interferon gamma expression inpulmonary tuberculosis. Cytokine. 2010;49:130-133.
18. Onay H, Ekmekci AY, Durmaz B, Sayin E, Cosar H, Bayram N, Can D, Akin H, Ozkinay C, Ozkinay F. Interferon-gamma gene and interferon-gamma receptor-1 gene polymorphisms in children withtuberculosis from Turkey. Scand J Infect Dis. 2010;42:39-42.
19. Vallinoto AC, Graça ES, Araújo MS, Azevedo VN, Cayres-Vallinoto I, Machado LF, Ishak MO, Ishak R. IFNG +874T/A polymorphism and cytokine plasma levels are associated with susceptibility toMycobacterium tuberculosis infection and clinical manifestation of tuberculosis. Hum Immunol. 2010;71:692-696.
20. Wang J, Tang S, Shen H. Association of genetic polymorphisms in the IL12-IFNG pathway with susceptibility to and prognosisof pulmonary tuberculosis in a Chinese population. Eur J Clin Microbiol Infect Dis. 2010;29:1291-1295.
21. Ben Selma W, Harizi H, Bougmiza I, Hannachi N, Ben Kahla I, Zaieni R, Boukadida J. Interferon gamma +874T/A polymorphism is associated with susceptibility to active pulmonarytuberculosis development in Tunisian patients. DNA Cell Biol. 2011;30:379-387.
22. Ding S, Li L, Zhu X. Polymorphism of the interferon-gamma gene and risk of tuberculosis in a southeastern Chinesepopulation. Hum Immunol. 2008;69:129-133.
23. Anuradha B, Rakh SS, Ishaq M, Murthy KJ, Valluri VL. Interferon-gamma Low producer genotype +874 overrepresented in Bacillus Calmette-Guerinnonresponding children. Pediatr Infect Dis J. 2008;27:325-329.
24. Shen C, Jiao WW, Feng WX, Wu XR, Xiao J, Miao Q, Sun L, Wang BB, Wang J, Liu F, Shen D, Shen AD. IFNG polymorphisms are associated with tuberculosis in Han Chinese pediatric female population. Mol Biol Rep. 2013;40:5477-5482.
25. Mabunda N, Alvarado-Arnez LE, Vubil A, Mariamo A, Pacheco AG, Jani IV, Moraes MO. Gene polymorphisms in patients with pulmonary tuberculosis from Mozambique. Mol Biol Rep. 2015;42:71-76.
26. Moran A, Ma X, Reich RA, Graviss EA. No association between the +874T/A single nucleotide polymorphism in the IFN-gamma gene and susceptibility to TB. Int J Tuberc Lung Dis. 2007;11:113-115.
27. Vidyarani M, Selvaraj P, Prabhu Anand S, Jawahar MS, Adhilakshmi AR, Narayanan PR. Interferon gamma (IFNgamma) & interleukin-4 (IL-4) gene variants & cytokine levels in pulmonary tuberculosis. Indian J Med Res. 2006;124:403-410.
28. Gutlapalli VR, Sykam A, Tenali SP, Suneetha S, Suneetha LM. High levels of plasma interferon gamma and +874T/A gene polymorphism is associated with HIV-TBco-infection. Hum Immunol. 2016;77:1264-1270.
29. Sallakci N, Coskun M, Berber Z, Gürkan F, Kocamaz H, Uysal G, Bhuju S, Yavuzer U, Singh M, Yeğin O. Interferon-gamma gene+874T-A polymorphism is associated with tuberculosis and gamma interferon response. Tuberculosis (Edinb). 2007;87:225-230.
30. Amim LH, Pacheco AG, Fonseca-Costa J, Loredo CS, Rabahi MF, Melo MH, Ribeiro FC, Mello FC, Oliveira MM, Lapa e Silva JR, Ottenhoff TH, Kritski AL, Santos AR. Role of IFN-gamma +874 T/A single nucleotide polymorphism in the tuberculosis outcome among Brazilians subjects. Mol Biol Rep. 2008;35:563-566.
31. Oral HB, Budak F, Uzaslan EK, Baştürk B, Bekar A, Akalin H, Ege E, Ener B, Göral G. Interleukin-10 (IL-10) gene polymorphism as a potential host susceptibility factor in tuberculosis. Cytokine. 2006;35:143-147.
32. Cooke GS, Campbell SJ, Sillah J, Gustafson P, Bah B, Sirugo G, Bennett S, McAdam KP, Sow O, Lienhardt C, Hill AV. Polymorphism within the interferon-gamma/receptor complex is associated with pulmonary tuberculosis. Am J Respir Crit Care Med. 2006;174:339-343.
33. Tso HW, Ip WK, Chong WP, Tam CM, Chiang AK, Lau YL. Association of interferon gamma and interleukin 10 genes with tuberculosis in Hong Kong Chinese. Genes Immun. 2005;6:358-363.
34. Rossouw M, Nel HJ, Cooke GS, van Helden PD, Hoal EG. Association between tuberculosis and a polymorphic NFkappaB binding site in the interferon gammagene. Lancet. 2003;361:1871-1872.
35. López-Maderuelo D, Arnalich F, Serantes R, González A, Codoceo R, Madero R, Vázquez JJ, Montiel C. Interferon-gamma and interleukin-10 gene polymorphisms in pulmonary tuberculosis. Am J Respir Crit Care Med. 2003;167:970-975.
36. Etokebe GE, Bulat-Kardum L, Johansen MS, Knezevic J, Balen S, Matakovic-Mileusnic N, Matanic D, Flego V, Pavelic J, Beg-Zec Z, Dembic Z. Interferon-gamma gene (T874A and G2109A) polymorphisms are associated with microscopy-positive tuberculosis. Scand J Immunol. 2006;63:136-141.
37. Wu F, Qu Y, Tang Y, Cao D, Sun P, Xia Z. Lack of association between cytokine gene polymorphisms and silicosis and pulmonarytuberculosis in Chinese iron miners. J Occup Health. 2008;50:445-454.
38. Mosaad YM, Soliman OE, Tawhid ZE, Sherif DM. Interferon-gamma +874 T/A and interleukin-10 -1082 A/G single nucleotide polymorphism in Egyptian children with tuberculosis. Scand J Immunol. 2010;72:358-364.
39. Leandro AC, Rocha MA, Lamoglia-Souza A, VandeBerg JL, Rolla VC, Bonecini-Almeida Mda G. No association of IFNG+874T/A SNP and NOS2A-954G/C SNP variants with nitric oxide radical serumlevels or susceptibility to tuberculosis in a Brazilian population subset. Biomed Res Int. 2013;2013:901740.
40. Lee SW, Chuang TY, Huang HH, Lee KF, Chen TT, Kao YH, Wu LS. Interferon gamma polymorphisms associated with susceptibility to tuberculosis in a Han Taiwanesepopulation. J Microbiol Immunol Infect. 2015;48:376-380.
41. Hu Y, Wu L, Li D, Zhao Q, Jiang W, Xu B. Association between cytokine gene polymorphisms and tuberculosis in a Chinese population in Shanghai: a case-control study. BMC Immunol. 2015;16:8.
42. Asgharzadeh M, Ghorghanlu S, Rashedi J, Mahdavi Poor B, Khaki-Khatibi F, Moaddab SR, Samadi-Kafil H, Pourostadi M. Association of Promoter Polymorphisms of Interleukin-10 and Interferon-Gamma Genes withTuberculosis in Azeri Population of Iran. Iran J Allergy Asthma Immunol. 2016;15:167-173.
43. Bhanothu V, Lakshmi V, Theophilus JP, Rozati R, Badhini P, Vijayalaxmi B. Investigation of Toll-Like Receptor-2 (2258G/A) and Interferon Gamma (+874T/A) Gene Polymorphisms among Infertile Women with Female Genital Tuberculosis. PLoS One. 2015;10:e0130273.
44. Fitness J, Floyd S, Warndorff DK, Sichali L, Malema S, Crampin AC, Fine PE, Hill AV. Large-scale candidate gene study of tuberculosis susceptibility in the Karonga district of northern Malawi. Am J Trop Med Hyg. 2004;71:341-349.
45. Ma ZM, Xiao F, Tang LG, Liu JX, Tan XJ, Wang YN, Hao HB, Tan SY. Interferon gamma polymorphism was associated with tuberculosis susceptibility. Chin J Tuberc Respir Dis. 2007;30:777-778.
46. Hwang JH, Kim EJ, Kim SY, Lee SH, Suh GY, Kwon OJ, Ji Y, Kang M, Kim DH, Koh WJ. Polymorphisms of interferon-gamma and interferon-gamma receptor 1 genes and pulmonary tuberculosis in Koreans. Respirology. 2007;12:906-910.
47. de Wit E, van der Merwe L, van Helden PD, Hoal EG. Gene-gene interaction between tuberculosis candidate genes in a South African population. Mamm Genome. 2011;22:100-110.
48. Selvaraj P, Alagarasu K, Harishankar M, Vidyarani M, Nisha Rajeswari D, Narayanan PR. Cytokine gene polymorphisms and cytokine levels in pulmonary tuberculosis. Cytokine. 2008;43:26-33.
49. Ansari A, Talat N, Jamil B, Hasan Z, Razzaki T, Dawood G, Hussain R. Cytokine gene polymorphisms across tuberculosis clinical spectrum in Pakistani patients. PLoS One. 2009;4:e4778.
50. Wang HB, Guo W, Yang SL, Kang SH, Liu HY, Cao JF, Tian HW, Tan XY, Liu YX. Correlation between the genetic polymorphism of IFN-γ +874 site and susceptibility to pulmonary tuberculosis in patients with TB and healthy subjects. Hebei Medical Journal. 2011;33:3220-3222.
51. Zhong HJ, Lin Q, Wen YX, Liu LX, Zhang GL, Yang L, Wang Z, Tang Y. Effect of IFN-γ gene +874 single nucleotide polymorphism on susceptibility to tuberculosis and protein secretion. China Tropical Medicine. 2014;14:69-72.
52. Zhuang B. Epidemiology study on environment risk factors and hereditary susceptibility to pulmonary tuberculosis. A master’s degree thesis. 2009.
53. Yang H, Liang ZH, Liu XL, Wang F. Association between polymorphisms of interleukin-10, interferon-γ gene and the susceptibility to pulmonary tuberculosis. Chin J Epidemiol. 2010;31:155-158.
54. Hirschhorn JN, Daly MJ. Genome-wide association studies for common diseases and complex traits. Nat Rev Genet. 2005;6:95-108.
55. Burgner D, Jamieson SE, Blackwell JM. Genetic susceptibility to infectious diseases: big is beautiful, but will bigger be even better? Lancet Infect Dis. 2006;6:653-663.
56. Wellcome Trust Case Control Consortium. Genome-wide association study of 14,000 cases of seven common diseases and 3,000 sharedcontrols. Nature. 2007;447:661-678.
57. Möller M, de Wit E, Hoal EG. Past, present and future directions in human genetic susceptibility to tuberculosis. FEMS Immunol Med Microbiol. 2010;58:3-26.
58. Munafò MR, Flint J. Meta-analysis of genetic association studies. Trends Genet. 2004;20:439-444.
59. Tsai CT, Fallin D, Chiang FT, Hwang JJ, Lai LP, Hsu KL, Tseng CD, Liau CS, Tseng YZ. Angiotensinogen gene haplotype and hypertension: interaction with ACE gene I allele. Hypertension. 2003;41:9-15.
60. Wells GA, Shea B, O’Connell D, Peterson J, Welch V, Losos M, Tugwell P. The Newcastle-Ottawa Scale (NOS) for assessing the quality of nonrandomised studies in meta-analyses. Ottawa Health Research Institute. http://www.ohri.ca/programs/clinical_epidemiology/oxford.asp (accessed Oct 20, 2011).
61. Mantel N, Haenszel W. Statistical aspects of the analysis of data from retrospective studies of disease. J Natl Cancer Inst. 1959;22:719-748.
62. DerSimonian R, Laird N. Meta-analysis in clinical trials. Control Clin Trials. 1986;7:177-188.
63. Napolioni V. The relevance of checking population allele frequencies and Hardy-Weinberg Equilibrium ingenetic association studies: the case of SLC6A4 5-HTTLPR polymorphism in a Chinese Han Irritable Bowel Syndrome association study. Immunol Lett. 2014;162:276-278.
64. Hayashino Y, Noguchi Y, Fukui T. Systematic evaluation and comparison of statistical tests for publication bias. J Epidemiol. 2005;15:235-243.