
INTRODUCTION
Mucoepidermoid carcinoma (MEC), although rare, is the most common malignant salivary gland neoplasm. According to the WHO, MEC can be classified as low-, intermediate- or high-grade tumors based on the histological parameters necrosis, anaplasia, neural invasion, mitoses and percentage cystic growth [1]. Prognosis of high grade MEC is worse than that of low and intermediate grade tumors [2].
Determining genomic aberrations within MEC has gained interest because aberrations may be used as a classification tool for MEC. Earlier studies found that a subset of MEC carries a t(11;19)(q21;p13) translocation, leading to the CRTC1-MAML2 fusion gene [3–9]. MECs that harbor the t(11;19)(q21;p13) translocation generally have a more favorable prognosis than translocation negative tumors , irrespective of histological grade [5, 6].
A few studies have investigated the genomic copy number aberrations in MEC using micro-array comparative genomic hybridization (arrayCGH) technique. They have shown that low grade MEC samples, in general had fewer copy number aberrations than high grade MEC samples [7–9]. Furthermore, these studies found that translocation-positive MEC samples had fewer copy number aberrations compared to translocation-negative MEC samples. Both studies reported the loss of 9p21.3 and the gain of 5p15.33 and 8q24.3 regions. Anzick et al [7] found the loss of the 9p21.3, which harbors the CDKN2AB gene, exclusively in translocation-positive MEC samples), whereas Jee et al [8] reported that translocation-negative MEC samples also harbor this genomic aberration. Both studies concluded that the loss of the CDKN2A/B genes was associated with an unfavorable prognosis.
Due to the fact that MEC constitutes a group of diverse, non-frequently occurring tumors and considering different copy number aberrations reported in literature, confirmation of these results in another sample set seems to be warranted. Therefore, we have conducted a genomic analysis using arrayCGH to gain insight into chromosomal copy number in MEC. We compared the aberrations with histological grade and translocation status of each sample. Results suggest that two types of MECs can be distinguished: (i) a group of MECs without t(11;19)(q21;p13) translocation with many copy number aberrations (> 6), independent of histological grade, and (ii) a group of MECs with the t(11;19)(q21;p13) translocation with no or a few copy number aberrations (< 6 ) with two exceptions classified as low and intermediate grade.
RESULTS
Clinicopathological characteristics
The clinical and histopathological characteristics of patients and tumors in the study are shown in Table 1. The mean age of patients was 48 years (range 9–82). Eighteen tumors originated in the parotid gland and 9 tumors originated in minor salivary gland. Three patients had loco-regional recurrence of the tumor and 3 other patients developed a metastasis. One patient died of the disease. Of the 27 MECs, 17 were classified as low grade, 6 as intermediate grade and 4 as high grade. FISH analysis revealed that 17 of the total 27 MEC samples harbored the t(11;19)(q21;p13) translocation. These comprised 11 of the 17 low grade, 4 of the 6 intermediate grade and 2 of the 4 high grade samples (Table 1).
Table 1: Clinicopathological details of the 27 MEC samples
Sample1 |
Sex |
Age |
Tumor |
Recurrence/metastasis |
t–status3 |
|---|---|---|---|---|---|
LG1 |
f |
9 |
PG |
–/+ |
– |
LG2 |
m |
79 |
MSG |
–/– |
+ |
LG3 |
m |
45 |
PG |
–/– |
– |
LG4 |
f |
24 |
PG |
–/– |
+ |
LG5 |
f |
13 |
PG |
–/– |
+ |
LG6 |
m |
34 |
MSG |
–/– |
– |
LG7 |
m |
81 |
PG |
–/– |
+ |
LG8 |
f |
42 |
PG |
–/– |
+ |
LG9 |
m |
50 |
PG |
–/– |
+ |
LG10 |
f |
25 |
MSG |
–/– |
+ |
LG11 |
f |
45 |
PG |
–/– |
– |
LG12 |
f |
64 |
MSG |
–/+ |
+ |
LG13 |
m |
30 |
MSG |
–/– |
+ |
LG14 |
m |
57 |
PG |
–/– |
+ |
LG15 |
m |
62 |
PG |
–/– |
– |
LG16 |
f |
43 |
PG |
–/– |
+ |
LG17 |
m |
51 |
PG |
–/– |
– |
IntG1 |
m |
24 |
MSG |
–/– |
+ |
IntG2 |
f |
58 |
PG |
–/– |
– |
IntG3 |
f |
71 |
MSG |
–/+ |
+ |
IntG4 |
m |
14 |
PG |
–/– |
+ |
IntG5 |
m |
58 |
PG |
–/– |
– |
IntG6 |
f |
52 |
MSG |
+/+ |
+ |
HG1 |
m |
81 |
PG |
–/– |
– |
HG2 |
m |
43 |
PG |
–/– |
+ |
HG3 |
f |
82 |
PG |
–/– |
+ |
HG4 |
f |
59 |
MSG |
–/+ |
– |
1Histological grading: LG, low grade; IntG, intermediate grade; HG, high grade.
2Tumor site: PG, parotid gland; MSG, minor salivary gland.
3Presence of translocation t(11;19)(q21;p13).
Genomic profiles in MEC
ArrayCGH profiles of 27 MECs are presented in Figure 1. To be sure that we were picking up real copy number aberrations and not static we considered a copy number aberration real when it was being found in at least 3 samples). Using this criteria we found 37 gain and 23 losses (for all copy number alterations see Table 2). The most common copy number aberration was the loss of the 1q23.3 region, which was found in 5 MEC samples.
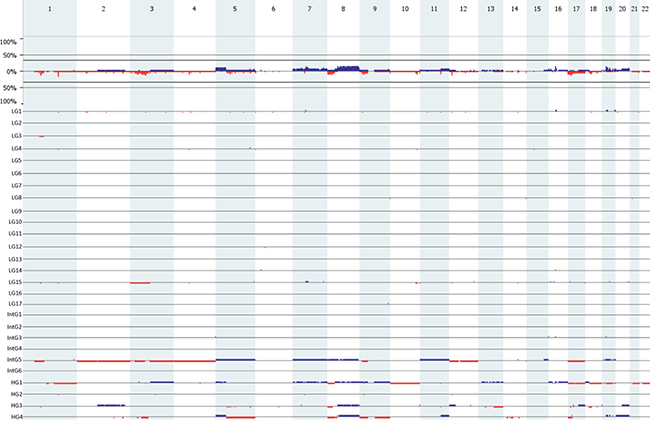
Figure 1: Genome-wide frequency plot (top). The Y-axix represents the percentage of the total group (n = 27). Underneath the genome-wide frequency plot, the individual arrayCGH profiles of the of 27 MEC samples (17 low; 6 intermediate; 4 high grade) used in the study. Gains are portrait in blue and losses are protrait in red.
Table 2: Recurring copy number aberrations in 27 MEC samples
Chromosome band |
Region coordinates |
Region Length (bp) |
Event |
No. of samples |
Candidate genes* |
|---|---|---|---|---|---|
1p31.1 |
81271921-82317822 |
1045901 |
Loss |
3 |
ADGRL2 |
1p31.1 |
82317822-83535674 |
1217852 |
Loss |
4 |
|
1p31.1-p22.3 |
83535674-85092491 |
1556817 |
Loss |
3 |
|
1q23.3 |
162789883-163066609 |
276726 |
Loss |
5 |
RGS4 |
3p23-p22.2 |
31951947-38114334 |
6162387 |
Loss |
3 |
MiR-26a-1, CTDSPL |
3p21.1-p14.1 |
51942767-69002771 |
17060004 |
Loss |
3 |
PBRM1, ADAMTS9 |
3p14.1 |
71138660-71270186 |
131526 |
Loss |
4 |
FOXP1 |
5p15.33 - p14.2 |
0-24691408 |
24691408 |
Gain |
3 |
PDCD6 TRIO |
5p14.1 |
26738646-26959771 |
221125 |
Gain |
3 |
|
5p14.1-p13.3 |
26959771-33389493 |
6429722 |
Gain |
3 |
DROSHA |
5p13.3-p13.2 |
33389493-36093914 |
2704421 |
Gain |
3 |
ADAMTS12, TARS, RAD1 |
5p13.1-q11.1 |
38884395-47700000 |
8815605 |
Gain |
3 |
DAB2 |
5q12.3-q13.1 |
66116648-67826992 |
1710344 |
Loss |
3 |
PIK3R1 |
7p14.1 |
38969086-40708290 |
1739204 |
Gain |
3 |
POU6F2 |
7q11.1-q11.21 |
59100000-62420609 |
3320609 |
Gain |
3 |
|
7q11.21-q11.23 |
62420609-71886202 |
9465593 |
Gain |
3 |
AUTS2 |
7q34 |
140141708-140795070 |
653362 |
Gain |
3 |
BRAF |
8p23.3-p21.2 |
0-24154814 |
24154814 |
Loss |
3 |
DEFA1, DEFB1, DLC1, MTUS1 |
8q11.1-q11.21 |
45200000-48882980 |
3682980 |
Gain |
4 |
|
8q11.21-q11.22 |
48882980-51942456 |
3059476 |
Gain |
3 |
SNAI2 |
8q12.1 |
52901077-56253836 |
3352759 |
Gain |
3 |
|
8q12.1 |
56253836-57369226 |
1115390 |
Gain |
4 |
PLAG1 |
8q12.1 |
57369226-59262605 |
-1893379 |
Gain |
3 |
|
8q12.1-q12.2 |
59262605-61867310 |
2604705 |
Gain |
4 |
CYP7A1, SDCBP |
8q12.2-q12.3 |
61867310-63949108 |
2081798 |
Gain |
3 |
|
8q12.3-q13.1 |
63949108-66631815 |
2682707 |
Gain |
4 |
CYP7B1 |
8q13.1-q13.2 |
66631815-69704074 |
3072259 |
Gain |
3 |
|
8q13.2-q13.3 |
69704074-71870918 |
2166844 |
Gain |
4 |
SULF1 |
8q13.3-q21.12 |
71870918-79997004 |
8126086 |
Gain |
4 |
|
8q21.12-q21.13 |
79997004-82856098 |
2859094 |
Gain |
3 |
FABP5 |
8q21.13-q21.2 |
82856098-85047238 |
2191140 |
Gain |
4 |
|
8q21.2-q21.3 |
85047238-87786949 |
2739711 |
Gain |
3 |
WWP1 |
8q21.3 |
87786949-90946365 |
3159416 |
Gain |
4 |
|
8q21.3 |
90946365-92054675 |
1108310 |
Gain |
3 |
|
8q21.3-q22.3 |
92054675-102317166 |
10262491 |
Gain |
4 |
RUNX1T1, CDH17, TP53INP1 |
8q22.3 |
102317166-104094744 |
1777578 |
Gain |
3 |
|
8q22.3-q23.1 |
104094744-107148474 |
3053730 |
Gain |
4 |
BAALC, CTHRC1 |
8q23.1 |
107939667-109558687 |
1619020 |
Gain |
3 |
ANGPT1 |
8q23.1-q24.23 |
109558687-139487231 |
29928544 |
Gain |
4 |
HAS2, TNFRSF11B, MYC |
8q24.23-q24.3 |
139487231-140865305 |
1378074 |
Gain |
3 |
TRAPPC9 |
8q24.3 |
140865305-146274826 |
5409521 |
Gain |
4 |
PTK2, MAFA, MAPK15 |
9p23-p22.3 |
13398392-14364288 |
965896 |
Loss |
3 |
|
9p21.3 |
20451378-20600059 |
148681 |
Loss |
3 |
|
9p21.3 |
21851680-23259683 |
1408003 |
Loss |
3 |
CDKN2A, CDKN2B, MTAP |
11q21 |
95420121-95735922 |
315801 |
Loss |
3 |
MAML2 |
12p13.2 |
11187958-11860096 |
672138 |
Loss |
4 |
ETV6, PRB1 |
16p11.2 |
31753818-33345523 |
1591705 |
Gain |
4 |
|
17p13.3 |
0-197784 |
197784 |
Loss |
3 |
|
17p13.3-p13.1 |
927102-7097922 |
6170820 |
Loss |
3 |
PLD2, MiR134 |
17p13.1-p12 |
7771326-11457982 |
3686656 |
Loss |
3 |
ALOX15B |
17p12 |
11457982-12504361 |
1046379 |
Loss |
4 |
MAP2K4 |
17p12 |
12504361-13787450 |
1283089 |
Loss |
3 |
ELAC2 |
17p12 |
13787450-14819919 |
1032469 |
Loss |
4 |
|
17p12-p11.2 |
14819919-17694955 |
2875036 |
Loss |
3 |
|
17p11.2-q11.1 |
19523822-22200000 |
2676178 |
Loss |
3 |
MAP2K3 |
18q12.1 |
26913332-28779980 |
1866648 |
Loss |
3 |
DSC3 |
19p12 |
19860022-20054862 |
194840 |
Gain |
3 |
|
19p12-q11 |
20054862-28500000 |
8445138 |
Gain |
3 |
|
19q12 |
34912078-36065910 |
1153832 |
Gain |
3 |
|
20q11.1-q13.33 |
27100000-59628718 |
32528718 |
Gain |
3 |
WISP2, MAFB, MIR296 |
*gene location according to UCSC Genome Browser on Human Feb. 2009 (GRCh37/hg19) Assembly.
Analysis based on histological grading (Figure 2) revealed that there was no differences between the number of copy number alterations between low and intermediate grade MEC samples (p = 0.763) and between intermediate and high grade MEC samples (p = 0.099). Therefore, we combined the low and intermediate grade MEC samples to form a low/intermediate grade MEC group.
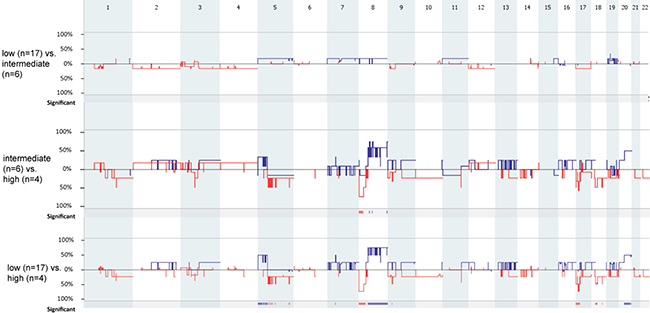
Figure 2: Genome-wide comparison between low (n = 17) vs. intermediate (n = 6), intermediate (n = 6) vs. high (n = 4), and low (n = 17) vs. high (n = 17) grade MEC samples. Gains are portrait in blue and losses are portrait in red. Regions of p < 0.05 are marked by horizontal bars of gains (blue) and losses (red) on the significance track.
Low/intermediate grade MEC samples had statistically significantly fewer copy number aberrations compared to high grade MEC samples (mean values: low/intermediate grade vs high grade: 3.48 vs 30, p = 0.0025). The deletion of 1p31.1 (containing ADGRL2), 1p31.1-p22.3 and 12p13.2 (containing ETV6), and the gain of 16p11.2 were exclusively found in the low/intermediate grade MEC samples, while the loss of 8p23.3-p12 (containing DEFB1, DLC1, MTUS1) was exclusively found in high grade MEC samples (Table 3).
Table 3: Recurrent copy number aberrations exclusively found in low/intermediate grade (n = 23) or in high grade MEC samples (n = 4)
Chromosome band |
Region coordinates |
Region Length (bp) |
Event |
No. of samples |
Present in LG/IntG or HG1 |
Candidate genes* |
|---|---|---|---|---|---|---|
1p31.1 |
81271921-82317822 |
1045901 |
Loss |
3 |
LG/IntG |
ADGRL2 |
1p31.1-p22.3 |
83535674-85092491 |
1556817 |
Loss |
3 |
LG/IntG |
|
8p23.3-p21.2 |
0-24154814 |
24154814 |
Loss |
3 |
HG |
DEFB1, DLC1, MTUS1 |
12p13.2 |
11187958-11860096 |
672138 |
Loss |
3 |
LG/IntG |
ETV6 |
16p11.2 |
31753818-33345523 |
1591705 |
Gain |
3 |
LG/IntG |
1LG/IntG, low/intermediate grade MEC; HG, high grade MEC.
*gene location according to UCSC Genome Browser on Human Feb. 2009 (GRCh37/hg19) Assembly.
Translocation-positive MEC contained fewer copy number aberrations than translocation-negative tumors (Figure 3) (mean values translocation-positive vs translocation-negative: 2.41 vs 15.9, p = 0.04). In total 22 copy number aberrations were found (11 loss and 11 gains), which were all found to be exclusive for translocation-negative MEC samples (see Table 4 for all copy number aberrations that were present in 3 or more translocation-negative MEC samples). The most common copy number aberration detected was the loss of 3p14.1 (containing FOXP1), which was found in 4 translocation-negative MEC samples (LG1, LG15, HG1 and HG4).
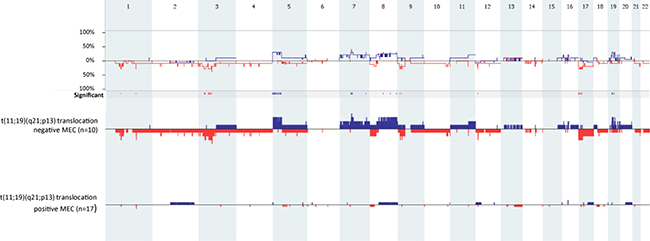
Figure 3: Genome-wide comparison between t(11;19)(q21;p13) translocation-positive (n = 17) and t(11;19)(q21;p13) translocation-negative MEC samples (n = 10). Gains are portrait in blue and losses are portrait in red. Regions of p < 0.05 are marked by horizontal bars of gains (blue) and losses (red) on the significance track.
Table 4: Recurring copy number aberrations exclusively found in MEC samples without the t(11;19)(q21;p13) translocation (n = 10)
Chromosome band |
Region coordinates |
Region length (bp) |
Event |
No. of samples |
Candidate gene(s)* |
|---|---|---|---|---|---|
1p31.1 |
81271921–82317822 |
1045901 |
Loss |
3 |
ADGRL2 |
3p23-p22.2 |
31951947–38114334 |
6162387 |
Loss |
3 |
MiR-26a-1, CTDSPL |
3p14.1 |
71138660–71270186 |
131526 |
Loss |
4 |
FOXP1 |
5p15.33-p14.2 |
0–24691408 |
24691408 |
Gain |
3 |
PDCD6, TRIO |
5p14.1 |
26738646–26959771 |
221125 |
Gain |
3 |
|
5p14.1-p13.3 |
26959771-33389493 |
6429722 |
Gain |
3 |
DROSHA |
5p13.3-p13.2 |
33389493–36093914 |
2704421 |
Gain |
3 |
ADAMTS12, TARS, RAD1 |
5p13.1-q11.1 |
38884395–47700000 |
8815605 |
Gain |
3 |
DAB2 |
7q11.1-q11.21 |
59,100,000–62,420,609 |
3320609 |
Gain |
3 |
|
7q11.21-q11.23 |
62420609–71886202 |
9465593 |
Gain |
3 |
AUTS2 |
7q34 |
140141708–140795070 |
653362 |
Gain |
3 |
BRAF |
8q24.23-q24.3 |
139487231–140865305 |
1378074 |
Gain |
3 |
TRAPPC9 |
9p23-p22.3 |
13398392–14364288 |
965896 |
Loss |
3 |
|
9p21.3 |
21851680–23259683 |
1408003 |
Loss |
3 |
CDKN2A, CDKN2B, MTAP |
17p13.3-p13.1 |
927102–7097922 |
6170820 |
Loss |
3 |
PLD2, MiR134 |
17p13.1-p12 |
7771326–11457982 |
3686656 |
Loss |
3 |
ALOX15B, |
17p12 |
11457982–12504361 |
1046379 |
Loss |
3 |
MAP2K4 |
17p12 |
12504361–13787450 |
1283089 |
Loss |
3 |
ELAC2, |
17p12-p11.2 |
14819919–17694955 |
2875036 |
Loss |
3 |
|
17p11.2-q11.1 |
19523822–22200000 |
2676178 |
Loss |
3 |
MAP2K3 |
19p12-q11 |
20054862–28500000 |
8445138 |
Gain |
3 |
|
19q12 |
34912078–36065910 |
1153832 |
Gain |
3 |
*gene location according to UCSC Genome Browser on Human Feb. 2009 (GRCh37/hg19) Assembly.
To demonstrate that the translocation-negative tumors are bona fide MEC, especially those with EVT6 loss, PLAG1 gain, and those derived from minor salivary glands (Supplementary Table 1), additional histologic pictures including immunohistochemical profiles using p63, S100 and AR (Supplementary Table 2) are shown in Supplementary Figures 1 and 2.
DISCUSSION
Mucoepidermoid carcinomas are salivary gland tumors with a variable histopathological differentiation. They have an unpredictable clinical outcome, which poses significant diagnostic and therapeutic challenges. Analysis of genomic aberrations may help in the classification of these tumors, but large scale analysis of the genomic imbalance in MEC is hampered because of its rather low frequency of occurrence. There are several arrayCGH based studies described as yet [7–9], using different spatial resolution, with different cut-offs for specific genetic aberration for all or for a subset of MEC. To us, this warranted further analysis of the genomic imbalance in an additional set of 27 well documented MECs.
In the present study, copy number aberrations were found in 14 out of 27 MEC samples (Table1). Based on the amount of copy number aberrations, two groups of MEC can be distinguished. One group with no or few copy number aberrations (6 or less), and another with multiple copy number aberrations (19 or more); the latter being about 22% of the total number of MEC samples. MEC samples harboring multiple copy number aberrations were found amongst all three histological grades.
With the exception of one sample (HG3), most of the MEC with multiple copy number aberrations were translocation-negative, while translocation-positive MEC samples had mostly 6 or less copy number aberrations. These findings confirmed the consensus in literature and may explain why t(11;19)(q21;p13) translocation-positive MEC have a more favorable survival outcome compared to transformation negative MECs, which are characterized by chromosomal instability [7–9].
Comparison with previous studies [7–9] underscores that MEC is extremely diverse with respect to copy number aberrations. For instance, the most frequently detected loss in the present set of MECs, 1q23.3 (containing RGS4) in 5 of the 27 MECs (Table 2), was not reported in the other studies, whereas the most frequently detected loss reported by Jee et al [8], 18q12.2-qter, was found only once in our sample set. Similarly, the majority of most frequently detected gains found in this study (Table 2) did not correspond with earlier research [8]. Only a set of small regions that were gained in chromosome 8 corresponded with a larger gain 8q11.1-q12.2 described by Jee et al [8].
Only one region found in our study, the lost region 9p21.3, was recorded to be by earlier studies [7, 8, 9]. The loss of 9p21.3, containing CDNK2A/B, initially suggested this occurrence to be specific to translocation-positive MEC [7], but later was also found in translocation-negative MEC [8]. In both studies, the loss of CDKN2A/B was associated with an unfavorable prognosis. Zhang et al [12] found that the region 9p21.3 was also deleted in adenoid cystic carcinoma and salivary duct carcinoma. Furthermore, the deletion of 9p21.3 is a frequent oncogenic event observed in head and neck squamous cell carcinomas, and in lung cancer [10–12].
The regions 8q23.1-q24.23 (myelocytomatosis oncogene (MYC)) and 8q24.3 (protein tyrosine kinase 2 (PTK2)) were gained in 4 samples, which all had multiple copy number aberrations. PTK2 has been shown to be gained in prostate, gastric, colorectal cancers and in salivary adenoid cystic carcinoma [13–16]. MYC is overexpressed in nearly 50% of all human tumors [17, 18], resulting in the aberrant expression of MYC target genes. The t(11;19)(q21;p13) fusion protein can bind and activate MYC, leading to cellular transformation via functional complementation of CREB and MYC transcription networks [19, 20]. In our study however, only one of the 4 samples with a gain of 8q23.1-q24.23 harbored the translocation.
Although some chromosomal aberrations may suggest the involvement of certain genes, the general instability of these malignancies may also be of importance for MEC development. Therefore, clinically, the instability itself should be taken as a marker rather than specific (onco)genes that are gained or lost in specific samples.
In conclusion, in this study we showed that salivary gland MEC may be classified as follows: (i) MEC with no or few chromosomal aberrations, which are in general positive for the t(11;19)(q21;p13) translocation, and (ii) MEC with multiple genomic imbalances, which are in general t(11;190(q21;p13) translocation negative. This implies that there are different oncogenic pathways within MEC, in which either the fusion-gene or the loss of genetic instability plays a role in the underlining pathologic process.
MATERIALS AND METHODS
Samples
Formalin-fixed paraffin-embedded MEC samples and matched healthy salivary gland samples were retrieved from the archives of the Department of Pathology, VU University medical center, Amsterdam, The Netherlands. All tumors were surgically removed between 1984 and 2012. Hematoxylin and eosin stained sections (4 μm) were reviewed by an experienced pathologist (EB) who confirmed the original diagnosis and graded the tumors. Twenty-seven cases of which there was no doubt about the diagnosis were used for this study. All parotid tumors in patients with a previous history of cutaneous squamous cell carcinoma in which there was the slightest doubt about the classification of the parotid tumor were excluded from the study. Clinicopathological details are described in Table 1. The design of the study adhered to the code for proper secondary use of human tissue established by the Dutch Federation of Biomedical Scientific Societies (http://www.federa.org) [21].
DNA isolation
DNA was isolated as previously described [22]. Briefly, 6 sections of 10 μm were deparaffinized, macro-dissected and incubated with 1M sodium thiocyanate at 38°C, for 16 h, followed by a proteinase K treatment at 55°C for another 16 h. DNA was isolated using the QIAmp DNA micro-kit (Qiagen, Hilden, Germany). Purity and quantity of the DNA samples was measured using a Nanodrop 2000 spectrophotometer (Thermo Scientific, Waltham, USA).
ArrayCGH
ArrayCGH was performed as described previously [23]. Although FFPE is not the most ideal material for aCGH analyses, we have over the years built a large amount of experience herewith generating good quality data [23]. Equal amounts (500 ng) of DNA from MEC samples and from matching normal salivary gland tissue of each patient individually were labeled with cyanine 3′-dUTP (Cy3) and cyanine 5′-dUTP (Cy5) nucleotides (Enzo Life Sciences, Farmingdale, NY, USA). Free nucleotides were removed using the MinElute PCR Purification Kit (Qiagen). Oligonucleotide arrayCGH was performed using the SurePrint G3 Human CGH Microarray Kit, containing 180880 in situ synthesized 60-mer oligonucleotides representing 169793 unique chromosomal locations evenly distributed over the genome (space ~17kb) and 4548 additional unique oligonucleotides, located at 238 of the Cancer Census genes (4x180K array, Agilent Technologies, Palo Alto, CA, USA). The exact array design can be found online in the Gene Expression Omnibus (GEO) GPL8687 (http://www.ncbi.nlm.nih.gov/geo). The data are accessible through GEO number GSE87353. Segment values were converted to calls by setting thresholds corresponding to 20% of the tumor cells with that copy number aberration: this percentage converts to a log2 ratio of > 0.1375 for gains and < –0.1520 for losses and all values in between are called normal copy number. Values above the 0.1375 threshold were called gains, values below the –0.1520 threshold were called losses. Although the threshold for detection of aberration calls is low for FFPE material, this was nevertheless chosen upon visual inspection of all profiles as the optimal balance between background and detection of real copy number aberrations. Nevertheless, for analyses, we have focused on recurrent copy number aberrations that occurred in at least three tumors. The log2 ratio threshold for high copy number amplification and homozygous deletion were 1.0 and -1.0, respectively. The data were analyzed using Nexus, in which the significance threshold was set at P < 0.05.
To make sure that the detected copy number alterations were real and not background static, we considered a copy number real when it was present in 3 or more MEC samples.
FISH analysis
For detection of the translocation in MEC samples, fluorescence in situ hybridization (FISH) analysis was carried out on 4 μm tissue sections according to the manufacturer’s protocol, using ZytoLight ® SPEC MAML2 Dual Color Break Apart Probe (ZytoVision Ltd, Bremerhaven, Germany). The MAML2 Dual Color Break Apart Probe can detect rearrangements involving the MAML2 gene irrespective of the fusion partner (including the CRTC3-MAML2 fusion). The nuclei were counterstained with 4′,6-diamidino-2-phenylindole (DAPI), diluted in Vectashield, and samples were evaluated by fluorescence microscopy (ZyGreen: excitation 503 nm, emission 528 nm; ZyOrange: excitation 547 nm, emission 572 nm). Cells without the t(11;19)(q21;p13) translocation show fused green and red signals, typically resulting in a yellow signal. Translocation-positive cells exhibit fused green and red, as well as separated red and green signals, or split signal (Figure 1). A MEC sample was considered positive for the t(11;19)(q21;p13) translocation when the split signal was identified in at least 10 out of 100 cells.
Statistical analysis
Differences between the presence of copy number aberrations in low grade, intermediate grade and high grade MEC, translocation-positive and translocation-negative MEC samples were determined using the Mann-Whitney test. A two-sided P-value of ≤ 0.05 was considered to be statistically significant. Statistical analyses were performed with the use of the Statistical Package for the Social Sciences (SPSS version 20.0).
ACKNOWLEDGEMENTS
None.
CONFLICTS OF INTEREST
None.
FUNDING
None.
REFERENCES
1. Goode RK, El-Naggar AK. Mucoepidermoid carcinoma. In: WHO Classification of Tumours. Pathology and Genetics of Head and Neck Tumours. Ed. Barnes, L, Eveson JW, Reichart P, Sidransky D. IARC Press. 2005.
2. Katabi N, Ghossein R, Ali S, Dogan S, Klimstra D, Ganly I. Prognostic features in mucoepidermoid carcinoma of major salivary glands with emphasis on tumour histologic grading. Histopathology. 2014; 65:793–804.
3. Nordkvist A, Gustafsson H, Juberg-Ode M, Stenman G. Recurrent rearrangements of 11q14-22 in mucoepidermoid carcinoma. Cancer Genet Cytogenet. 1994; 74:77–83.
4. Tonon G, Modi S, Wu L, Kubo A, Coxon AB, Komiya T, O’Neil K, Stover K, El-Naggar A, Griffin JD, Kirsch IR, Kaye FJ. t(11;19)(q21;p13) translocation in mucoepidermoid carcinoma creates a novel fusion product that disrupts a Notch signaling pathway. Nat Genet. 2003; 33:208–13.
5. Behboudi A, Enlund F, Winnes M, Andrén Y, Nordkvist A, Leivo I, Flaberg E, Szekely L, Mäkitie A, Grenman R, Mark J, Stenman G. Molecular classification of mucoepidermoid carcinomas - prognostic significance of the MECT1-MAML2 fusion oncogene. Genes Chromosomes Cancer. 2006; 45:470–81.
6. Okabe M, Miyabe S, Nagatsuka H, Terada A, Hanai N, Yokoi M, Shimozato K, Eimoto T, Nakamura S, Nagai N, Hasegawa Y, Inagaki H. MECT1-MAML2 fusion transcript defines a favorable subset of mucoepidermoid carcinoma. Clin Cancer Res. 2006; 12:3902–7.
7. Anzick SL, Chen WD, Park Y, Meltzer P, Bell D, El-Naggar AK, Kaye FJ. Unfavorable prognosis of CRTC1-MAML2 positive mucoepidermoid tumors with CDKN2A deletions. Genes Chromosomes Cancer. 2010. 49:59–69.
8. Jee KJ, Persson M, Heikinheimo K, Passador-Santos F, Aro K, Knuutila S, Odell EW, Mäkitie A, Sundelin K, Stenman G, Leivo I. Genomic profiles and CRTC1-MAML2 fusion distinguish different subtypes of mucoepidermoid carcinoma. Mod Pathol. 2013; 26:213–22.
9. Zhang L, Mitani Y, Caulin C, Rao PH, Kies MS, Saintigny P, Zhang N, Weber RS, Lippman SM, El-Nagger AK. Detailed genome-wide SNP analysis of major salivary carcinomas localized subtype-specific chromosome site and oncogenes of potential clinical significance. Am J Pathol. 2013; 182:2048–2057.
10. Rocco JW, Sidransky D. p16(MTS-1/CDKN2/INK4a) in cancer progression. Exp Cell Res. 2001; 264:42–55.
11. Baylin SB, Ohm JE. Epigenetic gene silencing in cancer - a mechanism for early oncogenic pathway addiction? Nat Rev Cancer. 2006; 6:107–16.
12. Brock MV, Hooker CM, Ota-Machida E, Han Y, Guo M, Ames S, Glöckner S, Piantadosi S, Gabrielson E, Pridham G, Pelosky K, Belinsky SA, Yang SC, et al. DNA methylation markers and early recurrence in stage I lung cancer. Engl J Med. 2008; 358:1118–28.
13. Saramäki OR, Porkka KP, Vessella RL, Visakorpi T. Genetic aberrations in prostate cancer by microarray analysis. Int J Cancer. 2006; 119:1322–9.
14. Killian A, Di Fiore F, Le Pessot F, Blanchard F, Lamy A, Raux G, Flaman JM, Paillot B, Michel P, Sabourin JC, Tuech JJ, Michot F, Kerckaert JP, et al. A simple method for the routine detection of somaticquantitative genetic alterations in colorectal cancer. Gastroenterology. 2007; 132:645–53.
15. Park JH, Lee BL, Yoon J, Kim J, Kim MA, Yang HK, Kim WH. Focal adhesion kinase (FAK) gene amplification and its clinical implications in gastric cancer. Hum Pathol. 2010; 41:1664–73.
16. Chen D, Zhang B, Kang J, Ma X, Lu Y, Gong L. Expression and clinical significance of FAK, ILK, and PTEN in salivary adenoid cystic carcinoma. Acta Otolaryngol. 2013; 133:203–8.
17. Nilsson JA, Cleveland JL. Myc pathways provoking cell suicide and cancer. Oncogene. 2003; 22:9007–21.
18. Meyer N, Penn LZ. Reflecting on 25 years with MYC. Nat Rev Cancer. 2008; 8:976–90.
19. Amelio AL, Fallahi M, Schaub FX, Zhang M, Lawani MB, Alperstein AS, Southern MR, Young BM, Wu L, Zajac-Kaye M, Kaye FJ, Cleveland JL, Conkright MD. CRTC1/MAML2 gain-of-function interactions with MYC create a gene signature predictive of cancers with CREB-MYC involvement. Proc Natl Acad Sci USA. 2014; 111:E3260–8
20. Wu L, Liu J, Gao P, Nakamura M, Cao Y, Shen H, Griffin JD. Transforming activity of MECT1-MAML2 fusion oncoprotein is mediated by constitutive CREB activation. EMBO J. 2005; 24:2391–402.
21. Oosterhuis JW, Coebergh JW, van Veen EB. Tumour banks: well-guarded treasures in the interest of patients. Nature Reviews Cancer. 2003; 3:73–7.
22. van Essen HF, Ylstra B. High-resolution copy number profiling by array CGH using DNA isolated from formalin-fixed, paraffin-embedded tissues. Methods Mol Biol. 2012; 838:329–41.
23. Krijgsman O, Israeli D, van Essen HF, Eijk PP, Berens ML, Mellink CH, Nieuwint AW, Weiss MM, Steenbergen RD, Meijer GA, Ylstra B. Detection limits of DNA copy number alterations in heterogeneous cell populations. Cell Oncol. 2013; 36:27–36