
INTRODUCTION
Hepatocellular carcinoma (HCC) is one of the most common malignancies worldwide [1–3]. About 745,000 deaths per year can be attributed to HCC [4]. Hepatic resection is currently the most optimal choice for HCC treatment. However, surgical resection is not applicable in most patients, and its long-term prognosis remains unsatisfactory [5]. To date, it is known that both cellular changes and etiological agents (i.e., virus infection and alcohol) are responsible for the cause of HCC [6, 7]. However, like any other complex diseases [8], the molecular pathogenesis of HCC remains poorly understood [9]. The lack of good diagnostic markers and therapeutic targets has rendered HCC a major challenge.
Recently, with dramatically increased throughput, next-generation sequencing provides an efficient tool to illustrate the transcriptome characteristics of cancers, including HCC. Transcriptome sequencing has been used to identify latent biomarkers for HCC [10–12], implicating its great potential in exploring the molecular basis of HCC. Of note, by using transcriptome sequencing, a recurrent chimeric transcript DNAJB1-PRKACA [13] was identified in fibrolamellar HCC (FL-HCC) patients, suggesting that this fusion transcript contributes to the pathogenesis of the FL-HCC and may represent a therapeutic target. Therefore, transcriptome sequencing is a revolutionary tool to investigate the cancer transcriptome and identify possible therapeutic targets [14].
In this study, we performed transcriptome sequencing for HCC and adjacent non-tumorous tissues to investigate the molecular basis of HCC. Nine patients diagnosed as primary HCC were recruited and differentially expressed genes (DEGs) were identified. Candidate fusion transcripts were also identified by using defuse [15]. Further RT-PCR and Sanger sequencing experiments were performed to validate potential recurrent fusion transcripts in other 54 pairs of tumor and adjacent non-tumor samples. Our investigation may shed light on the molecular event responsible for the progression of HCC and offer new possibilities for clinical management of HCC patients.
RESULTS
Overview of transcriptome sequencing statistics
Pair-end second-generation transcriptome sequencing was performed in nine HCC patients. Sample characteristics are list in Table 1. An average of 35,772,695 pair-end 125 bp clean reads was generated (Table 2). The average mapping rate was 93.17%, resulting an average coverage of depth of 32x (Table 2).
Table 1: Sample characteristics
Patient |
Age |
Gender |
Hepatitis |
Serum AFP level(ng/mL) |
Metastasis |
Glisson capsule invasion |
Tumor size (mm) |
Multiple liver nodules |
|---|---|---|---|---|---|---|---|---|
P10 |
59 |
M |
HBV |
670.10 |
No |
– |
35 |
- |
P14 |
50 |
M |
HBV |
12483 |
No |
+ |
50 |
- |
P17 |
37 |
M |
HBV |
4.47 |
No |
+ |
41 |
- |
P21 |
62 |
M |
HBV |
266.5 |
No |
+ |
32 |
- |
P24 |
76 |
M |
HCV |
5.84 |
No |
+ |
70 |
- |
P26 |
59 |
M |
HBV |
3.73 |
No |
– |
6 |
- |
P29 |
69 |
M |
HBV |
6.90 |
No |
+ |
160 |
synchronous |
P36 |
61 |
M |
NBNC |
1.11 |
No |
+ |
80 |
- |
P40 |
19 |
F |
NBNC |
2.85 |
No |
– |
29 |
- |
L24 |
63 |
M |
HBV |
2975 |
No |
+ |
70 |
synchronous |
L26 |
47 |
M |
HBV |
5375 |
Yes |
+ |
130 |
- |
L44 |
72 |
M |
HBV |
303.8 |
No |
+ |
40 |
synchronous |
L134 |
66 |
M |
HBV |
60500 |
No |
+ |
50 |
- |
H19 |
59 |
M |
NBNC |
54.84 |
No |
+ |
26 |
- |
L6 |
48 |
M |
NBNC |
55.1 |
Yes |
+ |
180 |
- |
L21 |
41 |
M |
HBV |
4.70 |
Yes |
+ |
50 |
- |
L25 |
72 |
M |
HBV |
1110 |
No |
+ |
80 |
- |
L30 |
50 |
M |
HBV |
260.9 |
No |
– |
25 |
- |
L36 |
64 |
M |
HBV |
244.6 |
Yes |
+ |
65 |
synchronous |
L39 |
67 |
M |
HBV |
321.1 |
No |
+ |
55 |
synchronous |
L45 |
71 |
M |
HBV |
4606 |
Yes |
+ |
12 |
- |
L46 |
18 |
F |
HBV |
37979 |
No |
+ |
70 |
- |
L49 |
45 |
M |
HBV |
6528 |
No |
+ |
60 |
synchronous |
L52 |
50 |
M |
HBV |
3.03 |
Yes |
+ |
55 |
synchronous |
L53 |
61 |
M |
HBV |
1.90 |
No |
+ |
30 |
- |
L54 |
52 |
M |
HBV |
26.53 |
No |
+ |
20 |
- |
L55 |
55 |
M |
HBV |
1.82 |
No |
+ |
34 |
- |
L57 |
58 |
F |
HBV |
2.55 |
Yes |
+ |
55 |
synchronous |
L61 |
42 |
M |
HBV |
3.38 |
No |
+ |
20 |
synchronous |
L64 |
64 |
M |
HBV |
774.2 |
No |
+ |
10 |
- |
L68 |
54 |
F |
NBNC |
23784 |
No |
+ |
22 |
- |
L72 |
40 |
M |
HBV |
1816 |
No |
+ |
30 |
- |
L73 |
74 |
M |
NBNC |
5.90 |
No |
+ |
30 |
- |
L85 |
76 |
M |
NBNC |
2.10 |
No |
+ |
34 |
- |
L154 |
47 |
M |
HBV |
62.47 |
Yes |
+ |
105 |
- |
L195 |
67 |
M |
NBNC |
3.01 |
Yes |
+ |
80 |
- |
H1 |
37 |
M |
HBV |
1810 |
No |
– |
55 |
- |
H2 |
67 |
M |
HBV |
3103 |
No |
+ |
40 |
- |
H3 |
48 |
M |
HBV |
2.07 |
No |
– |
35 |
- |
H4 |
68 |
M |
HBV |
15.87 |
No |
+ |
35 |
- |
H5 |
71 |
M |
HBV |
11.65 |
No |
+ |
35 |
- |
H6 |
56 |
M |
HBV |
33571 |
No |
+ |
57 |
- |
H7 |
52 |
M |
HBV |
2100 |
Yes |
– |
35 |
- |
H8 |
52 |
M |
NBNC |
5.30 |
No |
+ |
65 |
- |
H9 |
37 |
M |
HBV |
>60500 |
Yes |
– |
95 |
- |
H11 |
46 |
M |
HBV |
4.64 |
No |
– |
45 |
- |
H13 |
52 |
F |
NBNC |
2.45 |
No |
+ |
22 |
- |
H16 |
75 |
M |
NBNC |
4.14 |
Yes |
+ |
87 |
synchronous |
H22 |
47 |
M |
HBV |
5.78 |
No |
+ |
40 |
- |
H25 |
60 |
M |
HBV |
61.54 |
No |
– |
25 |
- |
H27 |
65 |
M |
HBV |
5.34 |
No |
+ |
70 |
- |
H28 |
63 |
M |
HBV |
3396 |
No |
+ |
40 |
- |
H29 |
52 |
M |
HBV |
66.50 |
No |
+ |
22 |
- |
H30 |
58 |
M |
HBV |
6.52 |
Yes |
+ |
58 |
synchronous |
H31 |
42 |
M |
HBV |
3.31 |
No |
+ |
30 |
- |
H32 |
62 |
M |
HBV |
570 |
No |
+ |
28 |
- |
H33 |
46 |
M |
HBV |
3780 |
No |
+ |
21 |
synchronous |
H34 |
64 |
M |
HBV |
36541 |
Yes |
+ |
140 |
- |
H35 |
47 |
F |
HCV |
250.5 |
No |
– |
22 |
- |
H36 |
39 |
M |
HBV |
8.10 |
Yes |
+ |
22 |
synchronous |
H37 |
63 |
M |
HBV |
208 |
No |
+ |
40 |
- |
H38 |
48 |
M |
NBNC |
3.07 |
No |
+ |
33 |
- |
H39 |
66 |
M |
HBV |
82.81 |
No |
+ |
34 |
- |
Note: The nine samples used for sequencing are shown in bold. The six samples with validated fusion CRYL1-IFT88 are shown in italic.
Table 2: Summary statistics of the transcriptome sequencing
Patient |
Sample type |
Total reads |
Mapped reads |
Total base (bp) |
Mapped base (bp) |
Mappping ratio |
Coverage (X) |
|---|---|---|---|---|---|---|---|
P10 |
T |
35,930,408 |
33,819,287 |
4,491,301,000 |
4,227,410,875 |
94.12% |
33 |
N |
34,902,228 |
32,863,973 |
4,362,778,500 |
4,107,996,625 |
94.16% |
32 |
|
P14 |
T |
35,315,378 |
33,125,921 |
4,414,422,250 |
4,140,740,125 |
93.80% |
32 |
N |
34,383,802 |
32,279,443 |
4,297,975,250 |
4,034,930,375 |
93.88% |
31 |
|
P17 |
T |
35,532,658 |
33,258,212 |
4,441,582,250 |
4,157,276,500 |
93.60% |
32 |
N |
34,537,914 |
32,152,860 |
4,317,239,250 |
4,019,107,500 |
93.09% |
31 |
|
P21 |
T |
34,762,386 |
32,701,011 |
4,345,298,250 |
4,087,626,375 |
94.07% |
31 |
N |
35,314,918 |
33,021,170 |
4,414,364,750 |
4,127,646,250 |
93.50% |
32 |
|
P24 |
T |
35,610,444 |
32,509,118 |
4,451,305,500 |
4,063,639,750 |
91.29% |
31 |
N |
34,637,398 |
31,280,461 |
4,329,674,750 |
3,910,057,625 |
90.31% |
30 |
|
P26 |
T |
34,566,526 |
32,670,216 |
4,320,815,750 |
4,083,777,000 |
94.51% |
31 |
N |
35,384,486 |
33,407,169 |
4,423,060,750 |
4,175,896,125 |
94.41% |
32 |
|
P29 |
T |
34,564,642 |
32,385,294 |
4,320,580,250 |
4,048,161,750 |
93.69% |
31 |
N |
34,771,048 |
32,792,475 |
4,346,381,000 |
4,099,059,375 |
94.31% |
32 |
|
P36 |
T |
35,371,920 |
32,571,695 |
4,421,490,000 |
4,071,461,875 |
92.08% |
31 |
N |
35,959,532 |
32,990,753 |
4,494,941,500 |
4,123,844,125 |
91.74% |
32 |
|
P40 |
T |
42,279,434 |
39,097,967 |
5,284,929,250 |
4,887,245,875 |
92.50% |
38 |
N |
40,083,384 |
36,852,292 |
5,010,423,000 |
4,606,536,500 |
91.90% |
35 |
|
Average |
35,772,695 |
33,321,073 |
4,471,586,847 |
4,165,134,146 |
93.17% |
32 |
|
Total |
643,908,506 |
599,779,317 |
80,488,563,250 |
74,972,414,625 |
|||
DEGs analyses results
We next detected DEGs between tumor and non-tumor samples. A total of 1943 DEGs were detected, including 690 up-regulated and 1253 down-regulated genes.
DEGs were subjected to KEGG pathway analyses. As shown in Table 3, with the cut off of FDR < 0.05, DEGs were enriched in ten pathways, including cell cycle (hsa04110), DNA replication (hsa03030), p53 (hsa04115) and complement and coagulation cascades pathway (hsa04610), as well as retinol, xenobiotics by cytochrome P450, drug, arachidonic acid, tyrosine and fatty acid metabolism pathway (hsa00830, 00980, 00982, 00590, 00350, 00071). The GO category enrichment analyses resulted extensive items overrepresented with DEGs. As shown in Table 3, GO items (FDR < 10–3) enriched with DEGs were associated with cell cycle and other processes, such as immune response, DNA replication, complement activation, oxidation, metabolism, and so on.
Table 3: KEGG pathway and gene ontology biological process items enrichment analyses result for the DEGs
Term |
DEG Count |
FDR |
|---|---|---|
KEGG pathway |
||
hsa04110:Cell cycle |
31 |
6.10 × 10⁻⁶ |
hsa00830:Retinol metabolism |
17 |
1.82 × 10⁻⁴ |
hsa00980:Metabolism of xenobiotics by cytochrome P450 |
17 |
7.69 × 10⁻⁴ |
hsa03030:DNA replication |
12 |
2.97 × 10⁻³ |
hsa00982:Drug metabolism |
16 |
4.21 × 10⁻³ |
hsa04610:Complement and coagulation cascades |
15 |
9.85 × 10⁻³ |
hsa00590:Arachidonic acid metabolism |
13 |
1.03 × 10⁻² |
hsa00350:Tyrosine metabolism |
11 |
3.96 × 10⁻² |
hsa00071: Fatty acid metabolism |
10 |
4.17 × 10⁻² |
hsa04115:p53 signaling pathway |
13 |
4.58 × 10⁻² |
GO item |
||
GO:0022403~cell cycle phase |
84 |
5.15 × 10⁻¹⁶ |
GO:0000278~mitotic cell cycle |
77 |
4.11 × 10⁻¹⁵ |
GO:0000279~M phase |
70 |
3.45 × 10⁻¹⁴ |
GO:0007067~mitosis |
54 |
1.87 × 10⁻¹³ |
GO:0000280~nuclear division |
54 |
1.87 × 10⁻¹³ |
GO:0048285~organelle fission |
55 |
2.72 × 10⁻¹³ |
GO:0000087~M phase of mitotic cell cycle |
54 |
4.11 × 10⁻¹³ |
GO:0007049~cell cycle |
118 |
1.26 × 10⁻¹² |
GO:0022402~cell cycle process |
94 |
3.43 × 10⁻¹² |
GO:0009611~response to wounding |
87 |
6.60 × 10⁻¹¹ |
GO:0006954~inflammatory response |
61 |
7.36 × 10⁻¹⁰ |
GO:0051301~cell division |
57 |
1.09 × 10⁻⁹ |
GO:0007059~chromosome segregation |
26 |
8.40 × 10⁻⁹ |
GO:0006952~defense response |
90 |
1.38 × 10⁻⁸ |
GO:0006955~immune response |
97 |
2.41 × 10⁻⁸ |
GO:0051726~regulation of cell cycle |
53 |
4.06 × 10⁻⁶ |
GO:0006260~DNA replication |
36 |
9.33 × 10⁻⁶ |
GO:0002526~acute inflammatory response |
24 |
1.13 × 10⁻⁵ |
GO:0002253~activation of immune response |
23 |
2.07 × 10⁻⁵ |
GO:0050778~positive regulation of immune response |
29 |
4.88 × 10⁻⁵ |
GO:0007051~spindle organization |
15 |
5.21 × 10⁻⁵ |
GO:0031960~response to corticosteroid stimulus |
21 |
5.78 × 10⁻⁵ |
GO:0051384~response to glucocorticoid stimulus |
20 |
5.84 × 10⁻⁵ |
GO:0048545~response to steroid hormone stimulus |
34 |
9.52 × 10⁻⁵ |
GO:0055114~oxidation reduction |
79 |
1.70 × 10⁻⁴ |
GO:0010033~response to organic substance |
86 |
2.60 × 10⁻⁴ |
GO:0002684~positive regulation of immune system process |
38 |
2.84 × 10⁻⁴ |
GO:0002252~immune effector process |
26 |
3.08 × 10⁻⁴ |
GO:0051329~interphase of mitotic cell cycle |
22 |
3.60 × 10⁻⁴ |
GO:0045087~innate immune response |
26 |
5.19 × 10⁻⁴ |
GO:0000079~regulation of cyclin-dependent protein kinase activity |
15 |
5.37 × 10⁻⁴ |
GO:0000226~microtubule cytoskeleton organization |
27 |
5.58 × 10⁻⁴ |
GO:0051325~interphase |
22 |
5.67 × 10⁻⁴ |
GO:0006956~complement activation |
13 |
6.96 × 10⁻⁴ |
GO:0008203~cholesterol metabolic process |
20 |
7.33 × 10⁻⁴ |
GO:0000070~mitotic sister chromatid segregation |
12 |
7.35 × 10⁻⁴ |
GO:0009719~response to endogenous stimulus |
54 |
7.58 × 10⁻⁴ |
GO:0000819~sister chromatid segregation |
12 |
9.75 × 10⁻⁴ |
Fusion genes detection and validation
To detect fusion transcripts that might be the potential cause for tumorigenesis, the software defuse was used and after the filtering process as described in the methods section. Seven candidate fusion genes were detected (Table 4). Using RT-PCR and Sanger sequencing, the fusion gene CRYL1-IFT88 was successfully validated in the discovery sequencing sample (P10 tumor sample) and it was also validated in another 5 tumor samples (Figures 1–2). Therefore, this fusion gene is considered as a recurrent fusion transcript related to HCC with the recurrent rate of about 9.52% (6/63). To investigate how the gene fusion CRYL1-IFT88 affected their expression and proteins, we observed the reads coverage in genomes by IGV (Integrative Genomics Viewer) and domains by NCBI CD-search (Conserved Domains search). We found that quite a lot RNA-Seq reads covered in the intron between exon 15 and exon 16 of IFT88 in tumor sample of P10, but this was not observed in the matched normal sample (Figure 3 top), which indicated that the transcription structure of IFT88 was very likely changed in the tumor cells with this fusion. This break was just occurred in the middle of IFT88 protein sequence ((Figure 3 bottom), which might totally destroy the function of IFT88. However, the change of reads coverage was not observed in the genes CRYL1, it might be the high expression of wild-type CRYL1 masked the change of expression structure.
Table 4: Information of the identified fusion genes
Sample id |
Sample type |
Gene1-Gene2 |
Break point1 |
Break point2 |
Break point1 location |
Break point2 location |
|---|---|---|---|---|---|---|
P10 |
tumor |
CRYL1-IFT88 |
chr13:21063509 |
chr13:21184715 |
coding |
intron |
P14 |
tumor |
BRD9-OR4N2 |
chr5:886707 |
chr14:20230047 |
coding |
5′-UTR |
P14 |
tumor |
MPV17-TRIM54 |
chr2:27545315 |
chr2:27527827 |
coding |
coding |
P24 |
tumor |
BHMT-MTATP6P1 |
chr5:78427385 |
chr1:569753 |
3′-UTR |
exon |
P26 |
tumor |
NOMO3-XYLT1 |
chr16:16372646 |
chr16:17323802 |
coding |
intron |
P26 |
tumor |
NOMO3-XYLT1 |
chr16:16372646 |
chr16:17318037 |
coding |
intron |
P29 |
tumor |
TNFSF14-C3 |
chr19:6664861 |
chr19:6677181 |
3′-UTR |
downstream |
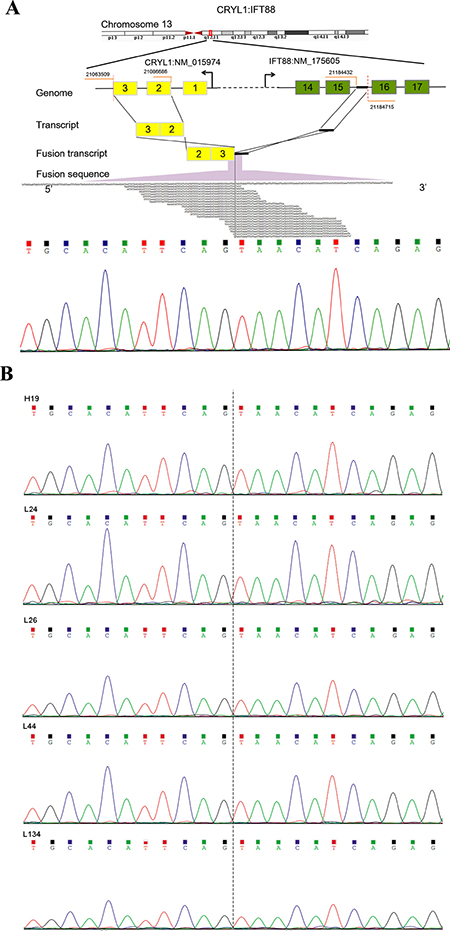
Figure 1: Detection and Sanger sequencing validation of a recurrent fusion transcript CRYL1-IFT88. (A) Illustration of the CRYL1-IFT88 fusion gene (top) and Sanger sequencing validation result for the transcriptome tumor sequencing sample (P10) (bottom). (B) Sanger sequencing validation result for the other five tumor samples. The IDs of samples corresponded to Table 1. The fusion point was marked with dash line.
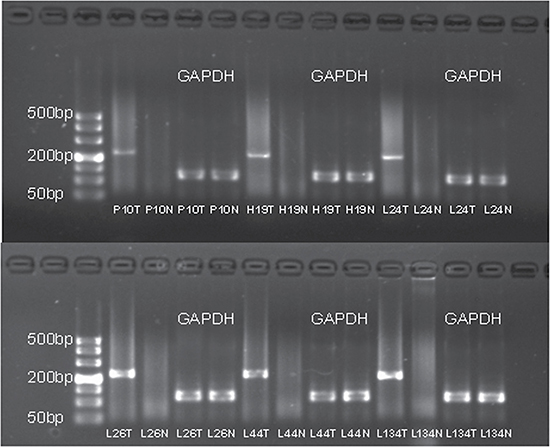
Figure 2: The agarose gel electrophoresis of the six samples with successfully validated fusion transcript CRYL1-IFT88. The RT-PCR product for the fusion gene was 230 bp. The IDs of samples corresponded to Table 1. T and N represented tumor and adjacent non-tumor tissue, respectively.
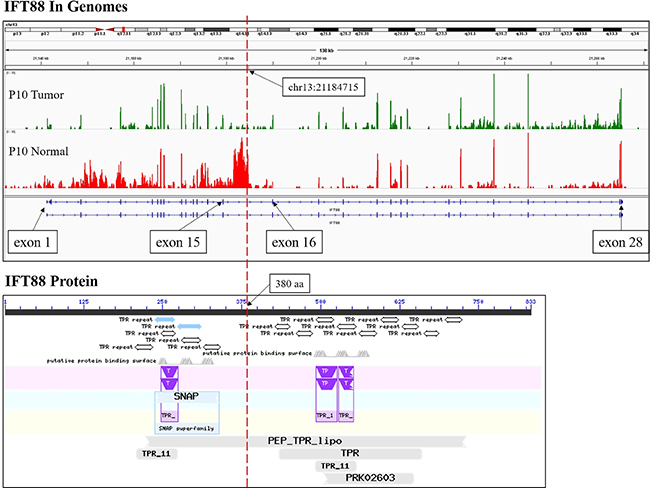
Figure 3: The RNA-Seq reads coverage and functional domains of IFT88. The RNA-Seq reads coverage of gene IFT88 by IGV in the samples of patient P10 was shown at the top, and the functional domains of IFT88 according to NCBI CD-search was shown at the bottom. The red dotted line indicated the breakpoint.
To discover the function of the fusion transcript, we performed both 3′ and 5′ RACE (rapid-amplification of cDNA ends) experiments and obtained the full-length CRYL1-IFT88 fusion sequence (779 bp). The longest ORF was 279 bp (predicted by NCBI ORF-finder) and corresponding to a 92 aa protein sequence (see Supplementary File.docx). And the fusion protein contained most of the domain of CRYL1, including 3-hydroxybutyryl-CoA dehydrogenase domain, NAD binding domain, and so on, which indicated that the functional of the CRYL1-IFT88 were similar with CRYL1 (see Supplementary File.docx).
DISCUSSION
We have applied the transcriptome sequencing approach to illustrate the gene expression characteristics of HCC. Pathway analyses showed that ten pathways, including cell cycle, DNA replication, p53 and complement and coagulation cascades as well as six metabolism processes, were overrepresented with DEGs. Deregulation of the cell cycle [16], DNA replication [17] and p53 pathways [18] are expected since uncontrolled cell division and aberrant tumor suppressor are the major character of cancer cells. As for the complement and coagulation cascades pathway, consistent with our results, both gene expression [19] and proteomics [20] analyses have shown that this pathway is related to the pathogenesis of HCC.
Gene fusion is an important event involved in the development of various types of malignancies, which is the consequence of the genomic rearrangements with a deletion, insertion, translocation or inversion of distal intra- or inter-chromosomal sequences [21]. The oncogenic activation may be triggered by the gene activation or repression due to gene fusion. The Philadelphia chromosome found in chronic myelogenous leukemia (CML) consisting of the BCR-ABL fusion gene is a classical example of gene fusion, an activated tyrosine kinase that drives CML [22]. Recent technology advances especially transcriptome sequencing and bioinformatics strategy for processing cancer profiling data, make the discovery of more fusion genes in cancers, including a recurrent chimeric transcript DNAJB1-PRKACA in FL-HCC [9] and SLC45A3-ELK4 in prostate cancers [23], etc. These known fusion genes provide key insights into tumor biology and have significant clinical impact by serving as potential diagnostic markers or therapeutic targets. In our study, we detected seven chimeric transcripts in total by transcriptome sequencing. Fusion genes were subjected to validation and successfully confirmed that CRYL1-IFT88 is a recurrent fusion transcript related with HCC. To our knowledge, this fusion gene was first reported and validated in HCC. Protein encoded by CRYL1 catalyzes the dehydrogenation of L-gulonate into dehydro-L-gulonate in the uronate cycle, which is an alternative glucose metabolic pathway. Reduced expression of CRYL1 in HCC has been observed in many studies [24–26]. Moreover, it was reported that reduced CRYL1 expression in HCC confers cell growth advantages and correlates with adverse patient prognosis [26]. Protein encoded by IFT88 is a member of the tetratrico peptide repeat (TPR) family, and is involved in liver oval cell proliferation, differentiation, and ploidy control [27]. Tumor suppression activity of this gene was demonstrated and this gene was reported as a liver neoplasia tumor suppressor gene in a previous study [28]. According to our bioinformatics analysis, the protein function of IFT88 might be suppressed due to the gene fusion. Considering the potential involvement of these two genes in HCC, the fusion transcript we identified here might be responsible for the tumorigenesis and serve as potential targets for further therapeutic strategy by the overexpression of IFT88 to overcome the function inhibition due to gene fusion CRYL1-IFT88.
In conclusion, we used transcriptome sequencing approach to illustrate the gene expression characteristics of HCC. Cell cycle, DNA replication, p53 and complement and coagulation cascades pathways as well as some metabolism processes were overrepresented with DEGs. Of note, we detected and successfully validated CRYL1-IFT88 as a recurrent fusion transcript in HCC with the recurrent rate of about 9.52% (6/63).
MATERIALS AND METHODS
Ethics statement
Our study design was approved by the institutional review board of the Fujian provincial hospital. Written informed consent was obtained from all subjects.
Subjects
Sixty-three subjects aged from 18 to 76 were diagnosed as primary HCC in the Fujian provincial hospital during the period from 03/01/2014 to 12/31/2015. Hepatitis B virus (HBV) related tumors were defined according to the presence of HB surface antigen (HBsAg) in serum, and hepatitis C virus (HCV) related tumors were according to the presence of antibody to HCV (HCVAb) in serum. NBNC tumor was defined according to the absence of both HBsAg and HCVAb in serum. Primary tumor and adjacent non-tumorous samples were obtained from all patients who underwent surgical tumor resection. All samples were frozen immediately at –80°C until RNA extraction. Total RNA was isolated by using RecoverAll™ Total Nucleic Acid Isolation Kit (Life Technologies, Carlsbad, CA, USA). Integrity of RNA was assessed by Agilent 2100 bioanalyzer (Agilent, Santa Clara, CA, USA). RNA from nine samples was subjected to sequencing and other samples were used in the validation experiments.
Transcriptome sequencing
Sequencing libraries were prepared by using prepared by using TruSeq RNA Sample Prep Kit (Illumina, San Diego, CA, USA) according to standard protocols. Briefly, total RNA was firstly randomly fragmented and poly-A-selected. Secondly, the RNA fragments were reverse transcribed to cDNA, end-repaired and ligated with adapters. The libraries then underwent size selection, PCR and purification. The quality of libraries was assessed by using Bioanalyzer 2100 (Agilent, Santa Clara, CA, USA). Sequencing was then performed on an Illumina HiSeq 2500 sequencer with 125 bp pair-end reads. All raw data have been deposited in the NIH Short Read Archive database (Access number: SRP 102722).
Reads processing
Raw sequencing reads were firstly filtered for adapters and ribosomal RNA. Reads containing five or more low quality (quality score < 20) bases were also removed. The remained high-quality reads were then aligned to human genome (hg19) by using Tophat [29]. The mapped reads were then subjected to alignment against the the human transcriptome (Ensembl, GRCh37.73). Gene expression level measured by FPKM (fragments per kilobase per million) was calculated by Cufflinks [30]. All processed expression data have been submitted to GEO database (Access number: GSE 97214).
Differentially expressed genes (DEGs) analysis
For each group, DEGs between the tumor and matched non-tumor tissues were selected with pair-wise t test and the significant threshold was set as p-value of less than 0.05 and |log2(fold change, FC)| > = 1. DAVID [31] was used to do the Gene Ontology (GO) and KEGG pathway annotation and enrichment analyses. The significant threshold for enrichment was set as false discovery rate (FDR) < 0.05.
Fusion gene detection
Fusion transcripts were identified by defuse [15]. The default filtering processes of defuse were carried out as previously described [15]. The results of deFuse were further filtered to reduce false positives with the following criteria: 1) predictions supported by less than eight reads were removed; 2) predictions between adjacent genes were filtered unless implied in genomic inversion or eversion; 3) predictions related to ribosomal proteins or small nuclear ribosomal proteins were removed.
Fusion gene validation
Selected fusion transcripts were subjected to validation using RT-PCR and Sanger sequencing. For the RT-PCR reactions, total RNA was converted to cDNA with random hexamer primers using the High-Capacity cDNA Reverse Transcription kit (Applied Biosystems, Foster City, CA, USA). The RT-PCR products were gel purified and sequenced by Sanger sequencing using an ABI 3730 DNA Sequencer (Applied Biosystems, Foster City, CA, USA).
5′ RACE and 3′ RACE
5′ RACE. RLM-RACE was performed with the SMARTerTM RACE cDNA Amplification Kit (Clontech). Total RNA (10 mg) was first treated with calf intestinal alkaline phosphatase (CIP) to remove 5′ phosphate groups, followed by tobacco acid pyrophosphatase to remove 5′ cap structures. After RNA linker ligation, mRNA transcripts were reverse-transcribed with SMARTScribeTM reverse transcriptase. To amplify first-strand cDNAs, we performed NEST PCR. Firstly, outer 5′ PCR using 5′ RACE outer primers (provided in kit) and a IFT88 intron 15 primer (TAGGGAATGACAGGAAACGGGGAT) with SuperTaq Plus polymerase (Applied Biosystems). Subsequently, inner 5′ PCR was performed with a 5′ RACE inner primer (provided in kit) and a CYRL1 exon 3 primer (TTCCA CACTCAGGGAGCCTTTCA). After gel electrophoresis, PCR bands of interest were excised and cloned. The PCR production were sequenced bidirectionally on an ABI 3730 automated sequencer (Applied Biosystems). A minimum of 3 independent colonies were sequenced in each experiment.
3′ RACE
RLM-RACE was performed with the SMARTerTM RACE cDNA Amplification Kit (Clontech). Total RNA (10 mg) was first treated with calf intestinal alkaline phosphatase (CIP) to remove 3′ phosphate groups, followed by tobacco acid pyrophosphatase to remove 3′ cap structures. After RNA linker ligation, mRNA transcripts were reverse-transcribed with SMARTScribeTM reverse transcriptase. To amplify first-strand cDNAs, we performed NEST PCR , firstly, outer 3′ PCR using 3′ RACE outer primers (provided in kit) and a CYRL1 exon 2 primer (GAGGCTTCCAGGTGAAACTCTATGA) with SuperTaq Plus polymerase (Applied Biosystems). Subsequently, inner 3′ PCR was performed with a 3′ RACE inner primer (provided in kit) and a IFT88 intron 15 primer (TTATCC CCGTTTCCTGTCATTCCCT). After gel electrophoresis, PCR bands of interest were excised and cloned. The PCR production were sequenced bidirectionally on an ABI 3730 automated sequencer (Applied Biosystems). A minimum of 3 independent colonies were sequenced in each experiment.
Abbreviations
HCC (hepatocellular carcinoma); DEGs (differentially expressed genes) RACE (Rapid-Amplification of cDNA Ends); RLM-RACE (RNA Ligase-Mediated-Rapid Amplification of cDNA Ends); FL-HCC (fibrolamellar hepatocellular carcinoma); GO enrichment analyses ( Gene Ontology-based statistical enrichment analysis); FDR(false discovery rate); IGV (Integrative Genomics Viewer); CD-search (Conserved Domains search); ORF (open reading frame); NAD (Nicotinamide adenine dinucleotide); TPR (tetratrico peptide repeat); HBV (Hepatitis B virus); HBsAg (HB surface antigen); HCV (Hepatitis C virus); NBNC tumor (non-B non-C tumor); FPKM (fragments per kilobase per million); CIP (calf intestinal alkaline phosphatase); CRYL1 (crystallin, lambda 1); IFT88 (intraflagellar transport 88); BRD9 (bromodomain containing 9); OR4N2 (olfactory receptor, family 4, subfamily N, member 2); MPV17 (MpV17 mitochondrial inner membrane protein); TRIM54 (tripartite motif containing 54); BHMT (betaine-homocysteine S-methyltransferase); MTATP6P1 (mitochondrially encoded ATP synthase 6 pseudogene 1); NOMO3 (NODAL modulator 3); XYLT1 (xylosyltransferase I); TNFSF14 (tumor necrosis factor (ligand) superfamily, member 14); C3 (complement component 3)
Authors’ contributions
Yi Huang guarantor of integrity of the entire study, study concepts, study design, definition of intellectual content, literature research, experimental studies, data acquisition, data analysis, statistical analysis, manuscript preparation, manuscript editing, manuscript review; Jiaying Zheng guarantor of integrity of the entire study, study concepts, study design, definition of intellectual content, literature research, experimental studies, data acquisition, data analysis, statistical analysis, manuscript preparation; Dunyan Chen experimental studies, data acquisition, data analysis, statistical analysis; Feng Li experimental studies, data acquisition, data analysis; Wenbing Wu experimental studies, data acquisition; Xiaoli Huang data analysis, statistical analysis; Yanan Wu data analysis, statistical analysis; Yangyang Deng bioinformatics analysis and data submittion; Funan Qiu guarantor of integrity of the entire study, study concepts, study design, definition of intellectual content, literature research, manuscript editing, manuscript review; all authors read and approved the final manuscript. Yi Huang and Jiaying Zheng contributed equally to this study.
ACKNOWLEDGMENTS
We thank AIC biotechnology for their support in transcriptome sequencing and analysis.
CONFLICTS OF INTEREST
The authors have no financial conflicts of interest.
FUNDING
This study is supported by the Middle-young age backbone talent cultivation program of Fujian health system (No. 2013-ZQN-JC-2); Key projects of science and technology plan of Fujian province (No. 2014Y0009).
REFERENCES
1. Colombo M. Hepatocellular carcinoma. Journal of hepatology. 1992; 15:225–236.
2. Raza A, Sood GK. Hepatocellular carcinoma review: current treatment, and evidence-based medicine. World journal of gastroenterology. 2014; 20:4115–4127. doi: 10.3748/wjg.v20.i15.4115.
3. He B, Qiu X, Li P, Wang L, Lv Q, Shi T. HCCNet: an integrated network database of hepatocellular carcinoma. Cell Res. 2010; 20:732–734.
4. Organization WH. Cancer. 2015.
5. Fan ST, Mau Lo C, Poon RT, Yeung C, Leung Liu C, Yuen WK, Ming Lam C, Ng KK, Ching Chan S. Continuous improvement of survival outcomes of resection of hepatocellular carcinoma: a 20-year experience. Annals of surgery. 2011; 253:745–758. doi: 10.1097/SLA.0b013e 3182111195.
6. He B, Zhang H, Shi T. A comprehensive analysis of the dynamic biological networks in HCV induced hepatocarcinogenesis. PLoS One. 2011; 6:e18516.
7. He B, Li T, Guan L, Liu FE, Chen XM, Zhao J, Lin S, Liu ZZ, Zhang HQ. CTNNA3 is a tumor suppressor in hepatocellular carcinomas and is inhibited by miR-425. Oncotarget. 2016; 7:8078–8089. doi: 10.18632/oncotarget.6978.
8. He B, Lu C, Wang M, Zheng G, Chen G, Jiang M, He X, Bian Z, Zhang G, Lu A. Drug discovery in traditional Chinese medicine: From herbal fufang to combinatory drugs. Science. 2015; 350:S74–S76.
9. Bruix J, Boix L, Sala M, Llovet JM. Focus on hepatocellular carcinoma. Cancer cell. 2004; 5:215–219.
10. Simon EP, Freije CA, Farber BA, Lalazar G, Darcy DG, Honeyman JN, Chiaroni-Clarke R, Dill BD, Molina H, Bhanot UK, La Quaglia MP, Rosenberg BR, Simon SM. Transcriptomic characterization of fibrolamellar hepatocellular carcinoma. Proceedings of the National Academy of Sciences of the United States of America. 2015; 112:E5916–5925. doi: 10.1073/pnas.1424894112.
11. Ho DW, Kai AK, Ng IO. TCGA whole-transcriptome sequencing data reveals significantly dysregulated genes and signaling pathways in hepatocellular carcinoma. Frontiers of medicine. 2015; 9:322–330. doi: 10.1007/s11684-015-0408-9.
12. Lin KT, Shann YJ, Chau GY, Hsu CN, Huang CY. Identification of latent biomarkers in hepatocellular carcinoma by ultra-deep whole-transcriptome sequencing. Oncogene. 2014; 33:4786–4794. doi: 10.1038/onc.2013.424.
13. Honeyman JN, Simon EP, Robine N, Chiaroni-Clarke R, Darcy DG, Lim II, Gleason CE, Murphy JM, Rosenberg BR, Teegan L, Takacs CN, Botero S, Belote R, et al. Detection of a recurrent DNAJB1-PRKACA chimeric transcript in fibrolamellar hepatocellular carcinoma. Science. 2014; 343:1010–1014. doi: 10.1126/science.1249484.
14. Wang Z, Gerstein M, Snyder M. RNA-Seq: a revolutionary tool for transcriptomics. Nature reviews Genetics. 2009; 10:57–63. doi: 10.1038/nrg2484.
15. McPherson A, Hormozdiari F, Zayed A, Giuliany R, Ha G, Sun MG, Griffith M, Heravi Moussavi A, Senz J, Melnyk N, Pacheco M, Marra MA, Hirst M, et al. deFuse: an algorithm for gene fusion discovery in tumor RNA-Seq data. PLoS computational biology. 2011; 7:e1001138. doi: 10.1371/journal.pcbi.1001138.
16. Visconti R, Della Monica R, Grieco D. Cell cycle checkpoint in cancer: a therapeutically targetable double-edged sword. J Exp Clin Cancer Res. 2016; 35:153. doi: 10.1186/s13046-016-0433-9.
17. Wasylishen AR, Lozano G. Attenuating the p53 Pathway in Human Cancers: Many Means to the Same End. Cold Spring Harb Perspect Med. 2016; 6. doi: 10.1101/cshperspect.a026211.
18. Vassilev A, DePamphilis ML. Links between DNA Replication, Stem Cells and Cancer. Genes (Basel). 2017; 8. doi: 10.3390/genes8020045.
19. Zhang L, Guo Y, Li B, Qu J, Zang C, Li F, Wang Y, Pang H, Li S, Liu Q. Identification of biomarkers for hepatocellular carcinoma using network-based bioinformatics methods. European journal of medical research. 2013; 18:35. doi: 10.1186/2047-783X-18-35.
20. Tsai TH, Song E, Zhu R, Di Poto C, Wang M, Luo Y, Varghese RS, Tadesse MG, Ziada DH, Desai CS, Shetty K, Mechref Y, Ressom HW. LC-MS/MS-based serum proteomics for identification of candidate biomarkers for hepatocellular carcinoma. Proteomics. 2015; 15:2369–2381. doi: 10.1002/pmic.201400364.
21. Heim S, Mitelman F. Molecular screening for new fusion genes in cancer. Nature genetics. 2008; 40:685–686. doi: 10.1038/ng0608-685.
22. Nowell PC, Hungerford DA. Chromosome studies in human leukemia. II. Chronic granulocytic leukemia. Journal of the National Cancer Institute. 1961; 27:1013–1035.
23. Rickman DS, Pflueger D, Moss B, VanDoren VE, Chen CX, de la Taille A, Kuefer R, Tewari AK, Setlur SR, Demichelis F, Rubin MA. SLC45A3-ELK4 is a novel and frequent erythroblast transformation-specific fusion transcript in prostate cancer. Cancer research. 2009; 69:2734–2738. doi: 10.1158/0008-5472.can-08-4926.
24. Chen J, Yu L, Li D, Gao Q, Wang J, Huang X, Bi G, Wu H, Zhao S. Human CRYL1, a novel enzyme-crystallin overexpressed in liver and kidney and downregulated in 58% of liver cancer tissues from 60 Chinese patients, and four new homologs from other mammalians. Gene. 2003; 302:103–113.
25. Chen CF, Yeh SH, Chen DS, Chen PJ, Jou YS. Molecular genetic evidence supporting a novel human hepatocellular carcinoma tumor suppressor locus at 13q12.11. Genes, chromosomes & cancer. 2005; 44:320–328. doi: 10.1002/gcc.20247.
26. Cheng IK, Ching AK, Chan TC, Chan AW, Wong CK, Choy KW, Kwan M, Lai PB, Wong N. Reduced CRYL1 expression in hepatocellular carcinoma confers cell growth advantages and correlates with adverse patient prognosis. The Journal of pathology. 2010; 220:348–360. doi: 10.1002/path.2644.
27. Richards WG, Yoder BK, Isfort RJ, Detilleux PG, Foster C, Neilsen N, Woychik RP, Wilkinson JE. Isolation and characterization of liver epithelial cell lines from wild-type and mutant TgN737Rpw mice. The American journal of pathology. 1997; 150:1189–1197.
28. Isfort RJ, Cody DB, Doersen CJ, Richards WG, Yoder BK, Wilkinson JE, Kier LD, Jirtle RL, Isenberg JS, Klounig JE, Woychik RP. The tetratricopeptide repeat containing Tg737 gene is a liver neoplasia tumor suppressor gene. Oncogene. 1997; 15:1797–1803. doi: 10.1038/sj.onc.1201535.
29. Trapnell C, Pachter L, Salzberg SL. TopHat: discovering splice junctions with RNA-Seq. Bioinformatics. 2009; 25:1105–1111. doi: 10.1093/bioinformatics/btp120.
30. Trapnell C, Williams BA, Pertea G, Mortazavi A, Kwan G, van Baren MJ, Salzberg SL, Wold BJ, Pachter L. Transcript assembly and quantification by RNA-Seq reveals unannotated transcripts and isoform switching during cell differentiation. Nature biotechnology. 2010; 28:511–515. doi: 10.1038/nbt.1621.
31. Huang da W, Sherman BT, Lempicki RA. Systematic and integrative analysis of large gene lists using DAVID bioinformatics resources. Nat Protoc. 2009; 4:44–57. doi: 10.1038/nprot.2008.211.