
INTRODUCTION
Esophageal cancer (EC) is the eighth most common cancer worldwide and ranks in the top 5 in China in terms of patient cases and mortalities [1, 2]. The 2012 Chinese cancer registry annual report shows that EC accounts for nearly 10% of all cancer deaths. Large numbers of EC patients were generally diagnosed in an advanced stage and had poor prognosis. Patients with unresectable or metastatic EC are typically treated with chemotherapy using a combination of 5-fluorouracil (5-FU) and cisplatin and have a median survival of less than one year [3]. There are limited salvage options for patients with refractory EC [4] and targeted therapies are not yet available for EC. Therefore, there is great scope and need for novel targeted therapeutic options for EC.
Overexpression of EGFR is commonly found in EC and is associated with poor prognosis [5]. Unlike colon or lung cancers, K-Ras mutations are less frequent in EC [6]. This suggests that inhibition of EGFR pathway maybe therapeutically beneficial to EC patients with EGFR overexpression. However, clinical trials with anti-EGFR antibodies or first generation tyrosine kinase inhibitors (TKIs) in advanced EC patients have been disappointing [7, 8, 9], partly due to lack of prospective patient selection. For example, in the phase III COG trial conducted in mainly esophageal adenocarcinoma patients, the overall survival rates for gefitinib and placebo controls were comparable (3.73 months for gefitinib and 3.67 months for placebo), although there were slight improvements in progression free survival, disease control rate and quality of life [10]. Subsequently, a TRANS-COG trial that was prospectively as part of the COG trial demonstrated that gefitinib significantly enhanced overall survival in patients carrying EGFR gene amplification (HR = 0.19, p = 0.007) and EGFR gene copy number gain (HR = 0.53, p = 0.042) [11]. A recent pre-clinical study showed that esophageal tumor cell lines with high polysomy of EGFR were sensitive to gefitinib [12]. These findings suggested that EGFR directed therapy could be beneficial to esophageal cancer patients with high EGFR protein expression or gene copy number. Although the TRANS-COG trial investigated the relationship between EGFR gene expression and anti-tumor response of gefitinib, EGFR protein expression was not reported. Therefore the correlation between EGFR protein expression and response to EGFR-TKI is not yet clear.
Theliatinib is a novel EGFR tyrosine kinase inhibitor that is currently being evaluated in phase I clinical trial in China (NCT02601248). We conducted a pre-clinical study to evaluate the anti-tumor activity of theliatinib in a panel of patient derived esophageal cancer xenograft (PDECX) models to determine the association between anti-tumor activity of theliatinib and different levels of EGFR expression in EC tumors.
RESULTS
EGFR gene amplification and protein expression in tumor tissues from Chinese esophageal cancer patients
First, we evaluated EGFR expression status by immunohistochemistry (IHC) in 70 tumor specimens from Chinese EC patients, including 65 squamous-cell carcinoma, 2 adenocarcinoma, 2 small-cell carcinoma and 1 sarcoma (Supplementary Table 1). Sixty-four specimens showed positive EGFR expression with 50 demonstrating high EGFR expression (H score ≥ 200; Table 1). Further we conducted quantitative PCR analysis and found in 8 out of 69 specimens showing EGFR gene copy number gain (≥ 2.0; Table 1). Four of the eight specimens showed amplified EGFR gene (EGFR gene copy number/CEP 7 ratio ≥ 2.0) by FISH analysis (Figure 1). Interestingly, all 8 specimens with EGFR gene copy number gain demonstrated an EGFR H score ≥ 290 (Supplementary Table 1). Also, 13 specimens that did not show EGFR copy number gain demonstrated EGFR H scores > 290 (Supplementary Table 1). This indicated that some tumors without EGFR gene copy number gain could have high EGFR protein expression.
Table 1: EGFR expression in treatment-naive Chinese esophageal cancer patients
Histopathology (n = 70) |
EGFR IHC H score (n = 70) |
EGFR copy number gain (n = 69) |
EGFR hot spot mutation (n = 66) |
||||
|---|---|---|---|---|---|---|---|
squamous |
others |
0 |
10~90 |
100~190 |
200~300 |
by qPCR |
by Sanger sequencing |
65 (92.9%) |
5 (7.1) |
6 (8.6%) |
2 (2.9%) |
12 (17.1%) |
50 (71.4%) |
8 (11.6%) |
1 (1.5%) |
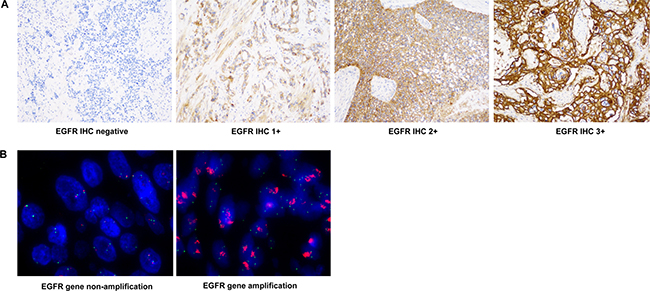
Figure 1: Representative images of EGFR IHC and FISH. (A) EGFR IHC images (400×) for 0, 1+, 2+ and 3+ scores are shown. (B) EGFR FISH staining images (1000×) tumor samples with or without EGFR gene amplification are shown.
Gene mutations of EGFR and downstream targets
Next, we successfully performed DNA extraction and Sanger sequencing in 66 out of 70 samples to determine hot spot mutations in EGFR, PIK3CA, K-Ras and B-Raf genes. The profiling data for the 70 tumor specimens are provided in Supplementary Table 1. A substitution was identified in the kinase domain (exon 21; c.2549 A>T, H850L) of the EGFR (Table 1). However, the L858 mutation or frame shift mutations were not detected in the patient tumor samples (Table 1). Further, as shown in Supplementary Table 1, synonymous single nucleotide polymorphisms (SNPs) were detected in 18 patient samples in exon 20 (c.2361G>A, p.Q787Q) and 1 patient in the exon 19 (c.2235 G>A, p.K745K) of the EGFR. A PIK3CA hot-spot mutation (E542K) was detected in exon 9 in 1 patient sample (Table 1). No B-Raf or K-Ras hot-spot mutation was detected in this study (Table 1).
Establishment of PDECX models
As of July 2014, 54 fresh EC samples were implanted subcutaneously into NOD-SCID mice, of which 23 (42.6%) grew for 3 consecutive passages (P3). Fourteen of the 23 well-growing PDECX models, including 11 with high EGFR expression (H score ≥ 200) were successfully profiled. Finally, top 9 of the 14 PDECX models (Table 2) with a broad range of EGFR expression levels (H score = 15~300) were selected to assess the correlation between EGFR expression levels and theliatinib sensitivity. Then, we compared the histological and molecular characteristics between PDECXs and the corresponding patient tumor samples and found no significant changes during the serial tumor tissue passages, indicating that the PDECX models closely represented the human tumors. Analyses of two representative models, PDECX1T0326 and PDECX1T0781 with their corresponding primary tumors are shown in Figure 2.
Table 2: Profiling of 14 PDECX models established in this study
Model ID |
Histopathology |
EGFR IHC H score |
EGFR GCN by qPCR |
EGFR mutation |
PIK3CA, K-Ras and B-Raf mutation |
|---|---|---|---|---|---|
1T0326 |
ESCC |
290 |
11.7 |
No |
No |
1T0950 |
ESCC |
280 |
27.4 |
No |
No |
1T0472 |
ESCC |
300 |
1.1 |
No |
PIK3CAE542K |
1T1315 |
ESCC |
295 |
2.3 |
No |
No |
1T0327 |
ESCC |
285 |
1.1 |
No |
No |
1T0781 |
ESCC |
270 |
1.6 |
No |
No |
1T0994 |
ESCC |
230 |
1.8 |
Q787Q |
No |
1T0474 |
ESCC |
180 |
1.4 |
No |
No |
1T0773 |
ESCC |
15 |
0.8 |
No |
No |
1T1035 |
ESCC |
290 |
2.3 |
No |
No |
1T1058 |
ESCC |
295 |
2.0 |
Q787Q |
No |
1T1230 |
ESCC |
280 |
2.1 |
No |
No |
1T1061 |
ESCC |
280 |
2.1 |
No |
No |
1T0857 |
ESCC |
190 |
2.0 |
No |
No |
The top 9 models were used to determine anti-tumor activity of theliatinib.
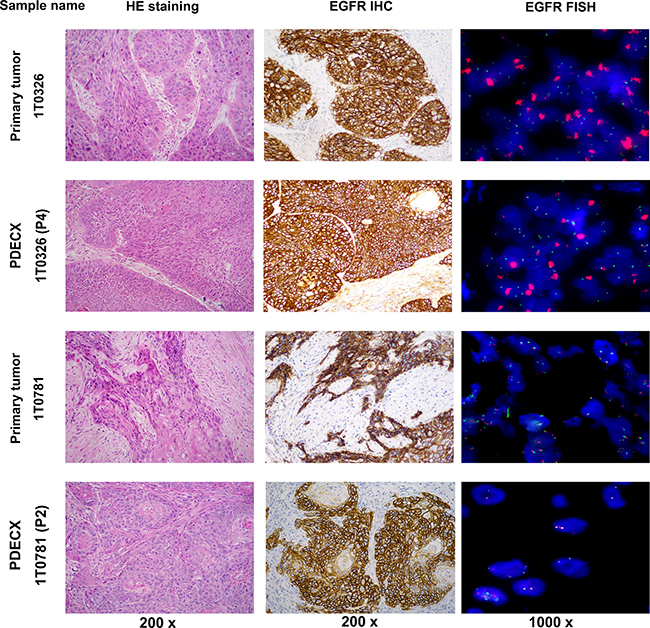
Figure 2: H&E, EGFR IHC and FISH staining of PDECX models and corresponding primary patient tumor specimens. Images of H&E (200×), EGFR IHC (200×) and FISH (1000×) for PDECX 1T0326 (P4) and PDECX 1T0781 (P2) models are shown with the corresponding human primary tumor tissue.
Theliatinib is a highly selective and potent ATP-competitive inhibitor of EGFR
The chemical structure of theliatinib is shown in Figure 3A [13]. Theliatinib is a highly potent EGFR inhibitor with 3~7 fold greater potency than erlotinib or gefitinib at both the enzyme and the cell level (Figure 3B and Table 3). The enzyme kinetics studies demonstrated that theliatinib, gefitinib or erlotinib were all ATP-competitive inhibitors with Ki values 0.05, 0.35 and 0.38 nM, respectively against the wild type EGFR (Figure 3C–3E). The IC50 of theliatinib against EGFR and EGFR T790M/L858R mutant was 3 and 22 nM, respectively (Supplementary Table 2). Also, theliatinib demonstrated 50 fold greater selectivity for EGFR compared to 72 other kinases (Supplementary Table 2) suggesting that it was a highly selective EGFR inhibitor.
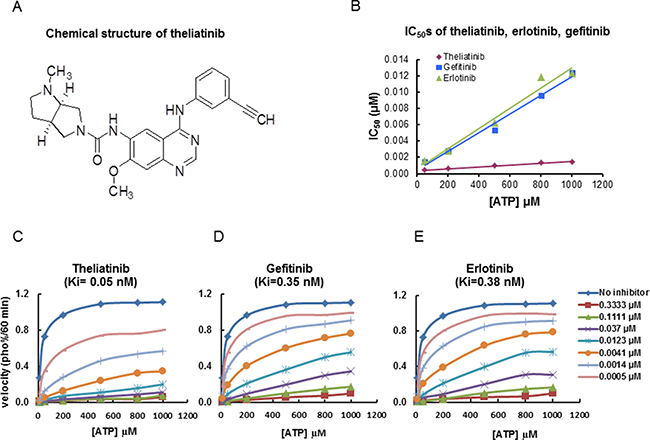
Figure 3: Chemical structure of theliatinib and its enzyme kinetics on EGFR inhibition. (A) Chemical structure of theliatinib. (B) IC50 values of theliatinib, gefitinib and erlotinib were calculated by determining inhibition of wild type EGFR kinase in presence of different ATP concentrations (10~1000 μM) as shown. At all tested ATP concentrations, theliatinib showed lower IC50 compared with gefitinib or erlotinib. (C–E) The effects of different concentrations of theliatinib, gefitinib and erlotinib (0~0.3333 μM) on the reaction velocity of EGFR kinase at different ATP concentrations (10~1000 μM) are shown. The Ki values of theliatinib, erlotinib and gefitinib were calculated using Michaelis-Menten equation in Graphpad Prism software.
Table 3: Theliatinib inhibits EGFR phosphorylation and cell survival in tumor cells with wild-type EGFR
Theliatinib (IC50, μM) |
Erlotinib (IC50, μM) |
|
|---|---|---|
EGF stimulated EGFR phosphorylation |
||
A431 |
0.007 ± 0.002, n = 3 |
0.026 ± 0.005, n = 3 |
Tumor cell survival |
||
A431(epidermoid) |
0.8 |
2.4 |
H292 (lung) |
0.058 |
0.341 |
FaDu (pharynx) |
0.354 |
1.2 |
In vivo anti-tumor activity of theliatinib in multiple PDECX models
Nine PDECX models were selected to evaluate in vivo anti-tumor activity of theliatinib, including 7 with high EGFR expression (H score > 200), 2 (PDECX 1T0326 and PDECX 1T0950) with simultaneous EGFR gene amplification and high EGFR protein expression, 1 with medium EGFR expression (PDECX 1T0474, H score = 180) and 1 with low EGFR expression (PDECX 1T0773, H score = 15). We selected 15 mg/kg/day theliatinib and 20 mg/kg/day gefitinib doses for mice that were similar to those achieved in the clinics.
We observed that the two PDECX models with EGFR gene amplification (PDECX1T0326 and PDECX1T0950) were most sensitive to theliatinib treatment demonstrating tumor regression of 32% and 75%, respectively, at the end of study (Figure 4 and Table 4). The PDECX1T0326 model demonstrated significant inhibition of phosphorylation of EGFR (p-EGFR) and its downstream targets, AKT and ERK (p-AKT and p-ERK) as shown in Figure 4B. In the PDECX1T0950 model, a dose response (2, 5 and 15 mg/kg) was observed (Figure 4C), suggesting that anti-tumor activity was dependent on the level of inhibition of EGFR pathway activation. Gefitinib also displayed anti-tumor activity in these two models with EGFR gene amplification (Figure 4A and Figure 4D). The 20 mg/kg/day dose of gefitinib administered to nude mice was similar to the 500 mg/day dose used in the phase III COG trial. In most PDECX models, the anti-tumor effect of 15 mg/kg theliatinib was significantly better than 20 mg/kg gefitinib (Figure 4A, 4D and Figure 5).
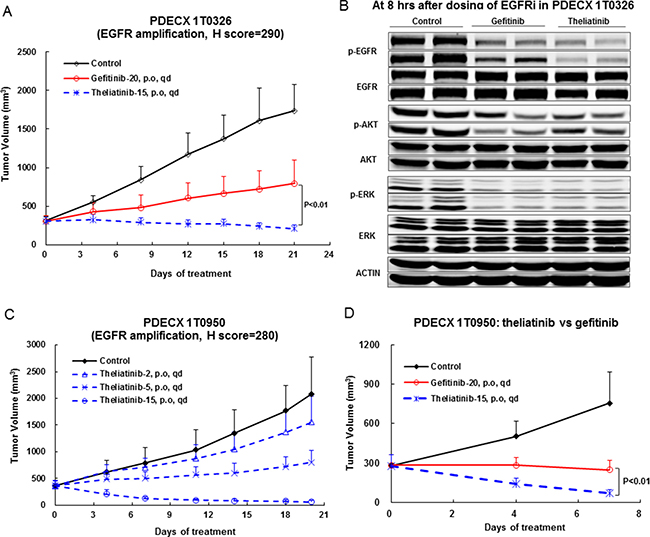
Figure 4: Anti-tumor efficacy of theliatinib in PDECX models with EGFR gene amplification and overexpression. (A) Comparison of anti-tumor effects of theliatinib and gefitinib in PDECX 1T0326 model is shown. (B) Western blot analysis demonstrating the phosphorylation status of EGFR, AKT and ERK in patient tumor xenografts 8 h after oral administration of theliatinib or gefitinib to nude mice is shown. Western blot analysis was performed on subcutaneous tumors (4 mice/group). (C) Theliatinib attenuates tumor growth in PDECX 1T0950 model in a dose-dependent manner (2, 5 and 15 mg/kg/day). (D) Theliatinib demonstrates stronger anti-tumor activity than gefitinib in the PDECX 1T0950 model. The subcutaneous tumor volume was measured and calculated. Y-axis represented the volume of the tumor (Mean ± SD), and X-axis represents days after first dose being administered.
Table 4: Anti-tumor activity of theliatinib in PDECX models
PDECXModel ID |
EGFR H score |
EGFR gene amplification |
Others |
% TGI (% regression) |
||
|---|---|---|---|---|---|---|
Theliatinib 15 mg/kg |
Gefitinib 20 mg/kg |
p value (theliatinib vs gefitinib) |
||||
1T0326 |
290 |
Yes |
- |
106.8** (31.6) |
65.6** |
< 0 .01 |
1T0950 |
280 |
Yes |
- |
144.4** (75.3) |
107.3** (12.1) |
< 0.01 |
1T0781 |
270 |
No |
- |
95.9** |
ND |
ND |
1T1315 |
295 |
No |
- |
91.8** |
34.5* |
< 0.01 |
1T0472 |
300 |
No |
PIK3CAE542K |
83.9** |
60.3** |
< 0.05 |
1T0327 |
285 |
No |
FGFR1 OE |
67.4** |
36.6 |
< 0.05 |
1T0994 |
230 |
No |
EGFR Q787Q |
46.3* |
21.8 |
> 0.05 |
1T0474 |
180 |
No |
- |
63.6 |
29.5 |
> 0.05 |
1T0773 |
15 |
No |
- |
−2.7 |
ND |
ND |
TGI: tumor growth inhibition. OE: over-expression. ND: not determined. **p < 0.01; *p < 0.05 versus control group.
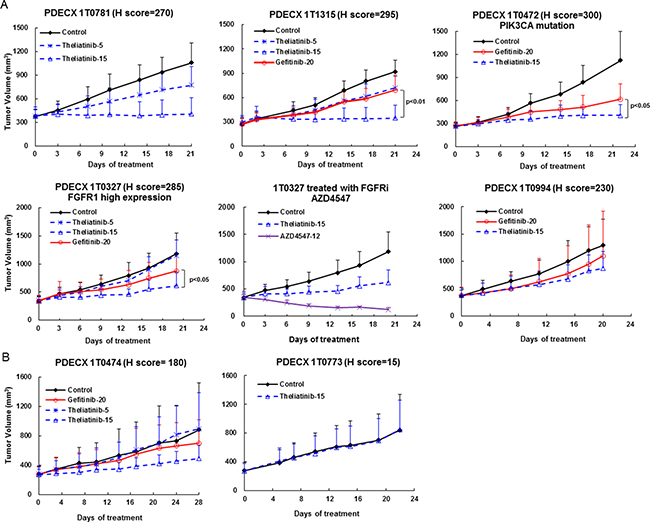
Figure 5: Anti-tumor efficacy of theliatinib in PDECX models without EGFR gene amplification. (A) Anti-tumor effects of theliatinib (5 or 15 mg/kg/day), gefitinib (20 mg/kg/day) are compared against negative control in PDECX models 1T0781, 1T1315, 1T0472, 1T0327 and 1T0994 with EGFR H score > 200. Also shown is 1T0327 with AZD4547 (FGFR inhibitor) compared to theliatinib treatment. (B) Theliatinib shows low or moderate anti-tumor activity in PDECX models 1T0474 and 1T0773 with EGFR H score < 200.
Generally, the anti-tumor efficacy of theliatinib correlated with the level of EGFR expression in PDECX models (Figure 5 and Table 4). Robust efficacy was observed in PDECX1T0781 and PDECX1T1315 that demonstrated high EGFR expression (Figure 5A and Table 4). However, the efficacy of theliatinib was attenuated in PDECX1T0472 and PDECX1T0327 that also had high EGFR expression, probably due to other gene alterations, such as PIK3CA mutation in PDECX1T0472 and FGFR1 overexpression in PDECX1T0327 (Figure 5A and Table 4). In fact, the PDECX1T0327 model demonstrated rapid tumor regression upon treatment with AZD4547 (12 mg/kg), a selective FGFR inhibitor, suggesting that FGFR may be a stronger driver in this tumor than EGFR. These results suggested that when multiple pathways are aberrantly activated in tumors, combination therapy would be necessary. In models with medium or low EGFR expression (PDECX1T0474 and PDECX1T0773), theliatinib demonstrated low to moderate efficacy (Figure 5B and Table 4).
DISCUSSION
In the present study, 93% (65/70) of Chinese esophageal tumor samples were squamous cell carcinoma (ESCC) in contrast to mostly adenocarcinoma in Caucasian population [14]. ESCC tumors are mostly situated in the upper two thirds of the esophagus and associated with smoking and alcohol, salty foods and nitrosamine in foods. In contrast, esophageal adenocarcinoma (EAC) tumors are located almost exclusively in the lower third of the esophagus and esophagogastric junction and are associated with Barrett’s metaplasia and chronic gastro-esophageal reflux [14, 15]. Apart from the histological and epidemiological distinctions, ESCC and EAC differ in molecular features [16]. These differences suggest that the two cancer subtypes have distinct molecular pathogenesis and genetic alterations. However, the COG and TRANS-COG trials demonstrated that the tumor response to EGFR-TKI correlates with EGFR status rather than histological subtypes [10, 11]. The preclinical results presented in our study further demonstrate that tumors with high EGFR expression with or without EGFR gene copy number gains result in sensitivity to theliatinib treatment. Therefore, our data demonstrates that theliatinib would be clinically beneficial to esophageal cancer patients with high EGFR expression.
Since the anti-tumor effect of theliatinib correlated with EGFR expression levels in the PDECX models, patient selection is important for beneficial outcomes. The two PDECX models with EGFR gene amplification were most sensitive to theliatinib treatment with rapid and robust tumor regression. The PDECX models without EGFR amplification but with high EGFR expression (IHC H score = 270~300) also responded strongly to theliatinib with tumor growth inhibition of 83~96%. In contrast, the PDECX models with low EGFR expression (IHC H score < 200) had low to moderate effect upon theliatinib treatment. Therefore, our study indicates that tumors with EGFR gene amplification and high EGFR expression may demonstrate improved object response rate (ORR), whereas tumors with high EGFR expression without EGFR gene amplification may demonstrate improved progression free survival (PFS) with or without ORR. Based on the preclinical findings of theliatinib, we propose that esophageal cancer patients with high EGFR levels (IHC H score ≥ 270) should potentially benefit from theliatinib treatment.
The presence of EGFR activating mutations is an established predictive biomarker in non-small cell lung cancer (NSCLC) with in-frame deletions of exon 19 (E746_A750) and L858R substitution in exon 21 accounting for > 90% of all activating mutations [17]. However, these mutations are distinctly less common in esophageal cancer [18]. In the present study, exon 19 deletions and L858R mutation in exon 21 were not detected in any of the 70 patients. However, a novel EGFR H850L mutation in exon 21 was found in 1 patient and the biological significance of this mutation needs to be determined in future. Further, we found that in 27% (18/66) of cases, an EGFR SNP at codon 787 of exon 20 was present, similar to a previous finding in Japanese ESCC patients in which Q787Q SNP was reported to be associated with decreased overall survival in the patients that received chemoradiotherapy [19]. Interestingly, Q787Q SNP was also identified in head and neck cancer cell lines and patient samples and was associated with higher sensitivity to gefitinib [20]. In our anti-tumor studies, one PDECX model (1T0994, H score 230) that carried Q787Q SNP was insensitive to theliatinib. Therefore, the molecular details between Q787Q SNP and response to EGFR-TKIs need to be investigated further. Overall, EGFR hot-spot mutations were rare in our study.
It is also well recognized that lung cancer cells carrying wild-type EGFR are less sensitive to EGFR TKIs than lung cancer cells with EGFR activating mutations [21, 22]. This was responsible for failure of the first generation TKIs, gefitinib or erlotinib in lung cancer patients with wild type EGFR in earlier clinical trials. In comparison to erlotinib or gefitnib, theliatinib showed much stronger binding affinity to wild type EGFR and was more difficult to be replaced by ATP. This unique feature may result in better target engagement for theliatinib compared to erlotinib or gefitinib, leading to stronger anti-tumor activity in tumors with wild type EGFR activation due to gene amplification or protein overexpression.
Our study also demonstrates that aberrant function of other receptor tyrosine kinase receptors or somatic mutations in down-stream targets such as FGFR overexpression or PIK3CA mutation can influence drug sensitivity of EC to EGFR TKIs. The frequency of PIK3CA mutations in EC varies from 0% to 21% [23]. However, the predictive or prognostic role of the PIK3CA mutation in EC remains unclear. In our study, one EC sample with a PIK3CA E542K mutation on exon 9 and the corresponding PDECX1T0472 showed moderate sensitivity to theliatinib treatment with 84% TGI, which was lower than two other PDECX models with similar EGFR H scores, 1T0781 and 1T1315, without any PIK3CA mutation. This suggested that the PIK3CA hot-spot mutations may attenuate the sensitivity to EGFR inhibitors. Therefore, it would be interesting to investigate anti-tumor activity of theliatinib in combination with a PI3K inhibitor in the future. FGFR1 gene amplification was reported in ESCC with a frequency of 6% to 21% [24] and protein overexpression in 17% of ESCC [25]. However, the therapeutic potential of FGFR1 targeted therapy in ESCC has not been fully evaluated. The PDECX model 1T0327 with overexpression of both EGFR and FGFR1 protein showed only modest tumor growth inhibition to theliatinib treatment suggesting that FGFR1 overexpression could diminish theliatinib efficacy. Interestingly, treatment with a FGFR inhibitor AZD4547 induced rapid tumor regression, suggesting that FGFR1 overexpression was driving the tumor growth in the specific model. This is also the first report of anti-tumor activity of a FGFR TKI in a PDECX model with high FGFR1 expression. We propose to test the efficacy of FGFR TKI either alone or in combination with EGFR TKI to evaluate its therapeutic benefits in ESCC.
There are some limitations of our study. Firstly, the sample size was relatively small and may have inherent bias. Secondly, although Sanger sequencing is a cost-effective method to detect gene mutations, it has several drawbacks such as low sensitivity that may result in not detecting novel mutations. Thirdly, in vivo theliatinib target inhibition study was carried out at 8h after treatment with 15 mg/kg theliatinib (Figure 4B). We propose further investigating the target inhibition effect at 24 h to clearly establish the relationship between target inhibition and anti-tumor activity.
In summary, we observed high EGFR protein levels in majority of Chinese EC patient samples that we analyzed. Comparatively, EGFR gene amplification was less prevalent in these patients. Theliatinib, a novel EGFR TKI with strong affinity to wild type EGFR protein demonstrated dose-dependent anti-tumor activity in a panel of PDECX models with a generally good correlation between EGFR H score and tumor growth inhibition. Furthermore, aberrant activation or gene mutations of other targets such as PI3K and FGFR diminished the anti-tumor activity of the EGFR TKIs, especially, theliatinib. In conclusion, our data suggests that thelaitinib would be beneficial for patients that have high EGFR expression thereby proper patient selection strategy would result in enhanced drug efficacy. Therefore, in phase IB trials, it would be worthwhile to analyze the ORR, DCR and PFS parameters in EC patients with high EGFR protein expression (IHC H score ≥ 270, with or without EGFR gene amplification).
MATERIALS AND METHODS
Theliatinib preparation for in vitro and in vivo studies
Theliatinib (3aR,6aR)-N-(4-(3-ethynylphenyl-amino)-7-methoxyquinazolin-6-yl)-1-methyl-hexahydropyrrolo [3,4-b]pyrrole-5(1H)-carboxamide; molecular weight 442.21; Figure 3A) was synthesized by Hutchison MediPharma Limited (HMP). Theliatinib was prepared as a 10 mmol/L stock solution in DMSO and diluted in appropriate assay media for in vitro assays. Theliatinib was suspended in aqueous 0.5% Sodium Carboxymethyl Cellulose (CMC-Na) and stored at 4ºC for in vivo studies. Gefitinib, Erlotinib and AZD4547 were provided by Department of Chemistry, HMP.
Chinese esophageal cancer patients in this study
Seventy esophageal tumor specimens from newly diagnosed patients were collected during surgical resection from the Shanghai Biobank Network of Common Human Tumor Tissue at the Changhai hospital, Shanghai, China. Two additional surgical EC samples used for PDECX models establishment were provided by Renji Hospital, Shanghai. Prior written informed consent was obtained from all patients.
PDECX models and anti-tumor efficacy studies
Seven- to nine week old NOD-SCID (NOD.CB17-Prkde<scid>/JSlac) immunodeficient or BALB/cASlac-nu/nu male or female mice were obtained from Shanghai SLAC Laboratory Animal Co. Ltd or Shanghai LingChang BioTech Co. Ltd. Fresh tumor specimens from newly diagnosed patients were collected during surgery and separated into three parts for the following: (1) To prepare formalin fixed paraffin embedded (FFPE) sections; (2) For snap freezing in liquid nitrogen for DNA extraction and sequencing and (3) For subcutaneous implantation into NOD-SCID mice (P0) and subsequent passages in additional NOD-SCID or nude mice once the tumor size reached 800~1500 mm3. After several consecutive in vivo passages, the PDECX models (P3~P7) were used to evaluate the anti-tumor efficacy of theliatinib or gefitinib or AZD4547. All experiments in animals were performed in accordance with protocols approved by the Hutchison MediPharma Limited Animal Care and Use Committee (HMPLACUC).
When the average tumor volume reached the 250~500 mm3, mice were randomly divided into different experimental groups. Tumor-bearing mice were daily administered oral doses of test compounds (Theliatinib in 0.5% CMC-Na; Gefitinib in 0.5% Tween-80 and AZD4547 in 1% Tween-80 (tested only in the PDECX 1T0327 model)) or vehicle control. Body weight and tumor size of all mice was measured twice or thrice a week. Tumor volumes (TV) were calculated by measuring two perpendicular diameters with calipers (formula: TV = (length × width2)/2). Tumor growth inhibition (TGI) was calculated using the formula TGI= [1-(Vt -V0)drug treated / (Vt -V0)vehicle control]×100%. Statistical significance was determined by Student’s t test and p < 0.05 was considered statistically significant.
Hematoxylin and Eosin (H&E) and EGFR- IHC staining and scoring
Tissues from EC patients were harvested and fixed in 10% buffered formalin for 24 h within 30 minutes after resection. Then, 4 μm tissue sections were cut and paraffinized before storage. H&E staining were performed following the routine procedures [26] and finally, diagnosed by pathologists at the Changhai hospital. IHC staining on patient tumor sections was performed with EGFR PharmDx (DAKO, K1494) on DAKO auto-stainer Link48 according to the manufacturer’s instructions. Briefly, 4 μm tissue sections were prepared and dried for 1h at room temperature and then placed in a 56~60°C incubator for 1h. After deparaffinization and rehydration [26], sections were incubated with proteinase K solution for 5 minutes. Endogenous peroxidase activity was blocked with 3% hydrogen peroxide for 5 minutes and washed with the buffer followed by incubation with mouse monoclonal anti-human EGFR antibody (clone2–18C9c) for 30 minutes. Then, the sections were incubated with secondary goat anti-mouse antibody conjugated with horseradish peroxidase for 30 minutes followed by diaminobenzidine (DAB) substrate chromogen solution for 10 minutes. Monoclonal mouse IgG1 antibody was used as negative control. In each IHC staining run, a control slide provided by EGFR pharmDx™ kit with IHC 0 and 2+ was also included. The tumor sections from PDECX samples were manually treated with EGFR antibody (Cell Signaling Technology, Cat#4267) followed by biotinylated secondary antibody and the DAB chromogen.
The percentage of tumor cells with positive staining were reviewed and scored using a four-tier system on a scale of 0, 1+, 2+ or 3+, and H score was calculated as follows : H score=100 × [1 × (% of 1+ cells) + 2 × (% of 2+ cells) + 3 × (% of 3+ cells)] [27]. The H score ≥ 10 was regarded as positive and ≥ 200 were considered high.
EGFR gene copy number (GCN) by qPCR
Genomic DNA was extracted from frozen tumor samples or FFPE tumor sections using QIAamp Mini kit (Qiagen, Valencia, CA) according to the manufacturer’s instructions. qPCR was carried out in a 20 μL reaction mixture containing genomic DNA, primers, and SYBR Premix Ex Taq II (TaKaRa, Cat#RR820A) (Supplementary Table 3). The primers for EGFR were 5′-GAATTCGGATGCAGAGCTTC-3′ for forward and 5′-GACATGCTGCGGTGTTTTC-3′ for reverse. The primers for internal control MTHFR (Methylene Tetrahydrofolate Reductase) were 5′-CCATCTTCCTGCTGCTGTAACTG-3′ for forward and 5′-GCCTTCTCTGCCAACTGTCC-3′ for reverse. The EGFR gene copy number was normalized to NCI-H441 cells. Samples with EGFR GCN ≥ 2.0 were further validated by EGFR FISH.
EGFR gene amplification by FISH
The tumor specimens with EGFR GCN ≥ 2.0 identified by qPCR assay were further validated by FISH. In brief, 4 μm sections from FFPE samples were deparaffinized and rehydrated. Specimens were heated in the pre-treatment solution followed by proteolytic digestion using Pepsin (Dako FISH Accessary Kit, K5799). Tissue sections applied with EGFR/CEP7 FISH probe (Vysis, Order NO. 01N35-020) were denatured at 73°C for 5 minutes and hybridized at 37°C overnight followed by a stringent wash with saline-sodium citrate containing Tween-20 (Dako FISH Accessory Kit, K5799). Finally, the specimens were mounted with fluorescence mounting medium (Invitrogen, P36935) containing 4′,6 diamidino-2-phenylindole (DAPI). The sections were visualized in a fluorescence microscope (Olympus BX53). The enumeration of EGFR gene and chromosome 7 was conducted in 50 tumor nuclei in each section by two independent observers. In case of discordance between the two observers, a third observer was involved. EGFR gene with ≥ 15 copies in ≥ 10% of cells or a gene/chromosome ratio per cell of ≥ 2.0 in homogenously stained regions was determined as EGFR gene amplification [28].
Hot spot mutation detection of EGFR, PIK3CA, K-Ras and B-Raf genes
Hotspots mutations in exon 19, 20 and 21 of EGFR gene, exon 9 and 20 of PIK3CA gene, exon 2 and 3 of K-Ras gene and exon 11 and 15 of B-Raf gene were detected in tumor samples by the Genewiz Inc., using ABI3730XL sequence analyzer. The primers for detecting hot spot mutations in EGFR, PIK3CA, K-Ras and B-Raf are listed in Supplementary Table 4.
EGFR kinase inhibition assay
EGFR kinase inhibition was determined using the Z´-LYTE™ kinase assay kit-Tyr 4 peptide (Invitrogen, PV3193). Briefly, EGFR kinase (Invitrogen, PV3872) was dissolved in a reaction buffer composed of 50 mM HEPES pH 7.5, 0.01% BRIJ-35, 10 mM MgCl2 and 1 mM EGTA. The final 10 μL of the kinase reaction mixture consisted of 5 ng kinase, 2 μM substrate peptide Try4, ATP and the test compounds theliatinib, gefitinib and erlotinib. ATP (10, 50, 200, 500, 800 and 1000 μM) was finally added to the reaction mixture to initiate the enzymatic reaction. The final concentration of DMSO in the assay was 2%. The reaction mixture was incubated at 25°C for 60 minutes in a 384 well plate. Then, 5 μL of Development Reagent B was added per well and incubated for further 60 minutes at 25°C. The fluorescent signal was read at emission wavelengths, 445 nm and 520 nm after excitation at 400 nm in a Victor3 multi label reader (PerkinElmer). The kinetic parameters (Ki, Vmax and Km) were calculated with the Graphpad Prism software according to the Michaelis-Menten equation: V = Vmax × [S]/ (Km×(1+[I]/Ki)+ [S]). IC50 of thliatinib, gefitinib and erlotinib was calculated at different ATP concentrations using XLfit software (IDBS, Guildford, UK) [29].
EGFR phosphorylation inhibition in tumor cells by DELFIA assay
EGF stimulated EGFR phosphorylation was determined in A431 human epidermoid carcinoma cells using the modified DELFIA assay. Briefly, A431 cells (1.3 × 10⁴ cells/well) were seeded overnight in a 96 well plate in 100 μL DMEM with 10% FBS. Then, the culture medium was removed and the cells were starved in FBS-free DMEM medium at 5% CO2 and 37°C for 24 h. Further, the cells were treated with 10 μL of the test compounds (theliatinib, gefitinib and erlotinib) at different concentrations (300~0.137 nM, 3 fold gradient dilution) for 60 minutes at 37°C and 5% CO2. The control cells were treated with 10 μL of FBS-free DMEM medium containing 5% DMSO (final concentration of DMSO was 0.5%). Cells were stimulated by 20 ng/mL recombinant human EGF (BIOSOURCE, PHG0064) for 45 minutes. Then, the cell supernatant was discarded and the cells were lysed with 100 μL DELFIA lysis buffer. The plates with cell lysates were kept at -80°C overnight. Then, the lysates were thawed on ice with gently mixing, and 20 μL of lysates were added into the assay plates (PerkinElmer, AAAND-0001), pre-coated with monoclonal anti-EGFR capture antibody (R&D, AF231), followed by incubation for 1h at room temperature. The phosphorylated EGFR (p-EGFR) in the lysates was detected with the detection mixture containing DELFIA Eu-N1 labeled anti-phospho-tyrosine antibody PT66 (PerkinElmer, Eu-PT66) and DELFIA enhancement solution for 1h at room temperature. Fluorescence signals were detected at 620 nm emission and 340 nm excitation by Victor3 multi label reader (PerkinElmer). All tested concentrations of theliatinib, gefitinib and erlotinib were repeated in duplicated wells.
Cell survival assay
A431 cells (1 × 10⁴ cells/well) in exponential phase were seeded in duplicates in DMEM containing 10% FBS and incubated at 37°C and 5% CO2 overnight. Then, 10 μL of test compounds (theliatinib, gefitinib and erlotinib) at tested concentrations (10~0.005 μM, 3 fold gradient dilution) were added into each well with the final concentration of DMSO at 0.5%. The cells were incubated for 48 h followed by further incubation for 1h after adding 10 μL/well CCK-8 solution (Dojindo, CK-04-13). Cell survival was determined by measuring the optical density at 450 nm using Labsystems Multiskan K3 (Thermo Fisher Scientific Inc.).
Western blot in PDECX tumor tissues for EGFR signaling inhibition
BALB/cASlac-nu/nu nude mice bearing PDECX1T0326 tumors were orally administered with theliatinib (15 mg/kg) or gefitinib (20 mg/kg). After 8 h, the animals were sacrificed and tumors were harvested. The tumors were homogenized in cold lysis buffer (Cell Signaling Technology, 9803) containing 1 mM PMSF (BIO BASIC INC., PB0425) and after centrifuging the lysates, the protein supernatant (containing 100 μg protein) were mixed with 5× SDS loading buffer and boiled at 100°C for 10 minutes and SDS-PAGE was performed (5% stacking gel at 80V for 20 minutes, then changed to 120V on 10% separating gel for 1h). Proteins were then transferred to nitrocellulose membranes (0.35A for 90 minutes), and incubated with the following antibodies individually: Phospho-EGFR (Tyr1068) (Invitrogen, 44788G), EGFR (Cell Signaling Technology, 2232), phospho-AKT (Cell Signaling Technology, 4060), AKT (Cell Signaling Technology, 9272), phospho-ERK (Thr202/Thr204) (Cell Signaling Technology, 4370), ERK (Cell Signaling Technology, 4695). After washing with the 1X TBST, the blots were incubated with the secondary IRDye 800-conjugated secondary antibody (LI-COR, 926-32211) and detected with chemiluminescence system.
Abbreviations
EC, esophageal cancer; ESCC, esophageal squamous cell carcinoma; EAC, esophageal adenocarcinoma; PDECX, patient derived esophagus cancer xenograft; IHC, immunohistochemistry; H&E, Hematoxylin and Eosin; FISH, fluorescence in situ hybridization; PCR, polymerase chain reaction; TKIs, tyrosine kinase inhibitors; FFPE, formalin fixed paraffin-embedded; HMPLACUC, Hutchison MediPharma Limited Animal Care and Use Committee; TV, tumor volume; TGI, tumor growth inhibition.
Authors’ contributions
Conception and design: Yongxin Ren, Weiguo Qing and Weiguo Su; Development of methodology: Linfang Wang, Min Cheng, Wei Zhang and Jun Ni; Acquisition of data: JianMing Zheng, Shiming Fan, Dongxia Shi, Wei Zhang, Renxiang Tang, Ying Yu, Longxian Jiao, Jun Ni, Fang Yin, Yunxin Chen Haibin Yang, Huaqing Cai and Weihan Zhang; Analysis and interpretation of data: Linfang Wang, Min Cheng, Yunxin Chen, Feng Zhou and Yongxin Ren; Writing, review, and/or revision of the manuscript: Shiming Fan, Yongxin Ren, Feng Zhou, Weiguo Qing and Weiguo Su.
ACKNOWLEDGMENTS AND FUNDING
This work was funded by Hutchison MediPharma Limited. We would like to thank Xubo Li and Hao Wang, Department of Chemistry, Hutchison MediPharma Limited, for the supply of the reference compounds gefitinib, erlotinib and AZD4547. We also thank Xuelei Ge for technical support of animal experiments and Hongbo Chen for tumor sections preparing and staining.
CONFLICTS OF INTEREST
All authors disclose no conflicts of interest.
REFERENCES
1. Torre LA, Bray F, Siegel RL, Ferlay J, Lortet-Tieulent J, Jemal A. Global cancer statistics, 2012. CA Cancer J Clin. 2015; 65:87–108.
2. Chen WQ, Zheng RS, Baade PD, Zhang S, Zeng HM, Bray F, Jemal A, Yu XQ, He J. A Cancer Statistics in China, 2015. CA Cancer J Clin. 2016; 66:115–132.
3. Zhang JC, Jiang DX, Li XJ, Lv J, Xie L, Zheng L, Gavine PR, Hu Q, Shi Y, Tan LJ, Ge D, Xu ST, Li L, et al. Establishment and characterization of esophageal squamous cell carcinoma patient-derived xenograft mouse models for preclinical drug discovery. Lab Invest. 2014; 94: 917–926.
4. Shim HJ, Cho SH, Hwang JE, Bae WK, Song SY, Cho SB, Lee WS, Joo YE, Na KJ, Chung IJ, Phase II. Phase II study of docetaxel and cisplatin chemotherapy in 5-fluorouracil/cisplatin pretreated esophageal cancer. Am J Clin Oncol. 2010; 33:624–28.
5. Wang QF, Zhu HX, Xiao ZF, Zhang WC, Liu X, Zhang X, He J, Sun KL, Wang LH, Xu NZ. Expression of epidermal growth factor receptor is an independent prognostic factor for esophageal squamous cell carcinoma. World J Surg Oncol. 2013; 11: 278–285.
6. Shigaki H, Baba Y, Watanabe M, Miyake K, Murata A, Iwagami S, Ishimoto T, Iwatsuki M, Yoshida N, Baba H. KRAS and BRAF Mutations in 203 Esophageal Squamous Cell Carcinomas: Pyrosequencing Technology and Literature Review. Ann Surg Oncol. 2013; 20:S485–S491.
7. Janmaat ML, Gallegos-Ruiz MI, Rodriguez JA, Meijer GA, Vervenne WL, Richel DJ, Van Groeningen C, Giaccone G. Predictive Factors for Outcome in a Phase II Study of Gefitinib in Second-Line Treatment of Advanced Esophageal Cancer Patients. J Clin Oncol. 2006; 24:1612–1619.
8. Ilson DH, Kelsen D, Shah M, Schwartz G, Levine DA, Boyd J, Capanu M, Miron B, Klimstra D. A Phase II Trial of Erlotinib in Patients with Previously Treated Squamous Cell and Adenocarcinoma of the Esophageal. Cancer. 2011; 117:1409–1414.
9. Hofheinz RD, Kripp M, Lorenzen S. Combination of cetuximab with radio-chemotherapy in patients with esophageal cancer: less is more. J Thorac Dis. 2015; 7: E629–E632.
10. Dutton SJ, Ferry DR, Blazeby JM, Abbas H, Dahle-Smith A, Mansoor W, Thompson J, Harrison M, Chatterjee A, Falk S, Garcia-Alonso A, Fyfe DW, Hubner RA, et al. Gefitinib for oesophageal cancer progressing after chemotherapy (COG): a phase 3, multicentre, double-blind, placebo-controlled randomised trial. Lancet Oncol. 2014; 15:894–904.
11. Petty RD, Dehale-Smith A, Miedzybrodzka Z, Dutton SJ, Murray GI, Stevenson D, Massie D, Osbourne A, Clark C, Mansoor W, Thompson J, Harrison M, Chatterjee A, et al. Epidermal growth factor receptor copy number gain (EGFR CNG) and response to gefitinib in esophageal cancer (EC): Results of a biomarker analysis of a phase III trial of gefitinib versus placebo (TRANS-COG). J Clin Oncol. 2014; 32:4016.
12. Drenckhan A, Grob T, Dupree A, Dohrmann T, Mann O, Izbicki JR, Gros SJ. Esophageal carcinoma cell line with high EGFR polysomy is responsive to gefitinib. Langenbecks Arch Surg. 2014; 399:879–888.
13. Zhang W, Su WG, Yang H, Cui Y, Ren Y, Yan X. Quinazoline compounds. US Patent US9168253B2. 2015.
14. Pennathur A, Gibson MK, Jobe BA, Luketich JD. Oesophageal carcinoma. Lancet. 2013; 381:400–412.
15. Navarini D, Gurski RR, Madalosso CA, Aita L, Meurer L, Fornari F. Epidermal Growth Factor Receptor Expression in Esophageal Adenocarcinoma: Relationship with Tumor Stage and Survival after Esophagectomy. Gastroenterol Res Pract. 2012; 2012:941954.
16. The cancer Genome Atlas Research network. Integrated genomic characterization of oesophageal carcinoma. Nature. 2017;541:169–175.
17. Sharma SV, Bell DW, Settleman J, Haber DA. Epidermal growth factor receptor mutations in lung cancer. Nat Rev Cancer. 2007; 7:169–181.
18. Sudo T, Mimori K, Nagahara H, Utsunomiya T, Fujita H, Tanaka Y, Shirouzu K, Inoue H, Mori M. Identification of EGFR mutations in esophageal cancer. Eur J Surg Oncol. 2007; 33:44–48.
19. Kaneko K, Kumekawa Y, Makino R, Nozawa H, Hirayama Y, Kogo M, Konishi K, Katagiri A, Kubota Y, Muramoto T, Kushima M, Ohmori T, Oyama T, et al. EGFR gene alterations as a prognostic biomarker in advanced esophageal squamous cell carcinoma. Front Biosci. 2010; 15:65–72.
20. Tan EH, Goh C, Lim WT, Soo KC, Khoo ML, Tan T, Tan DS, Ang MK, Ng QS, Tan PH, Lim A, Hwang J, Teng YH, et al. Gefitinib, cisplatin, and concurrent radiotherapy for locally advanced head and neck cancer: EGFR FISH, protein expression, and mutational status are not predictive biomarkers. Ann Oncol. 2012; 23:1010–1016.
21. Sordella R, Bell DW, Haber DA, Settleman J. Gefitinib-Sensitizing EGFR Mutations in Lung Cancer Activate Anti-Apoptotic Pathways. Science. 2004; 305:1163–1167.
22. Lynch TJ, Bell DW, Sordella R, Gurubhagavatula S, Okimoto RA, Brannigan BW, Harris PL, Haserlat SM, Supko JG, Haluska FG, Louis DN, Christiani DC, Settleman J, et al. Activating mutations in the epidermal growth factor receptor underlying responsiveness of non-small-cell lung cancer to gefitinib. N Engl J Med. 2004; 350:2129–39.
23. Ming Z, Jiang D, Hu Q, Li X, Huang J, Xu Y, Liu Y, Xu C, Hua X, Hou Y. Diagnostic application of PIK3CA mutation analysis in Chinese esophageal cancer patients.Diagn Pathol. 2014, 9:153.
24. Von Loga K, Kohlhaussen J, Burkhardt L, Simon R, Steurer S, Burdak-Rothkamm S, Jacobsen F, Sauter G, Krech T. FGFR1 Amplification Is Often Homogeneous and Strongly Linked to the Squamous Cell Carcinoma Subtype in Esophageal Carcinoma. PLoS One. 2015; 10:e0141867.
25. Lin DC, Hao JJ, Nagata Y, Xu L, Shang L, Meng X, Sato Y, Okuno Y, Varela AM, Ding LW, Garg M, Liu LZ, Yang H, et al. Genomic and molecular characterization of esophageal squamous cell carcinoma. Nat Genet. 2014; 46:467–473.
26. Fischer AH, Jacobson KA, Rose J, Zeller R. Hematoxylin and eosin staining of tissue and cell sections. Cold Spring Harb Protoc; 2008.
27. Mazières J, Brugger W, Cappuzzo F, Middel P, Frosch A, Bara I, Klingelschmitt G, Klughammer B. Evaluation of EGFR protein expression by immunohistochemistry using H-score and the magnification rule: Re-analysis of the SATURN study. Lung Cancer. 2013, 82:231–237.
28. Sholl LM, John Iafrate A, Chou YP, Wu MT, Goan YG, Su L, Huang YT, Christiani DC, Chirieac LR. Validation of chromogenic in situ hybridization for detection of EGFR copy number amplification in non-small cell lung carcinoma. Mod Pathol. 2007; 20:1028–1035.
29. Krippendorff BF, Neuhaus R, Lienau P, Reichel A, Huisinga W. Mechanism-based inhibition: deriving K(I) and k(inact) directly from time-dependent IC(50) values. J Biomol Screen. 2009;14:913–923.