
INTRODUCTION
To maintain cell homeostasis, gene expression patterns are strongly regulated post-transcriptionally, through mechanisms like pre-RNA splicing and maturation, and mRNA transport, stability, storage, editing and translation [1–4]. Besides RNA-binding proteins (RBPs), the major post-transcriptional regulatory factors are noncoding RNAs (ncRNAs), a large class that includes microRNAs and long noncoding RNAs (lncRNAs). Through their impact on protein expression programs, ncRNAs have been implicated in cellular processes that broadly influence physiological adaptation and diseases like cancer, cardiovascular function, and neurodegeneration [5–10].
The development of high-throughput RNA sequencing has revealed that thousands of ncRNAs are transcribed from >90% of the human genome and are expressed selectively in some cell types, as well as in response to specific developmental and environmental conditions [7–16]. LncRNAs are defined as noncoding transcripts longer than 200 nucleotides that generally do not encode proteins, although some of them are indeed translated [12, 15, 17]. They can reside in the nucleus and the cytosol and vary widely in their length, genomic locus of origin, interacting partners, and mechanisms of action. Some lncRNAs critically alter gene transcription by influencing chromosome organization, epigenetic changes, and transcription factor recruitment. Other lncRNAs affect gene expression post-transcriptionally by altering mRNA splicing, translation, and stability, as well as the availability of RBPs and other mRNA-binding factors [5].
Numerous lncRNAs have been implicated in carcinogenesis. As reviewed recently by Evans and colleagues [18], a vast number of lncRNAs have been associated with a wide range of human malignancies, including breast, ovarian, prostate, lung, thyroid, and kidney cancers. Through their impact on protein expression programs at the transcriptional, post-transcriptional, and post-translational levels, lncRNAs were found to affect cancer cell homeostasis. Indeed, several thousand lncRNAs have been reported to control one or several major cancer traits, such as cell proliferation, the hypoxia response, the TP53 pathway, cell senescence, telomere maintenance, signaling through hormone receptors, and the apoptotic response [18–21].
We recently investigated the human lncRNA OIP5-AS1, which is transcribed in the antisense (AS) direction from the same gene that encodes Opa-interacting protein 5 (OIP5), a pro-tumorigenic protein overexpressed in many cancers. OIP5-AS1 was initially identified as cyrano in zebrafish [22], where it was found to play a key role in early development of the central nervous system. In HeLa cells, OIP5-AS1 was found to suppress cell proliferation at least in part by associating with the RBP HuR and reducing its availability to target mRNAs including those that encode cyclins A and D1 (CCNA2 and CCND1) and SIRT1. Accordingly, these proteins were more highly expressed when OIP5-AS1 levels declined and were suppressed when OIP5-AS1 was overexpressed [23].
To investigate more comprehensively OIP5-AS1 actions, particularly its anti-proliferative activity, we focused on the observation that silencing OIP5-AS1 led to the appearance of aberrant (monopolar, multipolar, misaligned) spindles. We performed affinity pulldown analysis to identify OIP5-AS1-associated mRNAs and OIP5-AS1 silencing to uncover cell cycle proteins differentially regulated by OIP5-AS1. These analyses revealed that OIP5-AS1 associated with GAK mRNA, which encodes GAK, a 144-kDa Ser/Thr kinase associated with cyclin G and required for metaphase transition [24, 25]. In turn, OIP5-AS1 lowered GAK mRNA stability and reduced GAK protein abundance. Our results suggested that OIP5-AS1 contributed to the proper chromosome segregation during mitosis by maintaining low GAK levels. This hypothesis was supported by the discovery that the aberrant mitoses seen after OIP5-AS1 were partly rescued by concomitant GAK silencing, indicating that GAK was an effector of the influence of OIP5-AS1 on cell proliferation.
RESULTS
LncRNA OIP5-AS1/cyrano is required for proper mitotic cell division
We previously reported that human lncRNA OIP5-AS1 suppressed cell proliferation [23]. We investigated this phenotype further by silencing OIP5-AS1 in human cervical carcinoma HeLa cells using small interfering (si)RNA directed at OIP5-AS1 or control (Ctrl) siRNA (Figure 1A). By 72 h after siRNA transfection, HeLa cells exhibited aberrant chromosome condensation during mitosis, as determined by staining DNA using Hoechst 33342 and visualization using fluorescence microscopy (Figure 1B; white arrowheads, normal mitoses; yellow arrows, abnormal mitoses). Abnormal mitotic cells were counted in multiple fields and calculated relative to total nuclei; in total, 322 and 485 nuclei were assessed in Ctrl siRNA and OIP5-AS1 siRNA groups, respectively (Figure 1C). The abnormal mitotic spindle morphologies were further analyzed by staining with Hoechst 33342 as well as with antibodies that recognized α-tubulin (TUBA1) to visualize microtubules, and γ-tubulin (TUBG1) to visualize the centrosomes. As shown, mitotic cells in the control group showed normal alignment of chromosomes at the metaphase plate (Figure 1D, Ctrl siRNA). By contrast, in OIP5-AS1-silenced mitotic cells, chromosomes were disorganized and less condensed, with misaligned mitotic spindles and abnormally polarized microtubules (Figure 1D, OIP5-AS1 siRNA). Silencing OIP5-AS1 caused three distinguishable abnormalities in the arrangement of mitotic chromosomes; among them, multipolar spindles were most common, but misaligned/unelongated spindles and monopolar spindles were also observed (Figure 1D, OIP5-AS1 siRNA). These observations support the notion that OIP5-AS1 plays a critical role in the alignment of chromosomes and microtubules during metaphase and suggest that OIP5-AS1 is required for proper mitotic spindle formation.
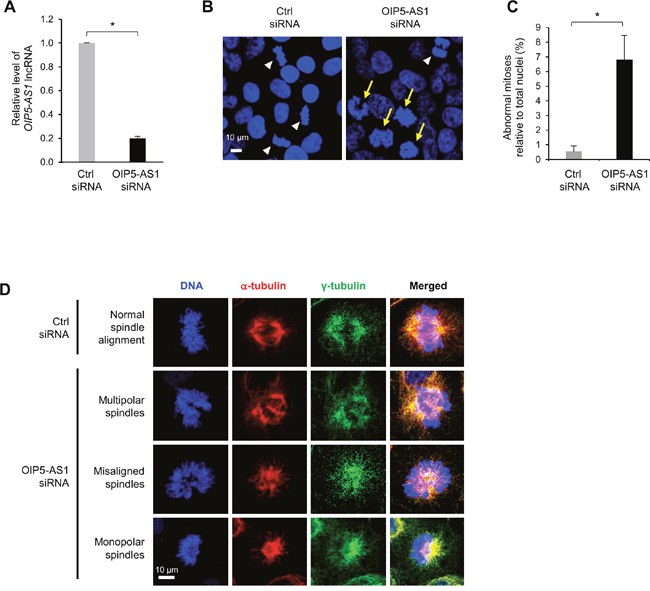
Figure 1: Silencing OIP5-AS1 induces abnormal mitotic cell division. (A) HeLa cells were transfected with a control (Ctrl) siRNA or siRNA directed to OIP5-AS1; 72 h later, total RNA was isolated and the levels of OIP5-AS1 were measured by RT-qPCR analysis. Data were normalized to levels of 18S rRNA, also measured by RT-qPCR analysis. Data represent the means of three independent experiments +S.E.M.; *, p<0.05. (B) In HeLa cells that were processed as described in (A), DNA was visualized with Hoechst 33342. Yellow arrows, abnormal mitotic chromosomes; white arrowheads, normal mitotic chromosomes. (C) Abnormal mitoses relative to total nuclei (%) were quantified from 4 different experiments; data represent the means of four independent experiments + S.E.M. (D) In HeLa cells that were processed as described in (A), DNA was visualized using Hoechst 33342, spindle microtubules using anti-α-tubulin, and centrosomes using anti-γ-tubulin. Examples of multipolar, misaligned, and monopolar spindles in the OIP5-AS1 siRNA populations are shown. In (B, D), data are representative of three independent experiments; images were collected using Zeiss LSM 710 microscope.
Identification of cell cycle proteins affected by OIP5-AS1, encoded by OIP5-AS1-interacting mRNAs
To identify systematically the possible mediator(s) of the mitotic phenotype observed after silencing OIP5-AS1, we devised a three-pronged strategy. First, we sought to identify OIP5-AS1-regulated proteins by silencing OIP5-AS1 and performing LC/MS proteomic analyses to find proteins abundant in each cell population (Figure 2A, purple). This analysis revealed about 1000 proteins differentially expressed (twofold higher or twofold lower) in cells in which OIP5-AS1 was silenced (Supplementary Table 1). Second, we identified mRNAs associated with OIP5-AS1 by transfecting cells with two expression vectors, one that transcribed the chimeric RNA MS2-OIP5- AS1 and one that expressed a MS2-GST fusion protein. GSH beads were then used to pull down the MS2 complex from cell lysates, thereby capturing MS2-OIP5-AS and molecules bound to it; the associated mRNAs were then identified by microarray analysis as described (GSE93551) (Figure 2A, green). Finally, from the intersection of proteins showing differential abundance after OIP5-AS1 silencing (purple), and whose cognate mRNAs associated with OIP5-AS1 (green), we searched for known proteins implicated in regulating cell division (Figure 2A, orange) and discovered 12 mRNAs which met all three criteria (box).
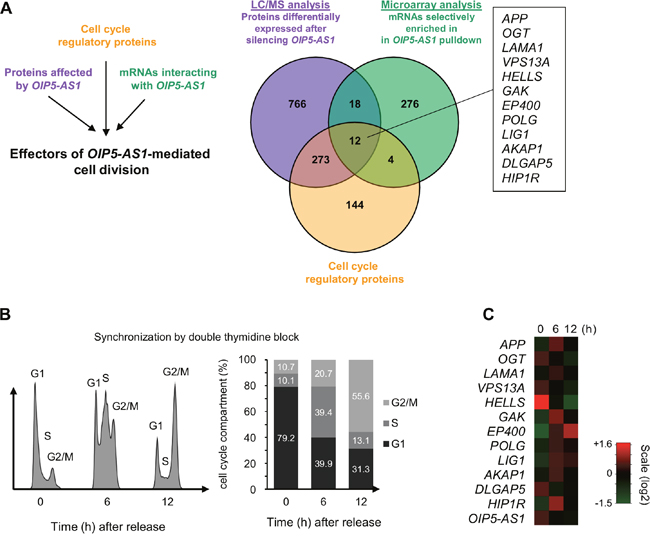
Figure 2: Cell cycle proteins regulated by OIP5-AS1, encoded by OIP5-AS1-interacting mRNAs. (A) Schematic of the three-pronged approach used to identify systematically the mediators of cell division by OIP5-AS1. Purple, in cells that were processed as described in Figure 1A, LC/MS analysis was carried out to identify proteins differentially expressed (higher or lower) in OIP5-AS1-silenced cells (Supplementary Table 1). Green, in HeLa cells transfected with two vectors, one that expressed MS2-OIP5-AS1 chimeric RNA and one that expressed the fusion protein MS2-GST, pulldown analysis was carried out and mRNAs interacting with MS2-OIP5-AS1 were identified by microarray analysis (GSE93551). Orange, from among a list of cell cycle regulatory proteins, we identified 12 mRNAs (box) encoding proteins implicated in controlling cell proliferation, enriched in MS2-OIP5-AS1 pulldown and showing changed expression upon OIP5-AS1 silencing. (B) U2OS cells were synchronized by double thymidine block; 6 and 12 h following release, cells were collected for FACS and microarray analyses. The cell cycle distribution profiles (left) and the percentage of cells in the G1, S, and G2/M compartments (right) following release are indicated. (C) Microarray analysis in cells processed as described in (B) to identify differentially expressed transcripts. Heat-map analysis focused on the 12 mRNAs identified in panel (A) plus OIP5-AS1. Scale intensity is indicated.
We sought to gain further insight into the function of OIP5-AS1-interacting mRNAs given the phenotype observed in OIP5-AS1-silenced cells. To this end, we synchronized human osteosarcoma U2OS cells using double thymidine block to stop cell cycle progression at the end of the G1 phase. This cell line was chosen because it can be synchronized robustly and provides a more reliable model of cell cycle progression than HeLa cells. FACS analysis indicated that 6 h after release from synchronization most cells were transitioning through the S phase, and 12 h later they were highly abundant in the G2/M compartments (Figure 2B). At these time points, RNA was collected and studied using microarrays. Interestingly, some mRNAs showed expression patterns similar to that seen for OIP5-AS1 (e.g., OGT, HELLS, and DLGAP5 mRNAs), while other mRNAs showed expression patterns opposite to that of OIP5-AS1 (e.g., APP, GAK, EP400, and HIP1R mRNAs) (Figure 2C). To test if the interaction of mRNAs and OIP5-AS1 is conserved between U2OS and HeLa cells, we repeated the MS2 pulldown assay after transfecting HeLa and U2OS cells with the plasmids described above [23]. As shown in Supplementary Figure 1, some mRNAs (e.g., GAK, HELLS, POLG and SIRT1 mRNAs) showed enrichment in OIP5-AS1 pulldown in both cell types, while other mRNAs did not (e.g., VPS13A, APP and EP400, not shown). These findings suggested that OIP5-AS1 might influence the expression levels of some bound target mRNAs and decrease the abundance of other bound mRNAs, and this influence appears at least partially conserved in two human cancer cells lines.
OIP5-AS1 interacts with GAK mRNA, lowering GAK mRNA stability and GAK expression levels
We identified GAK mRNA as the most prominent OIP5-AS1-interacting mRNAs that encoded a protein (GAK) that was both suppressed by OIP5-AS1 and implicated in mitotic progression. Accordingly, we set out to look in detail at this interaction and investigate its functional consequences. We designed 3’-end biotinylated antisense DNA oligomers complementary to OIP5-AS1 as well as biotinylated control sense oligomers, incubated them with whole-cell lysates, and pulled them down, along with interacting RNAs using streptavidin magnetic beads. As measured by reverse transcription (RT) followed by real-time quantitative (q)PCR analysis, GAK mRNA was enriched 1.6-fold (Figure 3A, left) in the samples that selectively pulled down OIP5-AS1 compared with the sense control oligomers (Figure 3A, right). Similarly, we designed 3’-end biotinylated antisense oligomers complementary to GAK mRNA as well as biotinylated control sense oligomers, incubated them with whole-cell lysates, and used streptavidin magnetic beads to pull them down along with any interacting RNAs. RT-qPCR analysis of the RNA in the pulldown material revealed that OIP5-AS1 was enriched twofold in the samples that selectively pulled down GAK mRNA, relative to what was pulled down using sense control oligomers (Figure 3B). Several regions of complementarity between OIP5-AS1 and GAK mRNA were identified (Figure 3C). Neither the individual sites of complementarity nor combinations of sites tested appeared fully responsible for recapitulating the specific RNA interactions (not shown), suggesting that perhaps larger complexes, possibly involving other RBPs, might be necessary for efficient interaction between the two RNAs.
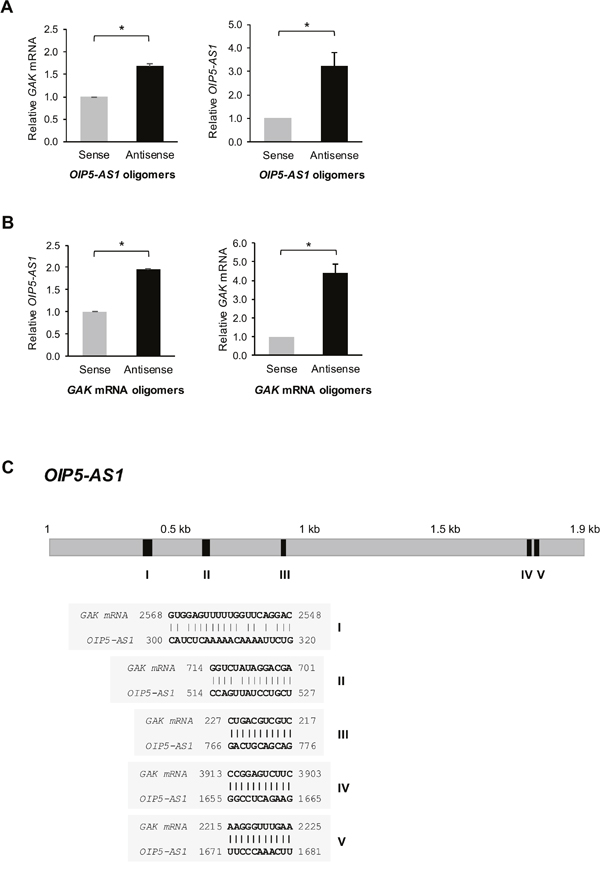
Figure 3: OIP5-AS1 interacts with GAK mRNA. (A) HeLa cell lysates were incubated with 3’ end-biotin-labeled oligomers complementary to OIP5-AS1 (antisense) or reverse complementary control oligomers (sense). Following pulldown using streptavidin beads and RNA isolation, the levels of GAK mRNA (left) and OIP5-AS1 (right) were assessed by RT-qPCR analysis and normalized to the levels of GAPDH mRNA. (B) HeLa cell lysates studied as in (A) using 3’ end-biotin-labeled oligomers complementary to GAK mRNA (antisense) or reverse complementary control oligomers (sense). The levels of OIP5-AS1 (left) and GAK mRNA (right) were assessed by RT-qPCR analysis and normalized to the levels of GAPDH mRNA. In (A, B), data represent the means + S.E.M. from three independent experiments; *, p<0.05. (C) Regions of complementarity (shaded segments I-V) between OIP5-AS1 and GAK mRNA.
To investigate the consequences of the interactions between GAK mRNA and OIP5-AS1, we silenced OIP5-AS1 in HeLa cells and harvested the cells 72 h later to determine the levels of GAK mRNA and GAK protein using RT-qPCR and Western blot analyses, respectively. As shown in Figure 4A, silencing OIP5-AS1 increased the levels of GAK mRNA and GAK protein significantly. The increase in GAK mRNA was due at least in part to stabilization of GAK mRNA, as determined by measuring GAK mRNA stability following treatment with actinomycin D to stop de novo RNA transcription in cells and measuring the time required for GAK mRNA to reach 50% of its initial abundance before adding actinomycin D. As shown in Figure 4B, GAK mRNA had a substantially longer half-life (>> 8 h) in cells with silenced OIP5-AS1 than in control cells (in which the half-life was ~4.8 h). The half-life of GAPDH mRNA, a stable control transcript encoding a housekeeping protein, was not affected by silencing OIP5-AS1 (Figure 4B). Conversely, overexpression of OIP5-AS1 by transfection of the expression vector pcDNA-OIP5-AS1 lowered GAK mRNA levels and GAK abundance, as determined by using RT-qPCR and Western blot analyses, respectively (Figure 4C). Together, these findings indicate that OIP5-AS1 binds GAK mRNA and negatively regulates GAK mRNA stability, in turn lowering the steady-state levels of GAK mRNA and GAK protein.
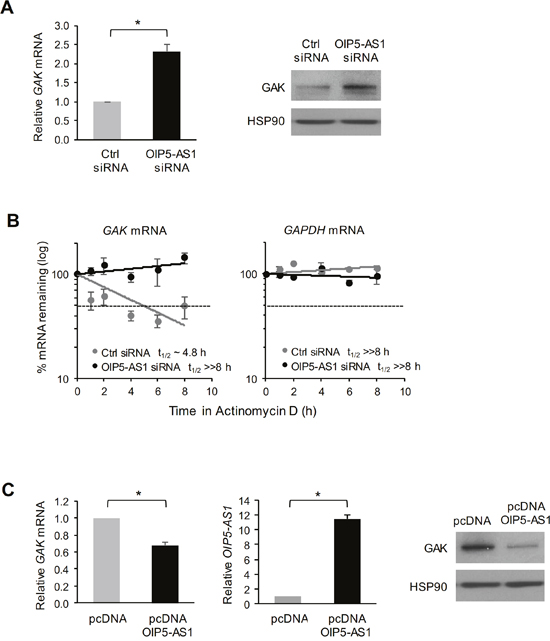
Figure 4: Impact of OIP5-AS1 on GAK mRNA stability and GAK protein expression levels. (A) Seventy-two hours after transfecting HeLa cells with either Ctrl siRNA or OIP5-AS1 siRNA, the levels of GAK mRNA were measured by RT-qPCR analysis (left) and the levels of GAK protein and loading control HSP90 were assessed by Western blot analysis (right). (B) In cells processed as described in (A), the half-life of GAK mRNA was measured by adding actinomycin D and calculating the time needed for GAK mRNA to reach one half (t1/2) of its abundance at time 0; the half-life of a stable transcript, GAPDH mRNA, which encodes a housekeeping protein, was measured in control experiments. RNA levels at each time point were normalized to 18S rRNA levels. (C) Forty-eight hours after transfection of pcDNA-OIP5-AS1 to overexpress OIP5-AS1, the levels of GAK mRNA (left graph) and OIP5-AS1 (right graph) were measured by RT-qPCR analysis (left) and the levels or GAK protein and loading control HSP90 were assessed by Western blot analysis (right). In (A-C), data represent the means and S.E.M. from three independent experiments. In (A, C), *, p<0.05.
Abnormal mitotic cells in silenced OIP5-AS1 were restored by GAK silencing
Given that silencing OIP5-AS1 triggered a rise in GAK levels and dysfunctional mitoses, we investigated if the mitotic impairment elicited by the reduction in OIP5-AS1 was mediated at least in part by the higher GAK abundance. GAK had been implicated in the assembly of the mitotic spindle [25], and therefore we hypothesized that the higher GAK levels resulting from lowering OIP5-AS1 might contribute to causing abnormal mitoses. To test this hypothesis, we performed a rescue experiment in which the impact of OIP5-AS1 silencing on the defective mitotic phenotype was compared between cells expressing high GAK levels and cells in which GAK expression was ectopically silenced. As shown in Figure 5A and quantified in Figure 5B, the aberrant mitoses (particularly multipolar spindles) seen after silencing OIP5-AS1 were largely rescued after simultaneously silencing GAK mRNA (OIP5-AS1 siRNA + GAK siRNA group), although simply silencing GAK mRNA also increased the appearance of some abnormal mitoses, as reported [25]. Silencing OIP5-AS1 elevated GAK mRNA and GAK protein levels (Figure 5B and 5C), although GAK siRNA potently silenced GAK expression regardless of OIP5-AS1 abundance. Taken together, our results indicate that OIP5-AS1 helps to elicit proper mitotic progression at least in part by binding GAK mRNA and ensuring low production of GAK protein (Figure 6).
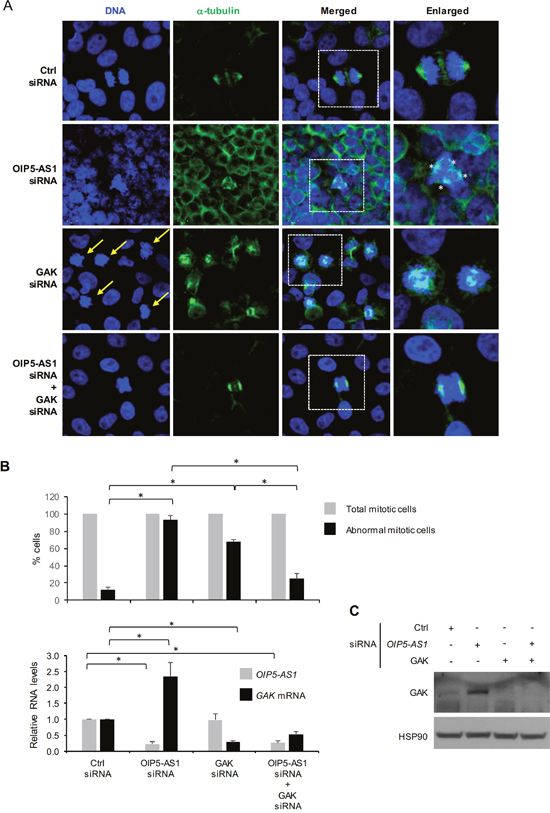
Figure 5: Impact of silencing GAK on abnormal mitoses in OIP5-AS1 silenced cells. (A) Seventy-two hours after transfecting HeLa cells with Ctrl siRNA, OIP5-AS1 siRNA, GAK siRNA, or with both OIP5-AS1 + GAK siRNAs, DNA was visualized using Hoechst 33342 and spindle microtubules using anti-α-tubulin. Yellow arrows, abnormal mitotic chromosomes. (B, C) In cells that were processed as described in (A), 18-42 mitotic nuclei (in 3-6 fields chosen randomly in 3 independent experiments) were counted and the number of normal and abnormal mitoses calculated (B, top), RNA was extracted and the levels of OIP5-AS1 and GAK mRNA was quantified by RT-qPCR analysis (B, bottom), or protein was extracted (C) and the levels of GAK and loading control HSP90 were assessed by Western blot analysis. In (B), data represent the means and S.E.M. from three independent experiments; *, p<0.05. The data in (A, C) are representative of three independent experiments.
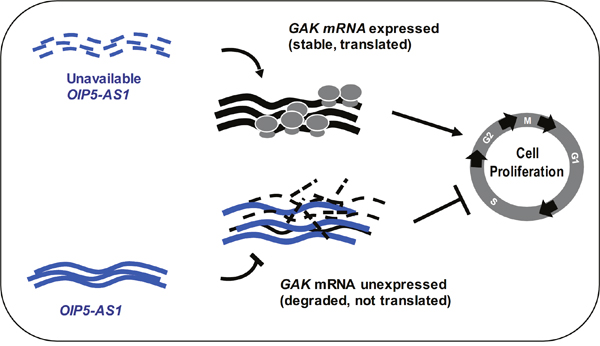
Figure 6: Schematic. Model proposed to explain our findings. Low OIP5-AS1 levels causes a rise in GAK expression levels and accelerates cell division, while elevated OIP5-AS1 suppresses GAK abundance and inhibits cell division. The increase in GAK abundance when OIP5-AS1 levels decline is due, at least in part, to the stabilization of the GAK mRNA when OIP5-AS1 is silenced.
DISCUSSION
In this study, we sought to identify systematically the mediators whereby OIP5-AS1 represses cell division. We previously found that OIP5-AS1 sequestered the RBP HuR, which reduced the availability of HuR to target mRNAs encoding cyclins A and D1 (CCNA2 and CCND1) and consequently lowered their expression levels, resulting in reduced proliferation [23]. To elucidate comprehensively the mediators of OIP5-AS1-regulated cell division, we used a strategy that identified OIP5-AS1-interacting mRNAs. We then selected those mRNAs encoding cell cycle regulatory proteins that showed altered levels after modulating OIP5-AS1 abundance. From the short list of 12 mRNAs that met these criteria, we focused our further analysis on GAK mRNA, as reduced GAK levels had been linked to appearance of abnormal mitoses [25] and elevated GAK levels were reported in several different cancers [26, 27].
Molecular analysis of the mechanisms through which OIP5-AS1 regulated GAK expression revealed that OIP5-AS1 and GAK mRNA shared stretches of complementarity that might contribute to the association of these two RNAs, although it is likely that other factors, such as RBPs, participate in this interaction. The observed association of the two RNAs (Figure 3) was likely to occur in the cytoplasm, in keeping with the finding that OIP5-AS1 was present in this compartment in HeLa cells [23]. We propose that the partial complementarity between OIP5-AS1 and GAK mRNA led to degradation of GAK mRNA, and conversely that silencing OIP5-AS1 increased GAK mRNA half-life. Earlier examples of decay-promoting lncRNAs include the ½sbs-RNAs, which accelerate the degradation of mRNAs with which they shared partial complementarity [28]. Whether OIP5-AS1 influenced additional levels of regulation of GAK expression, such as the cytoplasmic export, editing, storage, or translation of GAK mRNA, remains to be investigated.
Although OIP5-AS1 deficiency had been linked to several diverse cellular processes, it was apparent that GAK, a ubiquitous protein, might be implicated in events involving the DNA damage response, cell cycle checkpoints, and cell survival. However, the increase in GAK levels may also be responsible for other distinct phenotypes attributed to the reduction in OIP5-AS1 levels. For instance, GAK localizes in the trans-Golgi network and functions as an Hsc70 cochaperone, playing essential roles in membrane trafficking during endocytosis and the uncoating of clathrin-coated vesicles [29, 30]. Interestingly, the influence of GAK on clathrin metabolism may be connected to its influence on mitosis, since clathrin is mobilized to the mitotic spindle and promotes microtubule stability in early mitosis [31]. Given that silencing clathrin impairs the assembly and segregation of chromosomes, causing arrest at metaphase, perhaps higher levels of GAK lead to the aberrant removal of clathrin and the same aberrant mitotic progression as that seen after silencing OIP5-AS1. The hypothesis that GAK overexpression might trigger aberrant mitoses and the additional possibility that this effect is due to the uncoating of clathrin from microtubules awaits experimental testing.
Other studies have shown that GAK is a transcriptional coactivator of the androgen receptor (AR), a ligand-dependent transcription factor highly expressed in prostate cancer [26]. In addition, GAK was shown to be a key player in the p53-MDM2 axis, helping to regulate p53 levels in cells responding to DNA damage stress [32]. Importantly, conditional depletion of GAK in mouse brain, liver or skin was lethal, even if the deletion was elicited in adult mice, indicating that GAK is essential both for embryonic development and for survival of adult animals [33]. By contrast, its transient knockdown induced DNA damage and misalignment of microtubule spindles in mitotic cells [25, 34], suggesting that long-term loss of GAK could be compensated during development by other proteins, while acute loss that did not allow adaptation was strongly cytotoxic.
The aberrant mitoses observed by silencing OIP5-AS1 were due, at least to some extent, to the elevation of GAK in this transfection group, since concomitant silencing of GAK corrected this problem, restoring the mitotic phenotype close to that seen in the control population. At the same time, simply reducing GAK, as reported earlier [25], also caused aberrant mitoses including multipolar and monopolar spindles (Figure 5A). These sets of observations were somewhat unexpected, since they suggest that in both scenarios, when GAK is abnormally high and when GAK is abnormally low, cells exhibit impaired mitosis. Collectively, these findings suggest that GAK functions to orchestrate mitosis within a narrow range of abundance, and both excess or insufficient GAK impair mitotic progression.
In closing, the paradoxical function of GAK on cell division is further apparent when considering its impact on population growth. Short-term silencing of OIP5-AS1 (for up to 5 days) elevated GAK and promoted cell proliferation, in agreement with higher production of cyclins A and D1 [23]. However, the burden of aberrant mitotic cells accumulating over time when GAK is elevated would be expected to prevent long-term expansion of the population. We propose that the complex impact of GAK on population growth depends on the specific context of the cell and whether the cell expresses proteins that enable senescence, death, proliferation or survival. The regulation of GAK levels by OIP5-AS1 illustrates the dynamic impact of lncRNAs on post-transcriptional gene expression programs, including those that influence cancer and other diseases characterized by aberrant proliferation.
MATERIALS AND METHODS
Cell culture and transfection of siRNA and plasmids
Human cervical carcinoma HeLa cells and osteosarcoma U2OS cells were cultured in Dulbecco’s modified Eagle’s medium (DMEM) containing 10% (v/v) fetal bovine serum (FBS), antibiotics, and antimycotics. The siRNA duplexes listed in Supplementary Table 2 were transfected at 50 nM final concentration using Lipofectamine 2000 (Invitrogen). Plasmids (2 μg each) were transfected using Lipofectamine 2000.
Total RNA and MS2-OIP5-AS1-bound RNA analysis
Total RNA was isolated from HeLa cells using Trizol (Invitrogen) and cDNA was synthesized by performing a conventional reverse transcription (RT) reaction using random hexamers and Maxima reverse transcriptase (Thermo Scientific). Following real-time, quantitative PCR (qPCR) amplification using specific primers (Supplementary Table 3) and SYBR green master mix (Kapa Biosystems) in an Applied Biosystems 7300 instrument, the relative levels of mRNAs of interest were measured by the 2-ΔΔCt method.
The analysis of RNA bound to MS2-OIP5-AS1 RNA was carried out using the MS2-RNA-tagging method described earlier [23]. Pulldown was performed using GSH-beads and RNA was labeled according to the manufacturer’s instructions using the Illumina® TotalPrepTM RNA amplification kit (Illumina, San Diego, CA). A total of 750 ng biotinylated aRNA was hybridized overnight to HumanHT-12 v4 BeadChip microarrays; after rinsing, arrays were incubated with streptavidin-conjugated Cy3, and scanned at 0.53 microns using an Illumina iScan scanner. Hybridization intensity data were extracted from the scanned images, and evaluated using Illumina GenomeStudio software, V2011.1. Raw and normalized microarray data are publicly accessible under GEO identifier GSE93551. Total RNA from synchronized U2OS cultures was analyzed by Arraystar (using AS-S-LNC-H microarrays).
Western blot analysis
Total protein was lysed in RIPA buffer containing protease inhibitor and 1 mM dithiothreitol (DTT) on ice. Protein lysates were size-separated by SDS-PAGE and transferred onto nitrocellulose membrane (Invitrogen). For Western blot analysis, primary antibodies were used that recognized GAK (1:500) or HSP90 (1:20,000) (both from Santa Cruz Biotechnology) after blocking in 5% non-fat dry milk. After incubation with appropriate secondary antibodies, protein signals were detected using chemiluminescence (Millipore).
Double thymidine block
For the double thymine block experiment, U2OS cells were cultured to 40% confluency in 10-mm dishes containing DMEM supplemented with 10% FBS. For the first thymidine block, cells were incubated in serum-free DMEM medium containing 2 mM thymidine (Sigma-Aldrich) and 14 h later cells were washed twice with PBS and incubated for 9 h in DMEM with 10% FBS; the second thymidine block was performed by repeating these same treatments on the same cells. After washing in PBS, cells were immediately harvested or further cultured in DMEM to reach the desired time points, whereupon cells were analyzed by fluorescence-activated cell sorting (FACS) using standard methods and RNA was extracted and quantified by microarray analysis.
Antisense oligomer pulldown
For antisense oligomer pulldown analysis, streptavidin magnetic beads (Pierce) pre-washed in TENT buffer (10 mM Tris-HCl [pH 8.0], 1 mM EDTA [pH 8.0], 250 mM NaCl, 0.5% [v/v] Triton X-100, protease and RNase inhibitors) were incubated with sense or antisense biotinylated oligomers (Supplementary Table 4) for 30 min at room temperature. Cell lysates were prepared on ice in PEB buffer (20 mM Tris-HCl [pH 7.5], 100 mM KCl, 5 mM MgCl2, 0.5% Nonidet P-40) containing 1 mM DTT and protease and RNase inhibitors. The cell lysates were incubated with the beads coated with biotinylated sense or antisense oligomers for another 30 min at room temperature with gentle shaking. Using a magnetic column, the streptavidin beads were washed with TENT buffer, RNA was directly extracted from the beads using Trizol (Invitrogen) following the manufacturer’s recommendations, and further analyzed by RT-qPCR to detect specific mRNAs bound to the biotinylated oligomers.
DNA staining, immunostaining and microscopy
HeLa cells were cultured in 4-well chamber slides (Nalge Nunc). Seventy-two hours after transfection with the siRNAs indicated, cells were fixed in 4% paraformaldehyde and permeabilized in 1% Triton X-100. After washing with PBS three times, the cells were blocked in 4% bovine serum albumin (BSA) at room temperature for 1 h. The slides were incubated with primary antibodies recognizing α-tubulin (Sigma-Aldrich) or γ-tubulin (Santa Cruz) (1:400 dilution) followed by incubation with the appropriate fluorescent secondary antibodies. DNA was visualized by staining with Hoechst 33342 and the slide preparations were sealed and observed using an LSM 710 (ZEISS) microscope.
Microarray and proteomic analyses
For the microarray analysis, RNAs bound to OIP5-AS1 RNA were enriched by affinity pulldown using the MS2-tagging method described earlier [23]. Pulldown was performed using GSH beads and the bound RNA was analyzed using Illumina microarrays (GSE93551). Total RNA from synchronized U2OS cultures was analyzed by Arraystar (AS-S-LNC-H microarrays) (GSE93551).
For LC/MS analysis, total protein lysates were prepared from HeLa cells 72 h after transfection with Ctrl siRNA or OIP5-AS1 siRNA using RIPA buffer containing protease inhibitors on ice. Proteins were identified and analyzed by Poochon Scientific by employing a Q Exactive Mass Spectrometer and following the company protocol.
Author contributions
JK, JHN, SL, RM, KA, AS, EL, YZ performed experiments; JK, MG analyzed the data; JHN, KA, SL, WW and MG contributed reagents and expertise; and JK and MG wrote the paper.
ACKNOWLEDGMENTS
This work was supported in its entirety by the National Institute on Aging-Intramural Research Program, National Institutes of Health.
REFERENCES
1. Moore MJ. From birth to death: the complex lives of eukaryotic mRNAs. Science. 2005; 309:1514-1518.
2. Fabian MR, Sonenberg N, Filipowicz W. Regulation of mRNA translation and stability by microRNAs. Annu Rev Biochem. 2010; 79:351-379.
3. Morris AR, Mukherjee N, Keene JD. Systematic analysis of posttranscriptional gene expression. Wiley Interdiscip Rev Syst Biol Med. 2010; 2:62-180.
4. Castello A, Fischer B, Eichelbaum K, Horos R, Beckmann BM, Strein C, Davey NE, Humphreys DT, Preiss T, Steinmetz LM, Krijgsveld J, Hentze MW. Insights into RNA biology from an atlas of mammalian mRNA-binding proteins. Cell. 2012; 149:1393-1406.
5. Yoon JH, Abdelmohsen K, Gorospe M. Posttranscriptional Gene Regulation by Long Noncoding RNA. J Mol Biol. 2013; 425:3723-3730.
6. Guttman M, Donaghey J, Carey BW, Garber M, Grenier JK, Munson G, Young G, Lucas AB, Ach R, Bruhn L, Yang X, Amit I, Meissner A, et al. lincRNAs act in the circuitry controlling pluripotency and differentiation. Nature. 2011; 477:295-300.
7. Schmitz SU, Grote P, Herrmann BG. Mechanisms of long noncoding RNA function in development and disease. Cell Mol Life Sci. 2016; 73:2491-2509.
8. Schmitt AM, Chang HY. Long Noncoding RNAs in Cancer Pathways. Cancer Cell. 2016; 29:452-463.
9. Luo Q, Chen Y. Long noncoding RNAs and Alzheimer's disease. Clin Interv Aging. 2016; 11:867-872.
10. Greco S, Gorospe M, Martelli F. Noncoding RNA in age-related cardiovascular diseases. J Mol Cell Cardiol. 2015; 83:142-155.
11. Rinn JL, Chang HY. Genome regulation by long noncoding RNAs. Ann Rev Biochem. 2012; 81:145-166.
12. Derrien T, Johnson R, Bussotti G, Tanzer A, Djebali S, Tilgner H, Guernec G, Martin D, Merkel A, Knowles DG, Lagarde J, Veeravalli L, Ruan X, et al. The GENCODE v7 catalog of human long noncoding RNAs: analysis of their gene structure, evolution, and expression. Genome Res. 2012; 22:1775-1789.
13. Guttman M, Rinn JL. Modular regulatory principles of large non-coding RNAs. Nature. 2012; 482:339-346.
14. Mercer TR, Dinger ME, Sunkin SM, Mehler MF, Mattick JS. Specific expression of long noncoding RNAs in the mouse brain. Proc Natl Acad Sci USA. 2008; 105:716-721.
15. Cabili MN, Trapnell C, Goff L, Koziol M, Tazon-Vega B, Regev A, Rinn JL. Integrative annotation of human large intergenic noncoding RNAs reveals global properties and specific subclasses. Genes Dev. 2011; 25:1915-1927.
16. Zhang B, Arun G, Mao YS, Lazar Z, Hung G, Bhattacharjee G, Xiao X, Booth CJ, Wu J, Zhang C, Spector DL. The lncRNA Malat1 is dispensable for mouse development but its transcription plays a cis-regulatory role in the adult. Cell Rep. 2012; 2:111-123.
17. Ji Z, Song R, Regev A, Struhl K. Many lncRNAs, 5'UTRs, and pseudogenes are translated and some are likely to express functional proteins. Elife. 2015; 4:e08890.
18. Evans JR, Feng FY, Chinnaiyan AM. The bright side of dark matter: lncRNAs in cancer. J Clin Invest. 2016; 126:2775-2782.
19. Chaudhary R, Lal A. Long noncoding RNAs in the p53 network. Wiley Interdiscip Rev RNA. 2016 [Epub ahead of print].
20. Grammatikakis I, Panda AC, Abdelmohsen K, Gorospe M. Long noncoding RNAs (lncRNAs) and the molecular hallmarks of aging. Aging (Albany NY). 2014; 6:992-1009. doi: 10.18632/aging.100710.
21. Dong J, Xu J, Wang X, Jin B. Influence of the interaction between long noncoding RNAs and hypoxia on tumorigenesis. Tumour Biol. 2016; 37:1379-1385.
22. Ulitsky I, Shkumatava A, Jan CH, Sive H, Bartel DP. Conserved function of lincRNAs in vertebrate embryonic development despite rapid sequence evolution. Cell. 2011; 147:1537–1550.
23. Kim J, Abdelmohsen K, Yang X, De S, Grammatikakis I, Noh JH, Gorospe M. LncRNA OIP5-AS1/cyrano sponges RNA-binding protein HuR. Nucleic Acids Res. 2016; 44:2378-2392.
24. Kanaoka Y, Kimura SH, Okazaki I, Ikeda M, Nojima H. GAK: a cyclin G associated kinase contains a tensin/auxilin-like domain. FEBS Lett 1997; 402:73–80.
25. Shimizu H, Nagamori I, Yabuta N, Nojima H. GAK, a regulator of clathrin-mediated membrane traffic, also controls centrosome integrity and chromosome congression. J Cell Sci. 2009; 122:3145-3152.
26. Ray MR, Wafa LA, Cheng H, Snoek R, Fazli L, Gleave M, Rennie PS. Cyclin G-associated kinase: a novel androgen receptor-interacting transcriptional coactivator that is overexpressed in hormone refractory prostate cancer. Int J Cancer. 2006; 118:1108-1119.
27. Sakurai MA, Ozaki Y, Okuzaki D, Naito Y, Sasakura T, Okamoto A, Tabara H, Inoue T, Hagiyama M, Ito A, Yabuta N, Nojima H. Gefitinib and luteolin cause growth arrest of human prostate cancer PC-3 cells via inhibition of cyclin G-associated kinase and induction of miR-630. PLoS One. 2014; 9:e100124.
28. Gong C, Maquat LE. lncRNAs transactivate STAU1-mediated mRNA decay by duplexing with 3' UTRs via Alu elements. Nature. 2011; 470:284-288.
29. Eisenberg E, Greene LE. Multiple roles of auxilin and hsc70 in clathrin-mediated endocytosis. Traffic. 2007; 8:640-646.
30. Sorkin A, von Zastrow M. Endocytosis and signalling: intertwining molecular networks. Nat Rev Mol Cell Biol. 2009; 10:609-622.
31. Royle SJ, Bright NA, Lagnado L. Clathrin is required for the function of the mitotic spindle. Nature. 2005; 434:1152-1157.
32. Chen X. Cyclin G: a regulator of the p53-Mdm2 network. Dev Cell. 2002; 2:518-519.
33. Lee DW, Zhao X, Yim YI, Eisenberg E, Greene LE. Essential role of cyclin-G-associated kinase (Auxilin-2) in developing and mature mice. Mol Biol Cell. 2008; 19:2766-2776.
34. Naito Y, Shimizu H, Kasama T, Sato J, Tabara H, Okamoto A, Yabuta N, Nojima H. Cyclin G-associated kinase regulates protein phosphatase 2A by phosphorylation of its B'γ subunit. Cell Cycle. 2012; 11:604-616.