
INTRODUCTION
Aromatic compounds are used in many industries and consumer products. Many of them are naturally occurring. Hence, they have become widely distributed in nature. Owing to their prevalence in the environment and their likelihood to often elicit unknown toxic effects, it is important to determine their potential hazard. Experimental determination of the toxicity is time consuming and expensive, and can be carried out only for compounds already synthesized. There is a strong need to develop computational tools that can used to predict toxicity. The information thus obtained would be very useful in prioritizing the targets concerned.
As is well known, many different QSAR (Quantitative Structure-Activity Relationship) models have been developed for drug development (see, e.g., [1–7]. The goal of this study was to develop a new QSAR model that can be used to predict the aquatic toxicity of aromatic compounds to tetrahymena pyriformis.
RESULTS
Descriptor selection by mRMR-GA-SVR
To examine the quality of a predictor, we need a metrics to quantitatively measure its accuracy. In the current study, a quantity called RMSE was introduced for such a purpose, as defined by
(1)
where ei and pi denote, respectively, the measured and predicted values for the i-th sample; n the total number of the samples in the training dataset. Obviously, the smaller the value of RMSE the better the set of selected descriptors.
Listed in Table 1 are the optimal RMSE values obtained by mRMR-GA-SVR under different types of kernel function. As shown in the table, the RMSE value is smaller when using six-descriptor subset under polynomial kernel function. The selected descriptors for QSAR model are energy of the lowest unoccupied molecular orbital (LUMO), the difference between HOMO and LUMO (ΔE), molecular weight (MW), logarithm of the octanol-water partition coefficient (logP), the number of halogen atoms (NHal), and the number of H-bond donors (NHdon).
Table 1: RMSE obtained by mRMR-GA-SVR method
RMSE |
Kernel function |
Descriptors |
|---|---|---|
0.41 |
Linear kernel |
ΔE, logP, 2χ, 3χc, 4χpc, 3χv, 1κa, Φ, B, NHal |
0.38 |
Polynomial kernel |
LUMO, ΔE, MW, logP, NHal, NHdon |
0.38 |
Gauss (RBF) kernel |
LUMO, ΔE, MW, logP, 1χv, 3χc, 4χpc, 4χpcv, 1κa, NHdon |
SVR model and its parameter selection
In this study, the polynomial kernel function was adopted. The aforementioned SVR model contains two uncertain parameters. One is C for the regularization parameter, and the other is ε for the insensitive loss function. Their values were determined by optimizing RMSE (cf. Eq.1) via the 5-fold cross-validation on the training dataset as shown in Figure 1 and Figure 2; i.e.,
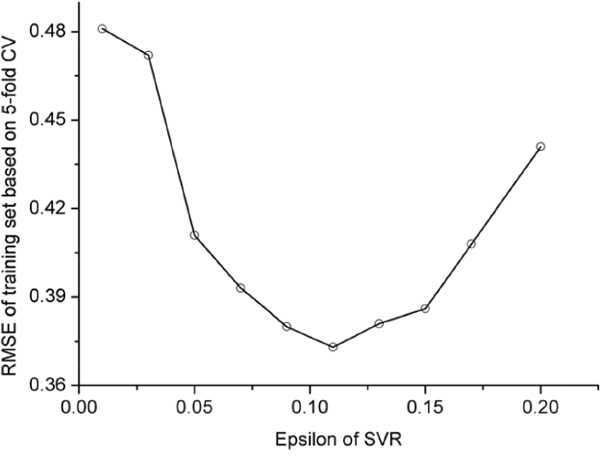
Figure 1: RMSE vs.ε in 5-fold CV using polynomial kernel function (C=2.3).
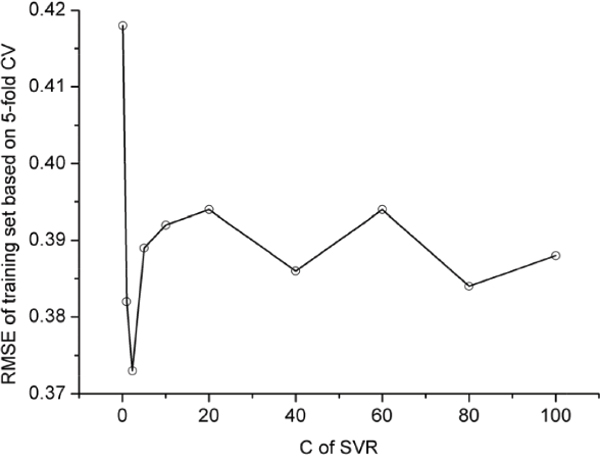
Figure 2: RMSE vs. C in 5-fold CV using polynomial kernel function (ε =0.11).
(2)
Thus, it follows
(3)
where is Lagrange coefficient to the corresponding support vector. Listed in Table 2 are the values of RMSE and R2 for log(IGC50-1) of aromatic compounds obtained by using trained SVR and PLS (partial least squares regression) models. The definition of R2 is given by
Table 2: RMSE, R2, and Q2 for logIGC50-1 obtained by training set and external test set using different models
Method |
Training set |
Test set |
||||
|---|---|---|---|---|---|---|
n |
RMSE |
R2 |
l |
RMSE |
Q2 |
|
SVR |
500 |
0.38 |
0.84 |
81 |
0.44 |
0.77 |
PLS |
500 |
0.42 |
0.78 |
81 |
0.50 |
0.68 |
ANN |
500 |
0.40 |
0.82 |
81 |
0.46 |
0.76 |
(4)
where ei and pi are the measured and predicted values for the i-th sample, is the average value of all samples, and n is the total number of samples investigated.
Validation of the SVR model
The model validation was conducted by comparing the predicted and observed logIGC50-1 of an independent dataset that were not included in the dataset used to train the model. The predictive power of SVR model was evaluated by a quality function Q2 as defined by
(5)
where l is the total number of the tested samples, and all the other symbols have the same meanings as in Eq.4. Shown in Figure 3 is a plot of the experimental vs. predicted logIGC50-1 values by using the SVR model for the training dataset and independent dataset.
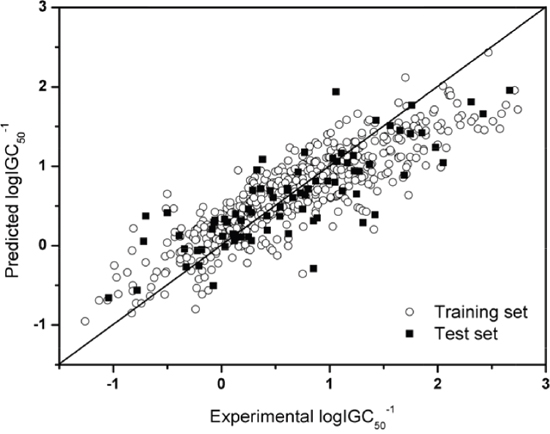
Figure 3: Plot of the experimental vs. predicted logIGC50-1 values by the SVR model.
DISCUSSION
Comparison to the PLS and ANNs
In a benchmark test, the SVR was compared with PLS and ANN (artificial neural network) methods, as shown in Table 2. As shown from the table, the SVR model outperformed both the PLS model and ANN model, indicating that the SVR model would have better generalization ability.
Effects of the descriptors to the model
The current model was built based on six selected descriptors. To investigate into the effects of the descriptors on the SVR model, let us consider the following outcomes. The quality function Q2 was reduced from 0.84 to 0.55 (Table 3) when excluding the MW (molecular weight) descriptor, indicating that molecular weight or volume might have some effects on the toxicity of aromatic compounds.
Table 3: RMSE and Q2, logIGC50-1 of the training set and external test set of aromatic compounds using different descriptor subsets
Descriptor |
Training set |
Test set |
||
|---|---|---|---|---|
RMSE |
R2 |
RMSE |
Q2 |
|
LUMO, ΔE, MW, logP, NHal, NHdon |
0.38 |
0.84 |
0.44 |
0.77 |
ΔE, MW, logP, NHal, NHdon |
0.43 |
0.82 |
0.46 |
0.73 |
LUMO, MW, logP, NHal, NHdon |
0.43 |
0.82 |
0.46 |
0.73 |
LUMO, ΔE, logP, NHal, NHdon |
0.53 |
0.69 |
0.66 |
0.53 |
LUMO, ΔE, MW, NHal, NHdon |
0.55 |
0.69 |
0.64 |
0.56 |
LUMO, ΔE, MW, logP, NHdon |
0.44 |
0.82 |
0.47 |
0.74 |
LUMO, ΔE, MW, logP, NHal |
0.45 |
0.82 |
0.46 |
0.73 |
Sensitivity analysis
The sensitivity analysis (SA) method was employed to analyze the relationship between attributes and activity. The SA of logP, HOMO and Mass are given in Figures 4-9, respectively. It can be seen from Figures 5-7 that the value of logIGC50-1 is increasing with the increment of logP, MW and ΔE. Interestingly, just the opposite trend was observed from Figure 4, where the greater the LUMO is, the lower the logIGC50-1 would be, implying that electrons transfer in the process of toxicity interaction is from organic compounds to biological molecules.
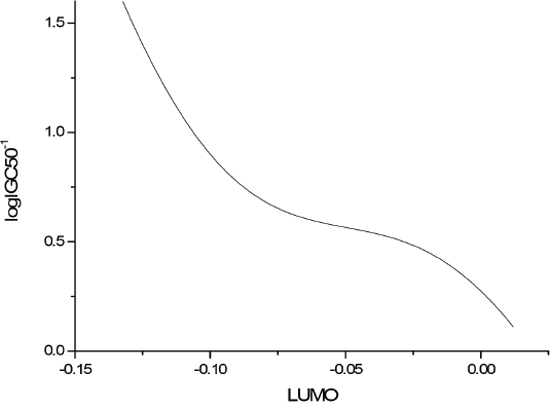
Figure 4: logIGC50-1 vs LUMO by SA.
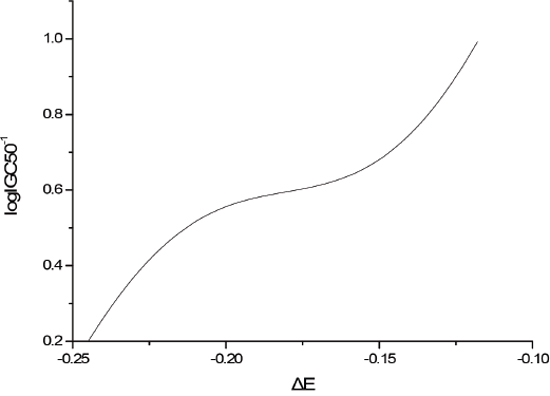
Figure 5: logIGC50-1 vs ΔE by SA.
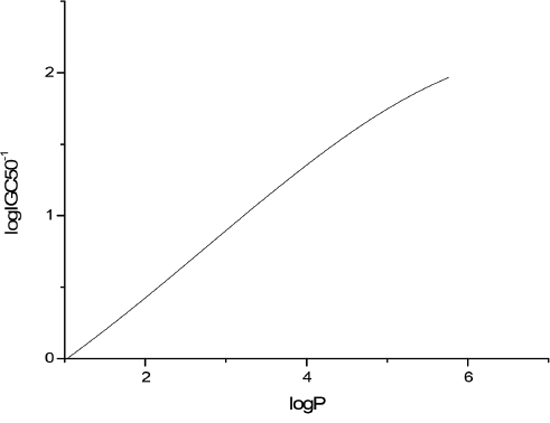
Figure 6: logIGC50-1 vs MW by SA.
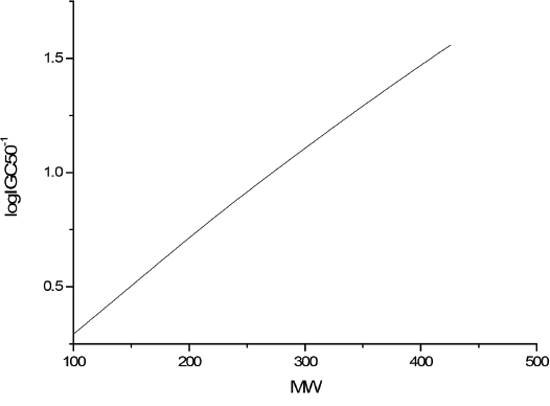
Figure 7: logIGC50-1 vs logP by SA.
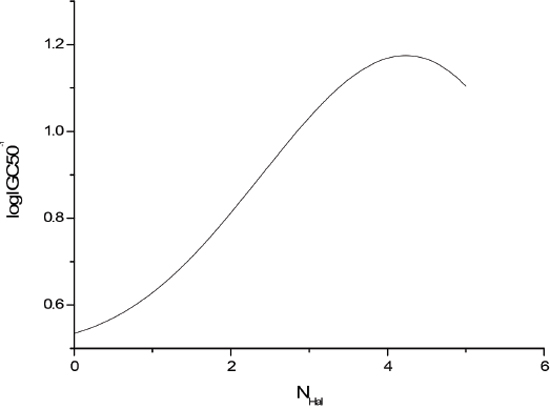
Figure 8: logIGC50-1 vs NHal by SA.
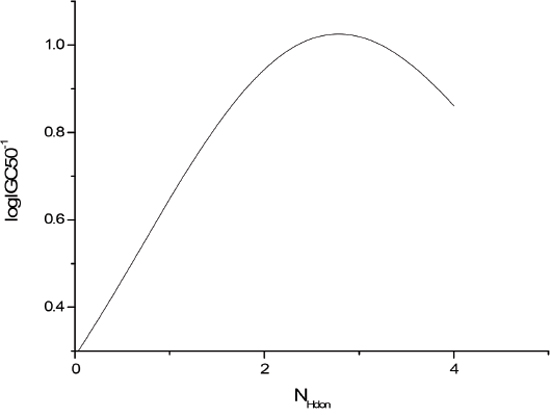
Figure 9: logIGC50-1 vs NHdon by SA.
Interpretation of descriptors
The descriptor logP is well known in predictive toxicology. It can describe membrane penetration and interaction with the molecular site of action. The descriptors ΔE and LUMO belong to quantum chemical descriptors. The descriptor ΔE accounts for general stability of a molecule. The descriptor LUMO is related to the relative electrophilicity. In the present study the ab initio Hartree-Fock level calculation provides a strong evidence of toxicity prediction ability of the global and local electrophilicity together with molecular stability. The descriptor NHdon plays a significant role in solubility behavior. As the hydrogen bond formation increases, water solubility increases (or n-octanol solubility decreases). MW is a general descriptor of size. Halogenated aromatic compounds are related to both the leaving and the electron-withdrawing properties of the group. The toxicity potency is imparted by the leaving ability of the halogen. The addition of the halogen atom increases toxicity in excess of what can be accounted for by hydrophobicity.
MATERIALS AND METHODS
To establish a really useful statistical predictor, according to the Chou’s 5-step rule [8] and realized in a series of recent publications [9–19], we should considered the following five procedures: (1) how to construct or select a valid benchmark dataset to train and test the model; (2) how to represent the samples with an effective mathematical expression that can truly reflect their essential correlation with the target concerned; (3) how to introduce or develop a powerful algorithm to run the prediction; (4) how to properly conduct cross-validation tests to objectively evaluate the anticipated accuracy; (5) how to provide a publically accessible web-server. In the rest of this paper, we are to address these point-by-point.
Benchmark dataset
In literature, the benchmark dataset usually consists of a training dataset and a testing dataset: the former is constructed for the purpose of training a proposed model, while the latter for the purpose of testing it. As pointed out by a comprehensive review [20], however, there is no need to separate a benchmark dataset into a training dataset and a testing dataset for validating a prediction method if it is tested by the jackknife [21] or subsampling (K-fold) cross-validation because the outcome thus obtained is actually from a combination of many different independent dataset tests.
The benchmark dataset used in this study consists of 581 aromatic compounds with structurally highly heterogeneity and their corresponding toxicity data to the ciliate tetrahymena pyriformis in term of log(IGC50-1) (mmol/l), which means the logarithmic value of the 50% inhibitory growth concentration (IGC50) of the ciliates. The toxicity values were taken from the literature [22–29]. A full list of the toxicity values as well as molecular descriptors, or sample formulation [8], used in the SVR model is given in Supporting Information 1. The compounds with the toxicity values ranged from -1.26 to 2.74 log units included a large variety of classes: phenols, anilines, amides, carbonyls, nitro-compounds, cyanides, carboxylic acids, halogenated compounds (F, Cl, Br, I), esters, ethers, pyridines, quinines, and so forth.
The aforementioned 581 chemicals were divided into two sets: one with 500 chemicals used for training the model, and one with 81 chemicals for testing the model. In other words, the benchmark dataset was divided into two subsets: the training dataset and the independent dataset.
The Chemdraw Ultra Version 7.0 (CambridgeSoft Corporation, 2002) software was used for drawing the molecular structures. The molecular structures were optimized by use of the Gaussian 03 [30] (B3LYP/6-311G**) or HyperChem Version 7.5 (HyperCube Inc., 2002) (MM+). Molecular descriptors were obtained by Gaussian 03, HyperChem Version 7.5, and TSAR Version 3.3 (Oxford Molecular Limited, 2000) software’s. The mRMR feature pre-selection was performed by using a Red Hat Linux 32-bit-machine version package (http://home.penglab.com/proj/mRMR/). A (procedure for feature selection and a software package containing SVR and PLS methods were programmed in our lab. The validation of the software has been tested in some applications [31–33].
Molecular descriptors or sample formulation
In developing a powerful statistical predictor, it is very important to represent the statistical samples with an effective formulation that can truly reflect their essential correlation with the target concerned, as done in [34, 35] for proteome systems and in [36–38] for genome systems. Here we are dealing with a compound system, and the corresponding samples should be formulated in a different approach as given below.
The 68 descriptors were calculated with different software and they can be classified into six groups: quantum chemical, electrostatic, topological, geometrical, constitutional, and physicochemical descriptors. A full list of descriptors calculated is provided in Table 4. The methods to calculate descriptors are given below.
Table 4: Molecular descriptors and the obtaining methods
Software |
Descriptors |
|---|---|
Gaussian 03 |
HOMO energy, LUMO energy, the HOMO-LUMO gap (ΔE), the total molecular energy (ETot), the minimum (QNmax) and the maximum (QPmax) atomic partial charge, dipole moment (μ), polarizability (α) |
HyperChem release 7.5 |
Heat of formation (HF), molecular surface area (MSA), molecular volume (MVol), logarithm of the octanol-water partition coefficient (logP), hydration energy (HE), molecular refractivity (MR) |
TSAR V3.3 |
Molecular weight (MW); Kier and Hall simple and valence-corrected molecular connectivity indices (χ); Kappa shape indices (κ); shape flexibility (Φ); Wiener, Randic and Balaban topological indices; E-state indice (S); the number of H-bond donors (NHdon) and acceptors (NHacc); atom counts (oxygen, nitrogen, fluorine, chlorine, bromine, iodine, halogen atoms, heteroatoms); group counts (hydroxyl, amino, aldehyde, nitro, cyano, acid anhydride, methyl) |
The 8 quantum chemical descriptors were obtained using Gaussian 03 (shown in Table 4). All the geometries of the aromatic molecules (except I) are minimized at the Hartree-Fock level of theory with the 6-311 G** basis set followed by frequency calculations using the Gaussian 03 package.
The 6 electrostatic descriptors were calculated using the semi-empirical quantum-chemical method PM3 in HyperChem 7.5 software package (listed in Table 4). Geometry optimizations based on molecular mechanics (using the MM+ force field) and semi-empirical quantum mechanical calculations using PM3 were used to find the coordinates of molecular structures that represent a potential energy minimum. For geometry optimization using both molecular mechanics and semi-empirical quantum mechanical calculations, at the final stage of refinement, the Polak-Ribiere routine with RMS gradient of 0.001 kcal Å mol-1 as the termination condition was used.
Other descriptors were calculated with TSAR Version 3.3 as noted in Table 4.
mRMR
The mRMR (minimum redundancy maximum relevance) method [39] selects features that have the highest relevance with the target class and are also minimally redundant, i.e., selects features that are maximally dissimilar to each other. The idea of mRMR has been widely used to analyze various biological sequences (see, e.g., [10, 40–44]). For more information about mRMR, see [39, 40], where a detailed procedure has been elaborated. Hence there is no need to repeat here.
Descriptor selection for mRMR-GA-SVR
The performance of QSAR model closely depends on how to select the features of molecular structures (Table 5). In this study, a comprehensive feature selection method called mRMR-GA-SVR was introduced as described below.
Table 5: Parameters of the GA-SVR feature selection
Parameter |
Value |
Parameter |
Value |
|---|---|---|---|
Population Size |
50 |
Regression method |
SVR |
Maximum generations |
100 |
Cross-validation |
5-fold |
Probability of crossover |
0.75 |
Fitness function |
RMSE |
Probability of mutation |
0.01 |
Regularization parameter (C) |
10 |
In the first stage, the mRMR approach was applied for feature selection as done in [45]. There are three distinct advantages by doing so: (1) it can select the features that have better representativity for the targets concerned; (2) it can avoid the high dimension disaster problem [46]; and (3) it can narrow down the search space for the subsequent study.
In the second stage, a GA-based SVR or GA-SVR approach was applied to refines the mRMR-selected-features. The GA algorithm can be found in [47, 48]. The codes for GA-SVR program had been written in our lab using the Visual Basic language.
SVR algorithm
The Support Vector Machines (SVM) is a machine-learning algorithm, which has been widely used in many areas of bioinformatics (see, e.g., [10, 37, 49–54]). The key idea of SVM is to construct a separating hyper-plane so as to maximize the margin between the positive dataset and negative dataset. For a brief formulation of SVM and how it works, see the papers [55, 56]; for more details about SVM, see a monograph [57]. In SVR, the basic idea is to map the data X into a higher-dimensional feature space F via a nonlinear mapping Φ and then to do linear regression in this space. For more details about SVR, see Supporting Information 2.
Web server
As pointed out in [58], user-friendly and publicly accessible web-servers represent the future direction for developing practically more useful predictors or any computational tools. Actually, user-friendly web-servers as given in a series of recent publications [9, 10, 59–68] will significantly enhance the impacts of theoretical work because they can attract the broad experimental scientists [69]. Once the funding is available for purchasing the needed facilities, we will establish a web-server for the new QSAR model reported in this paper.
CONCLUSIONS
The SVR approach was used to develop a new QSAR model for predicting logIGC50-1 for a wide-ranging and heterogeneous set of aromatic compounds. The mRMR-GA-SVR method was applied for descriptor selection. The results have indicated that the mRMR-GA-SVR method is a very effective for QSAR analysis. The prediction ability of SVR was tested by an independent dataset of 81 aromatic compounds. The R2 for the training set for SVR is 0.84. And the Q2 for the independent test set is 0.77. It is anticipated that SVR will become a useful high throughput tool for detecting the potential toxicity to Tetrahymena pyriformis for a diverse set of aromatic compounds.
ACKNOWLEDGMENTS
The authors wish to thank the two anonymous reviewers, whose constructive comments are very helpful for strengthening the presentation of this paper. The present study was supported by The National Key research and Development Program of China (grant no. 2016YFD0501101), the Chinese National Natural Science Foundation (grant nos. 31571171, 31600867 and 31100838), the Shanghai Natural Science Foundation (grant no. 15ZR1414900), the Key Laboratory of Medical Electrophysiology (Southwest Medical University) of Ministry of Education of China (grant no.201502) and the Young Teachers of Shanghai Universities Training Program.
CONFLICTS OF INTEREST
The authors declare no conflicts of interest.
REFERENCES
1. Du QS, Mezey PG. Heuristic Molecular Lipophilicity Potential (HMLP): A 2D-QSAR Study to LADH of Molecular Family Pyrazole and Derivatives. J Comput Chem. 2005; 26:461-470.
2. Du QS, Huang RB. Review: Recent advances in QSAR and their applications in predicting the activities of chemical molecules, peptides and proteins for drug design. Current Protein & Peptide Science. 2008; 9:248-259.
3. Du QS, Huang RB, Wei YT, Pang ZW. Fragment-Based Quantitative Structure-Activity Relationship (FB-QSAR) for Fragment-Based Drug Design. J Comput Chem. 2009; 30:295-304.
4. Prado-Prado FJ, Gonzalez-Diaz H, de la Vega OM. Unified QSAR approach to antimicrobials. Part 3: First multi-tasking QSAR model for Input-Coded prediction, structural back-projection, and complex networks clustering of antiprotozoal compounds. Bioorganic & Medicinal Chemistry. 2008; 16:5871-5880.
5. Dea-Ayuela MA, Perez-Castillo Y, Meneses-Marcel A, Ubeira FM, Bolas-Fernandez F, Gonzalez-Diaz H. HP-Lattice QSAR for dynein proteins: Experimental proteomics (2D-electrophoresis, mass spectrometry) and theoretic study of a Leishmania infantum sequence. Bioorg Med Chem. 2008; 16:7770-7776.
6. Prado-Prado FJ, Martinez de la Vega O, Uriarte E, Gonzalez-Diaz H. Unified QSAR approach to antimicrobials. 4. Multi-target QSAR modeling and comparative multi-distance study of the giant components of antiviral drug-drug complex networks. Bioorg Med Chem. 2009; 17:569-575.
7. Wei H, Wang CH, Du QS, Meng J. Investigation into adamantane-based M2 inhibitors with FB-QSAR. Medicinal Chemistry. 2009; 5:305-317.
8. Chou KC. Some remarks on protein attribute prediction and pseudo amino acid composition (50th Anniversary Year Review). J Theor Biol. 2011; 273:236-247.
9. Chen W, Feng PM, Lin H. iRSpot-PseDNC: identify recombination spots with pseudo dinucleotide composition. Nucleic Acids Res. 2013; 41:e68.
10. Lin H, Deng EZ, Ding H, Chen W, Chou KC. iPro54-PseKNC: a sequence-based predictor for identifying sigma-54 promoters in prokaryote with pseudo k-tuple nucleotide composition. Nucleic Acids Res. 2014; 42:12961-12972.
11. Jia J, Liu Z, Xiao X, Liu B. iPPBS-Opt: A Sequence-Based Ensemble Classifier for Identifying Protein-Protein Binding Sites by Optimizing Imbalanced Training Datasets. Molecules. 2016; 21:95.
12. Liu B, Fang L, Long R, Lan X. iEnhancer-2L: a two-layer predictor for identifying enhancers and their strength by pseudo k-tuple nucleotide composition. Bioinformatics. 2016; 32:362-369.
13. Jia J, Liu Z, Xiao X, Liu B. iSuc-PseOpt: Identifying lysine succinylation sites in proteins by incorporating sequence-coupling effects into pseudo components and optimizing imbalanced training dataset. Anal Biochem. 2016; 497:48-56.
14. Liu Z, Xiao X, Yu DJ, Jia J. pRNAm-PC: Predicting N-methyladenosine sites in RNA sequences via physical-chemical properties. Anal Biochem. 2016; 497:60-67.
15. Jia J, Liu Z, Xiao X, Liu B. pSuc-Lys: Predict lysine succinylation sites in proteins with PseAAC and ensemble random forest approach. J Theor Biol. 2016; 394:223-230.
16. Qiu WR, Sun BQ, Xiao X. iPTM-mLys: identifying multiple lysine PTM sites and their different types. Bioinformatics. 2016; 32:3116-3123.
17. Meher PK, Sahu TK, Saini V, Rao AR. Predicting antimicrobial peptides with improved accuracy by incorporating the compositional, physico-chemical and structural features into Chou’s general PseAAC. Sci Rep. 2017; 7:42362.
18. Cheng X, Zhao SG. iATC-mISF: a multi-label classifier for predicting the classes of anatomical therapeutic chemicals. Bioinformatics. 2017; 33:341-346.
19. Liu B, Wang S, Long R. iRSpot-EL: identify recombination spots with an ensemble learning approach. Bioinformatics. 2017; 33:35-41.
20. Chou KC, Shen HB. Review: Recent progresses in protein subcellular location prediction. Anal Biochem. 2007; 370:1-16.
21. Chou KC, Zhang CT. Review: Prediction of protein structural classes. Crit Rev Biochem Mol Biol. 1995; 30:275-349.
22. Cronin MT, Schultz TW. Structure-toxicity relationships for phenols to Tetrahymena pyriformis. Chemosphere. 1996; 32:1453-1468.
23. Schultz TW. Structure- toxicity relationships for benzenes evaluated with tetrahymena pyriformis. Chemical research in toxicology. 1999; 12:1262-1267.
24. Cronin M, Manga N, Seward J, Sinks G, Schultz TW. Parametrization of electrophilicity for the prediction of the toxicity of aromatic compounds. Chemical research in toxicology. 2001; 14:1498-1505.
25. Serra J, Jurs P, Kaiser K. Linear regression and computational neural network prediction of tetrahymena acute toxicity for aromatic compounds from molecular structure. Chemical research in toxicology. 2001; 14:1535-1545.
26. Cronin MT, Aptula AO, Duffy JC, Netzeva TI, Rowe PH, Valkova IV, Schultz TW. Comparative assessment of methods to develop QSARs for the prediction of the toxicity of phenols to Tetrahymena pyriformis. Chemosphere. 2002; 49:1201-1221.
27. Cronin MT, Netzeva TI, Dearden JC, Edwards R, Worgan AD. Assessment and modeling of the toxicity of organic chemicals to Chlorella vulgaris: development of a novel database. Chemical research in toxicology. 2004; 17:545-554.
28. Aptula AO, Roberts DW, Cronin MT, Schultz TW. Chemistry- toxicity relationships for the effects of di-and trihydroxybenzenes to Tetrahymena pyriformis. Chemical research in toxicology. 2005; 18:844-854.
29. Netzeva TI, Schultz TW. QSARs for the aquatic toxicity of aromatic aldehydes from Tetrahymena data. Chemosphere. 2005; 61:1632-1643.
30. Frisch M, Trucks G, Schlegel H, Scuseria G, Robb M, Cheeseman J, Scalmani G, Barone V, Mennucci B, Petersson G: Gaussian 09, Revision A, Gaussian. Inc, Wallingford CT 2009.
31. Yang S, Lu W, Chen N, Hu Q. Support vector regression based QSPR for the prediction of some physicochemical properties of alkyl benzenes. Journal of Molecular Structure: THEOCHEM. 2005; 719:119-127.
32. Gu T, Lu W, Bao X, Chen N. Using support vector regression for the prediction of the band gap and melting point of binary and ternary compound semiconductors. Solid state sciences. 2006; 8:129-136.
33. Yang SS, Lu WC, Gu TH, Yan LM, Li GZ. QSPR study of n-octanol/water partition coefficient of some aromatic compounds using support vector regression. QSAR and Combinatorial Science. 2009; 28:175.
34. Chou KC. Prediction of protein cellular attributes using pseudo amino acid composition. PROTEINS: Structure, Function, and Genetics (Erratum: ibid, 2001, Vol44, 60). 2001; 43:246-255.
35. Chou KC. Pseudo amino acid composition and its applications in bioinformatics, proteomics and system biology. Current Proteomics. 2009; 6: 262-274.
36. Chen W, Lei TY, Jin DC, Lin H. PseKNC: a flexible web-server for generating pseudo K-tuple nucleotide composition. Anal Biochem. 2014; 456:53-60.
37. Chen W, Feng PM, Deng EZ. iTIS-PseTNC: a sequence-based predictor for identifying translation initiation site in human genes using pseudo trinucleotide composition. Anal Biochem. 2014; 462:76-83.
38. Chen W, Lin H, Chou KC. Pseudo nucleotide composition or PseKNC: an effective formulation for analyzing genomic sequences. Mol BioSyst. 2015; 11:2620-2634.
39. Peng H, Long F, Ding C. Feature selection based on mutual information criteria of max-dependency, max-relevance, and min-redundancy. IEEE Transactions on pattern analysis and machine intelligence. 2005; 27:1226-1238.
40. Huang T, Chen L, Cai YD. Classification and analysis of regulatory pathways using graph property, biochemical and physicochemical property, and functional property. PLoS ONE. 2011; 6:e25297.
41. Hu L, Huang T, Shi X, Lu WC. Predicting functions of proteins in mouse based on weighted protein-protein interaction network and protein hybrid properties. PLoS ONE. 2011; 6:e14556.
42. Wang P, Hu L, Liu G, Jiang N, Chen X, Xu J, Zheng W, Li L, Tan M, Chen Z, Song H. Prediction of antimicrobial peptides based on sequence alignment and feature selection methods. PLoS ONE. 2011; 6:e18476.
43. Zheng LL, Li YX, Ding J, Guo XK, Feng KY, Wang YJ, Hu LL, Cai YD. A comparison of computational methods for identifying virulence factors. PLoS One. 2012; 7:e42517.
44. Li BQ, Huang T, Liu L, Cai YD. Identification of colorectal cancer related genes with mRMR and shortest path in protein-protein interaction network. PLoS ONE. 2012; 7:e33393.
45. Ding C, Peng H. Minimum redundancy feature selection from microarray gene expression data. Journal of bioinformatics and computational biology. 2005; 3:185-205.
46. Wang T, Yang J, Shen HB. Predicting membrane protein types by the LLDA algorithm. Protein & Peptide Letters. 2008; 15:915-921.
47. Holland JH. Genetic algorithms. Scientific american. 1992; 267:66-72.
48. Leardi R, Boggia R, Terrile M. Genetic algorithms as a strategy for feature selection. Journal of chemometrics. 1992; 6:267-281.
49. Feng PM, Chen W, Lin H. iHSP-PseRAAAC: Identifying the heat shock protein families using pseudo reduced amino acid alphabet composition. Anal Biochem. 2013; 442:118-125.
50. Guo SH, Deng EZ, Xu LQ, Ding H, Lin H. iNuc-PseKNC: a sequence-based predictor for predicting nucleosome positioning in genomes with pseudo k-tuple nucleotide composition. Bioinformatics. 2014; 30:1522-1529.
51. Xu Y, Wen X, Shao XJ, Deng NY. iHyd-PseAAC: Predicting hydroxyproline and hydroxylysine in proteins by incorporating dipeptide position-specific propensity into pseudo amino acid composition. Int J Mol Sci. 2014; 15:7594-7610.
52. Qiu WR, Xiao X. iRSpot-TNCPseAAC: Identify recombination spots with trinucleotide composition and pseudo amino acid components. Int J Mol Sci (IJMS). 2014; 15:1746-1766.
53. Liu B, Fang L, Wang S, Wang X. Identification of microRNA precursor with the degenerate K-tuple or Kmer strategy. Journal of Theoretical Biology. 2015; 385:153-159.
54. Chen J, Long R, Wang XL. dRHP-PseRA: detecting remote homology proteins using profile-based pseudo protein sequence and rank aggregation. Scientific Reports. 2016:6:32333.
55. Chou KC, Cai YD. Using functional domain composition and support vector machines for prediction of protein subcellular location. J Biol Chem. 2002; 277:45765-45769.
56. Cai YD, Zhou GP. Support vector machines for predicting membrane protein types by using functional domain composition. Biophys J. 2003; 84:3257-3263.
57. Cristianini N, Shawe-Taylor J. (2000). An Introduction to Support Vector Machines and Other Kernel-based Learning Methods, Chapter 3: Cambridge University Press).
58. Chou KC, Shen HB. Review: recent advances in developing web-servers for predicting protein attributes. Natural Science. 2009; 1:63-92
59. Jia J, Liu Z, Xiao X. iPPI-Esml: an ensemble classifier for identifying the interactions of proteins by incorporating their physicochemical properties and wavelet transforms into PseAAC. J Theor Biol. 2015; 377:47-56.
60. Chen W, Ding H, Feng P. iACP: a sequence-based tool for identifying anticancer peptides. Oncotarget. 2016; 7:16895-16909. doi: 10.18632/oncotarget.7815.
61. Jia J, Liu Z, Xiao X, Liu B. iCar-PseCp: identify carbonylation sites in proteins by Monto Carlo sampling and incorporating sequence coupled effects into general PseAAC. Oncotarget. 2016; 7:34558-34570. doi: 10.18632/oncotarget.9148.
62. Liu B, Wu H, Zhang D. Pse-Analysis: a python package for DNA/RNA and protein/peptide sequence analysis based on pseudo components and kernel methods. Oncotarget. 2017; 8:4208-4217. doi: 10.18632/oncotarget.14524.
63. Qiu WR, Sun BQ, Xiao X. iHyd-PseCp: Identify hydroxyproline and hydroxylysine in proteins by incorporating sequence-coupled effects into general PseAAC. Oncotarget. 2016; 7:44310-44321. doi: 10.18632/oncotarget.10027.
64. Qiu WR, Xiao X, Xu ZH. iPhos-PseEn: identifying phosphorylation sites in proteins by fusing different pseudo components into an ensemble classifier. Oncotarget. 2016; 7:51270-51283. doi: 10.18632/oncotarget.9987.
65. Xiao X, Ye HX, Liu Z, Jia JH. iROS-gPseKNC: predicting replication origin sites in DNA by incorporating dinucleotide position-specific propensity into general pseudo nucleotide composition. Oncotarget. 2016; 7:34180-34189. doi: 10.18632/oncotarget.9057.
66. Zhang CJ, Tang H, Li WC, Lin H. iOri-Human: identify human origin of replication by incorporating dinucleotide physicochemical properties into pseudo nucleotide composition. Oncotarget. 2016; 7:69783-69793. doi: 10.18632/oncotarget.11975.
67. Chen W, Feng P, Yang H, Ding H. iRNA-AI: identifying the adenosine to inosine editing sites in RNA sequences. Oncotarget. 2017; 8:4208-4217. doi: 10.18632/oncotarget.13758.
68. Qiu WR, Jiang SY, Xu ZC. iRNAm5C-PseDNC: identifying RNA 5-methylcytosine sites by incorporating physical-chemical properties into pseudo dinucleotide composition. Oncotarget. 2017 Apr 17. doi: 10.18632/oncotarget.17104. [Epub ahead of print].
69. Chou KC. Impacts of bioinformatics to medicinal chemistry. Medicinal Chemistry. 2015; 11:218-234.