
INTRODUCTION
Osteosarcoma (OS) is a common primary bone tumor in young adults and adolescents [1], which is characterized by a high metastatic potential: approximately 20–25% of newly diagnosed patients harbor detectable lung-related metastases [2, 3]. Moreover, the distal femur and proximal tibia are frequent metastatic locations for OS. Despite recent improvements in therapeutic strategies, including surgical, radiotherapy and neoadjuvant chemotherapy, the 5-year survival of patients with OS remains below 70% [4].
Small-cell osteosarcoma (SCO) is a rare subtype of OS and accounts for less than 1% of OS cases [5]. SCO is highly aggressive and frequently found in the metaphyses of long bones, which results in a poor prognosis. Histologically, SCO presents as small, round, primitive, and undifferentiated cells with osteoid production [6]. Moreover, SCO does not respond to radiotherapy and is more aggressive than other subtypes of OS [7]. Thus, novel therapeutic strategies for patients with SCO are urgently needed.
The etiologic factors and mechanism underlying the pathogenesis of OS are currently unclear. An increasing number of studies show that microRNAs (miRNAs) play important roles in the tumorigenesis and development of OS. miRNAs are small non-coding RNA molecules (18–25 nt) that increase or repress the expression of target genes [8]. Specifically, the down-regulation of miR-133a and miR-539 are associated with an unfavorable prognosis for patients suffering from OS [9]. Moreover, miR-664 acts as an oncogene and promotes the proliferation of OS cells by down-regulating the expression of FOXO4. In addition, miR-664 promotes OS cell invasion and migration by suppressing the expression of SOX7 [10, 11]. Osteopontin is a phosphorylated glycoprotein involved in the invasion of OS cells, and the suppression of miR-4262 in OS cells promotes osteopontin-mediated cancer invasion [12]. Furthermore, the down-regulation of miR-26a and up-regulation of miR-27a reportedly contribute to the aggressiveness of OS, and low miR-26a expression and high miR-27a expression are associated with advanced TNM stage, tumor grade, and distant metastasis in patients with OS [13].
SCO is an exceedingly rare subtype of OS associated with a poor prognosis. However, the mechanism underlying the pathogenesis of SCO is unclear, and previous studies of SCO are case reports due to the rarity of this disease. In this study, high-throughput RNA sequencing was performed to obtain the miRNA and mRNA expression profiles of peripheral blood mononuclear cells (PBMCs) from patients with SCO to identify genes that are differentially expressed in these patients compared with healthy individuals and explore potential diagnostic biomarkers for SCO.
RESULTS
Genes dysregulated in patients with SCO compared with healthy individuals
Blood samples from 3 patients with SCO and 10 healthy control individuals were subjected to high-throughput RNA sequencing; mRNA reads were used to align to the UCSC human reference genome (hg.19), and miRNA reads were matched to miRBase database. Differences in the expression levels of miRNA and mRNA between samples from patients with SCO and healthy individuals were then analyzed.
Compared with healthy individuals, 37 dysregulated miRNAs, including 27 up-regulated and 10 down-regulated miRNAs, were identified in the PBMCs of patients with SCO patients, as shown in Table 1. Moreover, 1636 dysregulated mRNAs, including 555 up-regulated mRNAs and 1081 down-regulated mRNAs, were also identified in SCO. The top 20 significantly up-regulated and top 20 down-regulated mRNAs are listed in Table 2.
Table 1: Differentially expressed miRNAs in SCO compared with normal controls
miRNA |
log2FC |
P-value |
|---|---|---|
Up-regulated miRNAs |
||
hsa-miR-4676-5p |
4.103148 |
0.008024354 |
hsa-miR-6842-5p |
3.101667 |
0.008024354 |
hsa-miR-580-5p |
2.882593 |
0.004165488 |
hsa-miR-7850-5p |
1.607435 |
0.005552087 |
hsa-miR-5706 |
1.400998 |
0.002164524 |
hsa-miR-627-5p |
1.384528 |
0.003693182 |
hsa-miR-6868-3p |
1.296777 |
0.004165102 |
hsa-miR-19a-5p |
1.268304 |
0.007646879 |
hsa-miR-548e-3p |
1.028317 |
0.001442817 |
hsa-miR-21-5p |
0.933647 |
0.007984057 |
hsa-miR-191-5p |
0.885862 |
0.000803189 |
hsa-miR-3605-5p |
0.74933 |
0.009822637 |
hsa-miR-26b-5p |
0.741 |
0.000629361 |
hsa-let-7a-3p |
0.739606 |
0.002230048 |
hsa-miR-556-3p |
0.712671 |
0.008436748 |
hsa-miR-548j-3p |
0.690548 |
0.000462576 |
hsa-miR-500a-3p |
0.637856 |
0.004488069 |
hsa-miR-5690 |
0.63544 |
0.006641347 |
hsa-miR-221-5p |
0.600366 |
0.004591464 |
hsa-miR-6802-3p |
0.559877 |
0.004209508 |
hsa-miR-3174 |
0.339832 |
0.0009132 |
hsa-miR-7-1-3p |
0.272796 |
0.001506044 |
hsa-miR-4781-3p |
0.265409 |
0.00649929 |
hsa-miR-4511 |
0.171781 |
0.002387782 |
hsa-miR-6859-5p |
0.137966 |
0.001116084 |
hsa-miR-99b-3p |
0.077028 |
0.006497498 |
hsa-miR-1307-3p |
0.058939 |
0.001262399 |
Down-regulated miRNAs |
||
hsa-miR-4685-3p |
−2.02683 |
0.006488539 |
hsa-miR-125b-2-3p |
−1.84345 |
0.008826503 |
hsa-miR-379-3p |
−1.16001 |
6.49E−07 |
hsa-miR-656-3p |
−0.54022 |
0.001139873 |
hsa-miR-222-3p |
−0.49502 |
0.003284816 |
hsa-miR-570-3p |
−0.25872 |
0.009221198 |
hsa-miR-576-5p |
−0.15013 |
0.006721753 |
hsa-miR-221-3p |
−0.12721 |
0.006039399 |
hsa-miR-1260b |
−0.04075 |
0.000537561 |
hsa-miR-1284 |
−0.00496 |
0.001779152 |
SCO: small-cell osteosarcoma; FC: fold change.
Table 2: Differentially expressed mRNAs in SCO compared with normal controls
Gene symbol |
Log2FC |
P-value |
|---|---|---|
up-regulated mRNAs |
||
TINCR |
3.028985 |
0.039245 |
SMIM1 |
2.86932 |
0.027698 |
RBBP8 |
2.690018 |
0.015199 |
SORCS2 |
2.653466 |
0.000205 |
FAM89A |
2.633881 |
0.021369 |
CABP7 |
2.53465 |
0.011636 |
SPATA24 |
2.520196 |
0.043857 |
PGLYRP2 |
2.334439 |
0.046067 |
DNASE1L2 |
2.309282 |
0.011064 |
LOC101928111 |
2.292573 |
0.012952 |
ERGIC2 |
2.258767 |
0.022173 |
PTGFRN |
2.247947 |
0.02845 |
PROS1 |
2.221589 |
0.017288 |
TIMP3 |
2.221582 |
0.017287 |
RAB3A |
2.207956 |
0.046707 |
C16orf91 |
2.188473 |
0.045652 |
FAM83D |
2.046992 |
0.023751 |
GPRC5C |
2.044382 |
0.033657 |
LAMC3 |
2.035623 |
0.042842 |
PLOD2 |
1.995595 |
0.034861 |
Down-regulated mRNAs |
||
TICAM2 |
−3.38105 |
0.018968 |
MUC20 |
−2.46798 |
0.008805 |
MS4A1 |
−2.30667 |
0.006431 |
LOC100505716 |
−2.26707 |
0.044691 |
SLFN12L |
−2.24573 |
0.033332 |
TM4SF19 |
−2.22329 |
0.03167 |
HEMGN |
−2.22149 |
0.035928 |
ARHGEF10 |
−2.21973 |
0.026584 |
LOC100129215 |
−2.20143 |
0.029742 |
POLR2K |
−2.17318 |
0.02433 |
FASLG |
−2.17244 |
0.028758 |
ZNF41 |
−2.16603 |
0.024358 |
PLEKHA8 |
−2.14986 |
0.034366 |
RSAD2 |
−2.11035 |
0.043712 |
BMS1P5 |
−2.07825 |
0.01964 |
TTC21B |
−2.06803 |
0.039198 |
NCR3LG1 |
−2.06803 |
0.049214 |
ATP6V1G2-DDX39B |
−2.04579 |
0.044986 |
NUP107 |
−2.03082 |
0.042533 |
RIF1 |
−1.997 |
0.008844 |
SCO: small-cell osteosarcoma.
GO annotation of dysregulated genes in SCO
1636 dysregulated genes in SCO were performed to GO annotation to obtain the biological roles. GO terms with FDR < 0.05 were considered as significant enrichment. Regulation of transcription, DNA-dependent (GO: 0006355, FDR = 1.77E-22), RNA splicing (GO: 0008380, FDR = 1.41E-14) and mitotic cell cycle (GO: 0000278, FDR = 1.89E-12) were the most significant enrichments of biological process (Figure 1A); protein binding (GO: 0005515, FDR = 1.32E-68), metal ion binding (GO: 0046872, FDR = 3.16E-35) and nucleotide binding (GO: 0000166, FDR = 5.40E-30) were the highest enrichment of molecular function (Figure 1B); nucleus (GO: 0005634, FDR = 1.15E-94), cytoplasm (GO: 0005737, FDR = 7.67E-54) and nucleolus (GO: 0005730, FDR = 5.86E-40) was the highest enrichment of cellular component, as Figure 1C shown.
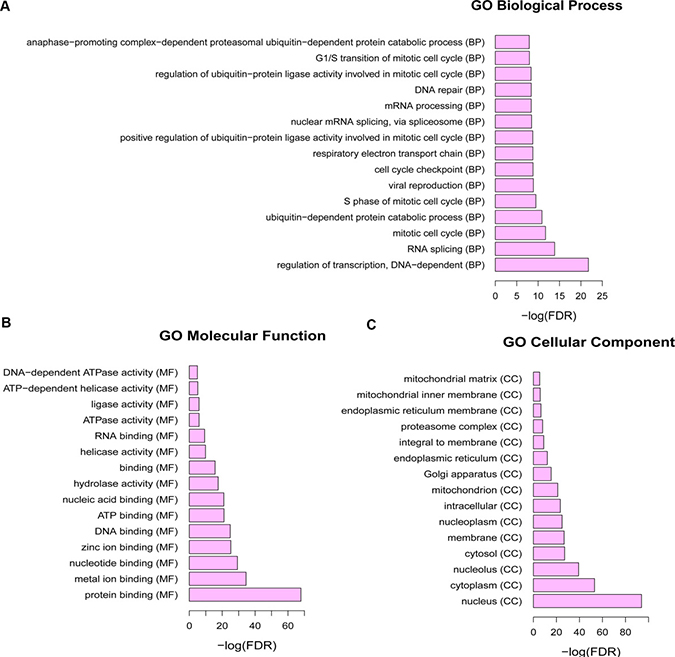
Figure 1: The Gene Ontology term enrichment of dysregulated mRNAs in SCO. FDR: false discovery rate. (A): Biological processes of Gene Ontology terms; (B): molecular functions of Gene Ontology terms; (C): cellular components of Gene Ontology terms.
KEGG pathway annotation of dysregulated genes in SCO
KEGG is a knowledge database for the systematic functional analysis of genes to connect genomic information with higher functional information by computerizing current knowledge on cellular processes and standardizing gene annotations. Thus, KEGG analyses were performed to assign pathways and functionally classify genes that are dysregulated in SCO. An FDR < 0.05 was defined as significant KEGG pathway enrichment. As shown in Table 3, pathways in cancer, mTOR signaling, oxidative phosphorylation, cell cycle, apoptosis, and DNA replication were significantly enriched KEGG pathways.
Table 3: KEGG analysis of dysregulated mRNAs in SCO
KEGG ID |
Items |
No. |
FDR |
Genes |
|---|---|---|---|---|
Kegg: 00190 |
Oxidative phosphorylation |
22 |
1.23E-06 |
NDUFB4, ATP5J, ATP6V1F, ATP6V1G1, NDUFA2, UQCRC1, COX6A1, CYC1, COX6B1, |
Kegg: 05221 |
Acute myeloid leukemia |
11 |
0.000311 |
MTOR, BAD, PIK3CB, RPS6KB1, RUNX1, PIM2, PIK3R1, MAP2K2, RPS6KB2, AKT2, PIM1 |
Kegg: 04210 |
Apoptosis |
13 |
0.000714 |
BAD, CASP7, EXOG, PIK3CB, CASP10, BIRC3, FASLG, IRAK1, PIK3R1, PRKX, BAX, AKT2, ATM |
Kegg: 03030 |
DNA replication |
8 |
0.000915 |
POLA1, RFC2, RFC1, MCM6, POLD4, PRIM1, PCNA, RFC4 |
Kegg: 05200 |
Pathways in cancer |
29 |
0.001249 |
WNT10A, MTOR, MSH2, PTCH1, TRAF5, BAD, STAT1, DAPK3, BIRC5, PIK3CB, LAMA2, PRKCG, |
Kegg: 04012 |
ErbB signaling pathway |
12 |
0.002552 |
MTOR, BAD, PIK3CB, PRKCG, RPS6KB1, PAK4, PIK3R1, SHC1, MAP2K2, RPS6KB2, AKT2, CBLB |
Kegg: 04150 |
mTOR signaling pathway |
8 |
0.009348 |
MTOR, PIK3CB, RPS6KB1, TSC1, PIK3R1, TSC2, RPS6KB2, AKT2 |
Kegg: 03018 |
RNA degradation |
9 |
0.010472 |
SKIV2L2, CNOT7, PAN2, TTC37, DHX36, EXOSC9, HSPD1, EXOSC8, LSM3 |
Kegg: 04110 |
Cell cycle |
13 |
0.01212 |
CDC14A, FZR1, ANAPC1, CDC23, ATR, ANAPC4, CCNB1, MCM6, CUL1, CDC14B, PCNA, E2F4, ATM |
Kegg: 04622 |
RIG-I-like receptor signaling pathway |
9 |
0.014533 |
DHX58, SIKE1, OTUD5, CASP10, DDX3Y, RNF125, ATG12, CYLD, IFIH1 |
Kegg: 05211 |
Renal cell carcinoma |
9 |
0.014533 |
PTPN11, PIK3CB, PAK4, PIK3R1, VHL, MAP2K2, PDGFB, AKT2, TCEB2 |
Kegg: 05220 |
Chronic myeloid leukemia |
9 |
0.017915 |
BAD, PTPN11, PIK3CB, RUNX1, PIK3R1, SHC1, MAP2K2, AKT2, CBLB |
Kegg: 05215 |
Prostate cancer |
10 |
0.018952 |
MTOR, BAD, CREB3L2, PIK3CB, PDGFD, CREB3, PIK3R1, MAP2K2, PDGFB, AKT2 |
Kegg: 05210 |
Colorectal cancer |
8 |
0.019385 |
MSH2, BAD, BIRC5, PIK3CB, MSH6, PIK3R1, BAX, AKT2 |
Kegg: 05214 |
Glioma |
8 |
0.020495 |
MTOR, PIK3CB, PRKCG, PIK3R1, SHC1, MAP2K2, PDGFB, AKT2 |
Kegg: 00030 |
Pentose phosphate pathway |
5 |
0.020611 |
PGLS, G6PD, TKTL1, RPE, PGD |
Kegg: 03020 |
RNA polymerase |
5 |
0.022375 |
POLR1A, POLR3B, POLR2E, POLR2K, POLR3F |
Kegg: 04062 |
Chemokine signaling pathway |
16 |
0.022417 |
CXCL6, STAT1, XCL2, XCL1, TIAM1, PIK3CB, CXCR5, GNG3, PIK3R1, SHC1, PRKX, CCR5, |
Kegg: 05145 |
Toxoplasmosis |
12 |
0.02264 |
BAD, STAT1, PIK3CB, LAMA2, CD40, BIRC3, HLA-DOB, IRAK1, PIK3R1, LAMC3, CCR5, AKT2 |
Kegg: 04650 |
Natural killer cell mediated cytotoxicity |
12 |
0.024279 |
PTPN11, KLRK1, HLA-A, PIK3CB, NFATC3, PRKCG, SH2D1A, FASLG, KLRD1, PIK3R1, |
Kegg: 04350 |
TGF-beta signaling pathway |
9 |
0.027483 |
RPS6KB1, PPP2R1B, PPP2CB, PPP2R1A, BMP8B, RPS6KB2, CUL1, ACVR2A, E2F4 |
Kegg: 05218 |
Melanoma |
8 |
0.030816 |
BAD, PIK3CB, PDGFD, PIK3R1, MAP2K2, FGF11, PDGFB, AKT2 |
Kegg: 04510 |
Focal adhesion |
16 |
0.031225 |
BAD, ITGA4, PIK3CB, ACTG1, LAMA2, PDGFD, PRKCG, BIRC3, PAK4, ITGA10, PIK3R1, SHC1, |
Kegg: 04310 |
Wnt signaling pathway |
13 |
0.033068 |
WNT10A, NFATC3, PRKCG, PRICKLE1, CACYBP, PPP2R1B, CSNK2A1, PPP2CB, PPP2R1A, |
SCO: small-cell osteosarcoma; FDR: false discovery rate; No.: number of genes in pathway.
The regulatory network of miRNA target genes in SCO
The target-genes of dysregulated miRNAs in SCO were predicted based on the miRWalk database. Genes that were both differentially expressed and targets of dysregulated miRNAs were candidates to construct the miRNA-mRNA network. Specifically, 1334 miRNA-target gene pairs with reverse correlation retrieved by the miRWalk database, including 1076 pairs of up-regulated miRNAs and 93 pairs of down-regulated miRNAs, were used to construct the miRNA-mRNA regulatory network and visualized using the Cytoscape software (Figure 2). The target-genes of 8 miRNAs, including hsa-miR-548j-3p, hsa-miR-6859-5p, hsa-miR-1307-3p, hsa-miR-6868-3p, hsa-miR-580-5p, hsa-miR-6802-3p, hsa-miR-7850-5p and hsa-miR-6842-5p, were not available in the miRWalk database. In the network, the up-regulated miRNAs hsa-miR-26b-5p, hsa-miR-1-1-3p and hsa-miR-548e-3p, exhibited the highest connectivity with target-genes and regulated 197, 162 and 141 target-genes, respectively. Moreover, the down-regulated miRNAs hsa-miR-222-3p, hsa-miR-1260b and hsa-miR-221-3p exhibited the highest connectivity to target genes and regulated 23, 19 and 18 target-genes, respectively (Figure 2).
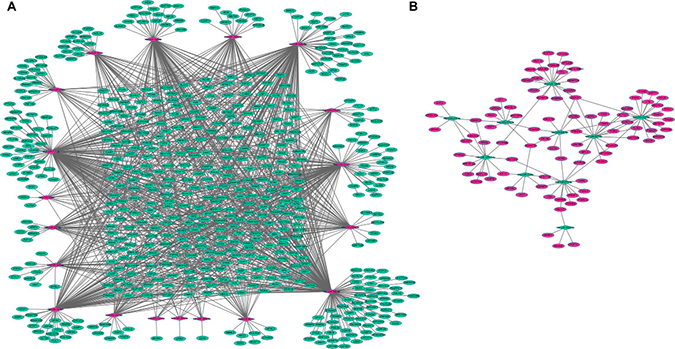
Figure 2: miRNA-mRNA interaction network in SCO. (A): Interaction network between up-regulated miRNAs and down-regulated mRNAs; (B): interaction network between down-regulated miRNAs and up-regulated mRNAs. Circular nodes represented mRNAs, and diamond nodes represented miRNAs. Green and red colors represented down-regulation and up-regulation, respectively. Solid lines indicated interaction associations between miRNAs and mRNAs.
Verification of the expression level of dysregulated genes in tumor tissues and peripheral blood samples from patients with SCO
To verify the RNA-seq data, the expression levels of differentially expressed miRNAs and mRNAs in tumor tissues and peripheral blood samples from patients with SCO were quantified by qRT-PCR. As shown in Figure 3A–3C, hsa-miR-221-5p, hsa-miR-26b-5p and hsa-miR-21-5p were significantly up-regulated in both tumor tissues and peripheral blood samples from patients with SCO. The expression of miR-5706 was significantly up-regulated in peripheral blood samples from patients with SCO patients with healthy individuals, but its expression did not significantly differ between SCO tumors and adjacent non-tumor tissues (Figure 3D). As shown in Figure 3E and 3F, miR-656-3p and RIF1 were significantly down-regulated in both tumor tissues and peripheral blood samples from patients with SCO, whereas FAM89A was significantly up-regulated in peripheral blood samples from patients with SCO compared with healthy individuals, but its expression did not significantly differ between SCO tumors and adjacent non-tumor tissues (Figure 3G). In general, qRT-PCR data were consistent with our bioinformatics analyses.
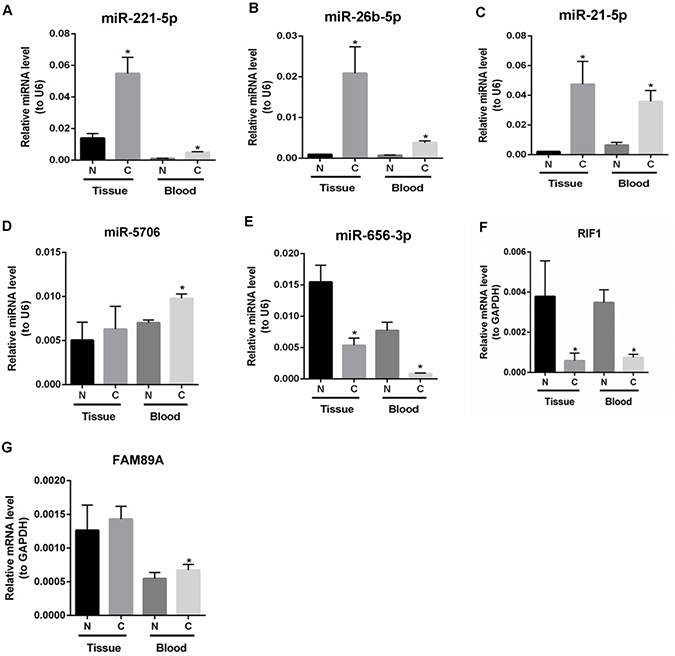
Figure 3: The expression levels of candidate mRNAs and miRNAs in peripheral blood samples and tumor tissues from patients with SCO were verified by qRT-PCR. (A): hsa-miR-221-5p; (B): hsa-miR-26b-5p; (C): hsa-miR-21-5p; (D): hsa-miR-5706; (E): hsa-miR-656-3p; (F): RIF1; (G): FAM89A. Blood N: peripheral blood samples of healthy individuals; Blood C: peripheral blood samples of patients with SCO; Tissue N: adjacent non-tumor tissues of SCO patients; Tissue C: SCO tumor tissues. At least three independent experiments were performed for the statistical evaluation.
DISCUSSION
miRNAs are endogenous, small non-coding RNAs that participate in the regulation of diverse cellular processes, including cell growth, cell differentiation, apoptosis and the immune response, by binding to the 3’ untranslated region of certain subsets of messenger RNAs. A growing body of evidence demonstrates that the abnormal expression of miRNAs might serve as a potential diagnostic and prognostic biomarker for cancers [14].
In our study, the mRNA and miRNA expression profiles of peripheral blood samples from patients with SCO were obtained via RNA sequencing. Dysregulated mRNAs and miRNAs were identified in silico, and the expression levels of candidate mRNAs and miRNAs in both tumor tissues and peripheral blood samples from patients with SCO were verified by qRT-PCR. In general, the expression status of candidate mRNAs and miRNAs in peripheral blood samples of SCO patients were consistent with our bioinformatics analysis based on the expression profiling of PBMCs of SCO patients. Moreover, the expression levels of candidate mRNAs and miRNAs were also detected in SCO tumor tissues and adjacent non-tumor tissues. qRT-PCR results of candidate mRNAs and miRNAs had the similarity expression status in tumor tissues of OS patients based on bioinformatics analyses.
hsa-miR-26b-5p was significantly up-regulated in the PBMCs from patients with SCO compared to healthy control patients. In the miRNA-target gene interaction network, miR-26b-5p exhibited the highest connectivity with miRNAs and regulated the expression of 197 target-genes. Specifically, miR-26b-5p is reportedly down-regulated in OS tissue and cells [15, 16] and inhibits OS cell proliferation, migration, invasion and apoptosis by down-regulating the expression of PFKFB3 [15]. Moreover, miR-26b inhibits OS cell metastasis by suppressing the expression of CTGF and Smad1 [17]. Huaier (Trametes robiniophila murris) is a fungus used in traditional Chinese medicine and suppresses cell proliferation and induces apoptosis in human lung cancer cells by up-regulating miR-26b-5p [18]. miR-26b plays important roles in the proliferation and metastasis of various cancer types, such as epithelial ovarian carcinoma, hepatocellular carcinoma and prostate cancer [19–21]. FASLG is one of top 20 down-regulated genes in SCO and targeted by miR-26b. Moreover, FASLG encodes Fas ligand, which is a member of tumor necrosis factor superfamily. FAS then triggers cell apoptosis by binding to FASLG. The FAS/FASLG signaling pathway is essential for immune system regulation, including activation-induced T cell death and cytotoxic T lymphocyte-induced cell death. In our study, miR-26b-5p was up-regulated in the PBMCs of patients with SCO and targeted FASLG, which may play a key role in the immune response to SCO.
Furthermore, hsa-miR-221-3p was significantly down-regulated in the PBMCs from patients with SCO. In the miRNA-mRNA regulatory network, miRNA-221 exhibited high connectivity with several mRNAs and targeted 18 mRNAs, and the expression levels of miR-221 in tumor tissue, cell lines and the sera from patients with OS are reportedly dramatically up-regulated. Thus, serum miR-221 may serve as a diagnostic and prognostic marker for OS [22, 23]. Moreover, miR-221 enhances the proliferation, invasion and migration of OS cells by suppressing PTEN expression [22]. TIMP3 is one of top 20 up-regulated genes in SCO and targeted by miR-221. TIMP3 encodes TIMP metallopeptidase inhibitor 3, an inhibitor of matrix metalloproteinases, which are involved in the degradation of the extracellular matrix. TIMP3 is hypermethylated in OS tumor tissues compared with normal tissues [24] and has been identified as a tumor suppressor that plays essential roles in the inhibition of tumor angiogenesis. The down-regulation of miR-221/222 significantly increases the expression of TIMP3 and enhances the sensitivity of breast cancer cells to tamoxifen [25]. TIMP3 expression also predicts favorable survival in HCC [26]. In our study, miR-221-3p was down-regulated and targeted TIMP3 in the PBMCs of patients with SCO, which suggested that miR-221-3p and TIMP3 play essential roles in the immune response to SCO.
hsa-miR-125b-2-3p is one of the top 2 significantly down-regulated miRNAs and targeted 13 mRNAs, including PTGFRN (one of the top 20 up-regulated mRNAs) in the miRNA-mRNA regulatory network of SCO. PTGFRN encodes prostaglandin F2 receptor inhibitor, and the expression of PTGFRN correlates with the metastatic status of human OS [27]. However, the biological functions of miR-125b-2-3p and PTGFRN are unclear and need to be elucidated.
Pathways in cancer, mTOR signaling and oxidative phosphorylation were significantly enriched in the KEGG pathway analysis of dysregulated mRNAs identified in the PBMCs of patients with SCO compared to healthy individuals. Dysregulated pathways in cancer contribute to aberrant cell growth, cell death and cell motility in various cancer types, including colorectal cancer, pancreatic cancer, glioma, basal cell carcinoma, renal cell carcinoma, prostate cancer and melanoma [28, 29]. Moreover, a series of articles report that abnormal mTOR signaling plays key roles in OS tumorigenesis and therapy [30], and arsenic sulfide promotes cell apoptosis and autophagy by suppressing Akt/mTOR signaling in OS [31]. In addition, cucurbitacin E also inhibits OS cell growth and invasion by suppressing PI3K/AKT/mTOR signaling [32], whereas a lack of oxidative phosphorylation prevents cell apoptosis in colorectal cancer and OS. Accordingly, PSB-603 (A2b adenosine receptor antagonist) increases colorectal cancer cell death by promoting oxidative phosphorylation and ROS production [33]. A lack of oxidative phosphorylation also decreases susceptibility to apoptosis in OS [34]. In addition, cell cycle, apoptosis, and DNA replication pathways were significantly enriched in our study. Based on the aforementioned studies, the identified abnormally expressed mRNAs might play vital roles in OS tumorigenesis by regulating these enriched KEGG pathways.
The expression levels of candidate miRNAs and mRNAs in peripheral blood samples from patients with SCO were verified by qRT-PCR. In general, the qRT-PCR results were consistent with the RNA sequencing and bioinformatics analyses. However, our study was also subject to limitations. First, the SCO tumor sample size for the RNA sequencing and qRT-PCR validation analyses were small due to the rarity of SCO. Second, the expression levels of candidate miRNAs contradicted previously published results. Thus, the biological roles of these miRNAs need to be explored in vivo and in vitro to elucidate their roles in the tumorigenesis of SCO.
In conclusion, we constructed an miRNA-mRNA regulatory network by identifying miRNAs and target genes that are differentially expressed in the PBMCs of patients with SCO compared to healthy individuals. In this regulatory network, hsa-miR-26b-5p, hsa-miR-221-3p and hsa-miR-125b-2-3p were significantly dysregulated and exhibited high connectivity with target genes. Thus, these miRNAs may play essential roles in the initiation and development of SCO, but their biological roles in SCO tumorigenesis require further exploration. Moreover, a clinical study based on a large cohort of patients with SCO is essential to validate the diagnostic value of these miRNAs.
MATERIALS AND METHODS
Sample isolation and characterization
Thirteen patients treated at the Third Affiliated Hospital of Kunming Medical University hospital, including 3 patients with SCO and 10 healthy control individuals, were enrolled in our study. Ten milliliters of peripheral blood was obtained from each of patients, and PMBCs were isolated. The total RNA was then extracted from the PMBCs using TRIzol reagent (Invitrogen, Carlsbad, CA, USA). Our study was approved by the Third Affiliated Hospital of Kunming Medical University hospital, and informed written consent was obtained from all patients. Our study was conducted in accordance with the Declaration of Helsinki.
Transcriptome library preparation and sequencing
The Illumina TruSeq RNA sample Prep Kit (Illumina, Inc., San Diego, CA, USA) was used to prepare the mRNA library according to the manufacturer’s protocol. Oligo(dT) beads were used to isolate polyA mRNA from total RNA, and the mRNA was cleaved into short fragments for random hexamer priming to synthesize first-strand cDNA, followed by the second-strand cDNA synthesis and end repair. Next, the short fragments were connected with sequencing adapters. After PCR amplification, the enriched cDNA libraries were sequenced using an Illumina HiSeq 2500 (Illumina, Inc., San Diego, CA, USA). For miRNA sequencing, the miRNAs were isolated, and adapters were added. The library was constructed by using TruSeq Small RNA Library Preparation Kits (Illumina, Inc., San Diego, CA, USA).
Data analyses
The raw RNA-sequencing reads were stored in FASTQ format. The raw reads containing adapter sequences and low-quality sequences (reads with ambiguous bases ‘N’) were removed using FASTx-tool SeqPrep (https://github.com/jstjohn/SeqPrep) and Sickle (https://github.com/najoshi/sickle). Clean reads were aligned with the UCSC human reference genome (build hg19) using TopHat v1.3.1 [35]. Sequences were matched to miRNAs using the miRDeep2 tool and miRBase (release 21) (http://www.mirbase.org/). Aligned read files were then processed by Cufflinks v1.2.1 [36], which measured the relative expression of the genes with the normalized RNA-Seq fragment counts. Fragments per kilobase of exon model per million mapped reads (FPKM) were used to present the expression level of gene. The transcripts differentially expressed in SCO were identified, and P-values < 0.05 and < 0.01 indicated differentially expressed mRNA and miRNA, respectively.
Functional annotation of differentially expressed genes
The biological roles of differentially expressed genes were predicted using the GeneCoDis3 (http://genecodis.cnb.csic.es/analysis) database to describe the gene ontology (GO) and Kyoto encyclopedia of genes and genomes (KEGG) pathways [37, 38]. An FDR < 0.05 was set as the cut-off for selecting significantly enriched GO terms and KEGG pathway.
Construction of miRNA-target gene network
The target-genes of differentially expressed miRNAs were predicted using the miRWalk database (http://www.umm.uni-heidelberg.de/apps/zmf/mirwalk/), in which the correlations between target-genes and miRNAs have been experimentally confirmed in vivo and in vitro [39]. We used 6 algorithms, RNA22, miRanda, miRDB, miRWalk, PICTAR2 and TargetScan, to predict the target-genes of miRNAs; if more than 4 of 6 algorithms predicted the same gene for an miRNA, the gene was identified as a target-gene of that miRNA [39]. The interaction network of differentially expressed miRNAs and target-genes were constructed using the Cytoscape software (http://cytoscape.org) [40].
Quantitative real-time polymerase chain reaction (qRT-PCR)
To validate the expression levels of dysregulated genes in SCO, tumor tissues and peripheral blood samples were obtained from other 3 patients with SCO and 3 healthy individuals. Total RNA was extracted from tissues samples and peripheral blood samples using TRIzol reagent (Invitrogen, CA, USA) according to the manual instructions. The ReverTra Ace qPCR RT Master Mix Kit (TOYOBO, Shanghai, China) was used to synthesize cDNA, and qRT-PCR reactions were performed using SYBR® FAST qPCR Kits (KAPA bio, Boston, USA) on a LightCycler 480 (Roche Indianapolis, IN, USA). U6 and GAPDH were used as internal controls for miRNA and mRNA detection, respectively. The relative expression levels of target genes were calculated using ΔCT method, and the mean ± standard deviation and independent samples t-test were used in the statistical analysis. P < 0.05 was considered significant. The PCR primers used are shown in Supplementary Table 1.
Authors’ contributions
L. X. and Z. Yang designed the experiments; L. X., M. R., Z. Yuan and Y. L. collected the patient information; S. Y., Y. Zhou, Y. Z, Y. Yang and D. L. searched the literature; L. X., Z. Yang and M. R. analyzed the data; L. X., Z. Yang, L. S. and F. H. wrote the manuscript; and all authors reviewed the manuscript.
ACKNOWLEDGMENTS
This research was supported, in part, by grants from the National Natural Science Foundation of China (No.81560471),the Joint Special Funds for the Department of Science and Technology of Yunnan Province-Kunming Medical University (No. 2014FB059), the Scientific Research Projects from Internal Research Institutions of Medical and Health Units in Yunnan Province (Nos. 2014NS013, 2014NS014, 2014NS015 and 2014NS016), Foundation of the Yunnan Provincial Innovative Team of Bone and Soft Tissue Tumor (No. 2015HC026), Foundation of the Young and Middle-aged Academic and Technical Leaders of Yunnan Province (No. 2014HB034).
CONFLICTS OF INTEREST
All authors declare that they have no conflicts of interest.
REFERENCES
1. Shi R, Li J, Tang F, Luo YI, Tu CQ. Identification and functional study of osteosarcoma metastasis marker genes. Oncol Lett. 2015; 10:1848–52. doi: 10.3892/ol.2015.3444.
2. Ta HT, Dass CR, Choong PF, Dunstan DE. Osteosarcoma treatment: state of the art. Cancer Metastasis Rev. 2009; 28:247–63. doi: 10.1007/s10555-009-9186-7.
3. Roy R, Yang J, Moses MA. Matrix metalloproteinases as novel biomarkers and potential therapeutic targets in human cancer. J Clin Oncol. 2009; 27:5287–97. doi: 10.1200/jco.2009.23.5556.
4. Bielack SS, Kempf-Bielack B, Delling G, Exner GU, Flege S, Helmke K, Kotz R, Salzer-Kuntschik M, Werner M, Winkelmann W, Zoubek A, Jurgens H, Winkler K. Prognostic factors in high-grade osteosarcoma of the extremities or trunk: an analysis of 1,702 patients treated on neoadjuvant cooperative osteosarcoma study group protocols. J Clin Oncol. 2002; 20:776–90.
5. Bishop JA, Shum CH, Sheth S, Wakely PE, Ali SZ. Small Cell Osteosarcoma Cytopathologic Characteristics and Differential Diagnosis. American journal of clinical pathology. 2010; 133:756–61.
6. Uma K, Cherian G, Nayak V, Patil S. Small cell osteosarcoma of the mandible: Case report and review of its diagnostic aspects. J Oral Maxillofac Pathol. 2011; 15:330.
7. Agarwal S, Gahlot GP, Bhalla A, Bakhshi S. Small cell osteosarcoma of the parietal region: a unique case at an unusual site. BMJ Case Rep. 2015; 2015. doi: 10.1136/bcr-2015-210086.
8. Miao J, Wu S, Peng Z, Tania M, Zhang C. MicroRNAs in osteosarcoma: diagnostic and therapeutic aspects. Tumour Biol. 2013; 34:2093–8. doi: 10.1007/s13277-013-0940-7.
9. Mirghasemi A, Taheriazam A, Karbasy SH, Torkaman A, Shakeri M, Yahaghi E, Mokarizadeh A. Down-regulation of miR-133a and miR-539 are associated with unfavorable prognosis in patients suffering from osteosarcoma. Cancer Cell Int. 2015; 15: 86. doi: 10.1186/s12935-015-0237-6.
10. Bao Y, Chen B, Wu Q, Hu K, Xi X, Zhu W, Zhong X, Chen J. Overexpression of miR-664 is associated with enhanced osteosarcoma cell migration and invasion ability via targeting SOX7. Clin Exp Med. 2017; 17:51–58. doi: 10.1007/s10238-015-0398-6.
11. Chen B, Bao Y, Chen X, Yi J, Liu S, Fang Z, Zheng S, Chen J. Mir-664 promotes osteosarcoma cells proliferation via downregulating of FOXO4. Biomed Pharmacother. 2015; 75:1–7. doi: 10.1016/j.biopha.2015.08.012.
12. Song K, Liu N, Yang Y, Qiu X. Regulation of osteosarcoma cell invasion through osteopontin modification by miR-4262. Tumour Biol. 2016; 37:6493–99. doi: 10.1007/s13277-015-4530-8.
13. Taheriazam A, Bahador R, Karbasy SH, Jamshidi SM, Torkaman A, Yahaghi E, Shakeri M. Down-regulation of microRNA-26a and up-regulation of microRNA-27a contributes to aggressive progression of human osteosarcoma. Diagn Pathol. 2015; 10: 166. doi: 10.1186/s13000-015-0400-3.
14. Cekaite L, Eide PW, Lind GE, Skotheim RI, Lothe RA. MicroRNAs as growth regulators, their function and biomarker status in colorectal cancer. Oncotarget. 2016; 7:6476–505. doi: 10.18632/oncotarget.6390.
15. Zheng WD, Zhou FL, Lin N. MicroRNA-26b inhibits osteosarcoma cell migration and invasion by down-regulating PFKFB3 expression. Genet Mol Res. 2015; 14:16872–9. doi: 10.4238/2015.December.14.14.
16. Du JY, Wang LF, Wang Q, Yu LD. miR-26b inhibits proliferation, migration, invasion and apoptosis induction via the downregulation of 6-phosphofructo-2-kinase/fructose-2,6-bisphosphatase-3 driven glycolysis in osteosarcoma cells. Oncol Rep. 2015; 33:1890–8. doi: 10.3892/or.2015.3797.
17. Duan G, Ren C, Zhang Y, Feng S. MicroRNA-26b inhibits metastasis of osteosarcoma via targeting CTGF and Smad1. Tumour Biol. 2015; 36:6201–9. doi: 10.1007/s13277-015-3305-6.
18. Wu T, Chen W, Liu S, Lu H, Wang H, Kong D, Huang X, Kong Q, Ning Y, Lu Z. Huaier suppresses proliferation and induces apoptosis in human pulmonary cancer cells via upregulation of miR-26b-5p. FEBS Lett. 2014; 588:2107–14. doi: 10.1016/j.febslet.2014.04.044.
19. Lin J, Zhang L, Huang H, Huang Y, Huang L, Wang J, Huang S, He L, Zhou Y, Jia W, Yun J, Luo R, Zheng M. MiR-26b/KPNA2 axis inhibits epithelial ovarian carcinoma proliferation and metastasis through downregulating OCT4. Oncotarget. 2015; 6:23793–806. doi: 10.18632/oncotarget.4363.
20. Li H, Sun Q, Han B, Yu X, Hu B, Hu S. MiR-26b inhibits hepatocellular carcinoma cell proliferation, migration, and invasion by targeting EphA2. Int J Clin Exp Pathol. 2015; 8:4782–90.
21. Kato M, Goto Y, Matsushita R, Kurozumi A, Fukumoto I, Nishikawa R, Sakamoto S, Enokida H, Nakagawa M, Ichikawa T, Seki N. MicroRNA-26a/b directly regulate La-related protein 1 and inhibit cancer cell invasion in prostate cancer. Int J Oncol. 2015; 47:710–8. doi: 10.3892/ijo.2015.3043.
22. Zhu J, Liu F, Wu Q, Liu X. miR-221 increases osteosarcoma cell proliferation, invasion and migration partly through the downregulation of PTEN. Int J Mol Med. 2015; 36:1377–83. doi: 10.3892/ijmm.2015.2352.
23. Yang Z, Zhang Y, Zhang X, Zhang M, Liu H, Zhang S, Qi B, Sun X. Serum microRNA-221 functions as a potential diagnostic and prognostic marker for patients with osteosarcoma. Biomed Pharmacother. 2015; 75:153–8. doi: 10.1016/j.biopha.2015.07.018.
24. Hou P, Ji M, Yang B, Chen Z, Qiu J, Shi X, Lu Z. Quantitative analysis of promoter hypermethylation in multiple genes in osteosarcoma. Cancer. 2006; 106:1602–9. doi: 10.1002/cncr.21762.
25. Gan R, Yang Y, Yang X, Zhao L, Lu J, Meng QH. Downregulation of miR-221/222 enhances sensitivity of breast cancer cells to tamoxifen through upregulation of TIMP3. Cancer Gene Ther. 2014; 21:290–6. doi: 10.1038/cgt.2014.29.
26. Gu X, Fu M, Ding Y, Ni H, Zhang W, Zhu Y, Tang X, Xiong L, Li J, Qiu L, Xu J, Zhu J. TIMP-3 expression associates with malignant behaviors and predicts favorable survival in HCC. PLoS One. 2014; 9: e106161. doi: 10.1371/journal.pone.0106161.
27. Guilmain W, Colin S, Legrand E, Vannier JP, Steverlynck C, Bongaerts M, Vasse M, Al-Mahmood S. CD9P-1 expression correlates with the metastatic status of lung cancer, and a truncated form of CD9P-1, GS-168AT2, inhibits in vivo tumour growth. Br J Cancer. 2011; 104:496–504. doi: 10.1038/sj.bjc.6606033.
28. Driehuis E, Clevers H. WNT signaling events near the cell membrane and their pharmacological targeting for the treatment of cancer. Br J Pharmacol. 2017 Feb 28. doi: 10.1111/bph.13758. [Epub ahead of print].
29. Rahmani F, Avan A. Role of Wnt/beta-catenin Signaling Regulatory microRNAs in the Pathogenesis of Colorectal Cancer. 2017. doi: 10.1002/jcp.25897.
30. Hu K, Dai HB, Qiu ZL. mTOR signaling in osteosarcoma: Oncogenesis and therapeutic aspects (Review). Oncol Rep. 2016; 36:1219–25. doi: 10.3892/or.2016.4922.
31. Wang G, Zhang T, Sun W, Wang H, Yin F, Wang Z, Zuo D, Sun M, Zhou Z, Lin B, Xu J, Hua Y, Li H, Cai Z. Arsenic sulfide induces apoptosis and autophagy through the activation of ROS/JNK and suppression of Akt/mTOR signaling pathways in osteosarcoma. Free Radic Biol Med. 2017; 106:24–37. doi: 10.1016/j.freeradbiomed.2017.02.015.
32. Wang Y, Sun Y, Wu Y, Zhang J. Cucurbitacin E inhibits osteosarcoma cells proliferation and invasion through attenuation of PI3K/AKT/mTOR signaling. Biosci Rep. 2016 Sep 21. doi: 10.1042/bsr20160165. [Epub ahead of print].
33. Molck C, Ryall J, Failla LM, Coates JL, Pascussi JM, Heath JK, Stewart G, Hollande F. The A2b adenosine receptor antagonist PSB-603 promotes oxidative phosphorylation and ROS production in colorectal cancer cells via adenosine receptor-independent mechanism. Cancer Lett. 2016; 383:135–43. doi: 10.1016/j.canlet.2016.09.018.
34. Dey R, Moraes CT. Lack of oxidative phosphorylation and low mitochondrial membrane potential decrease susceptibility to apoptosis and do not modulate the protective effect of Bcl-x(L) in osteosarcoma cells. J Biol Chem. 2000; 275:7087–94.
35. Trapnell C, Pachter L, Salzberg SL. TopHat: discovering splice junctions with RNA-Seq. Bioinformatics. 2009; 25:1105–11. doi: 10.1093/bioinformatics/btp120.
36. Roberts A, Trapnell C, Donaghey J, Rinn JL, Pachter L. Improving RNA-Seq expression estimates by correcting for fragment bias. Genome Biol. 2011; 12: R22. doi: 10.1186/gb-2011-12-3-r22.
37. Kanehisa M. The KEGG database. Novartis Found Symp. 2002; 247:91–101. discussion -3, 19-28, 244-52.
38. Carmona-Saez P, Chagoyen M, Tirado F, Carazo JM, Pascual-Montano A. GENECODIS: a web-based tool for finding significant concurrent annotations in gene lists. Genome biology. 2007; 8: R3.
39. Dweep H, Sticht C, Pandey P, Gretz N. miRWalk–database: prediction of possible miRNA binding sites by “walking” the genes of three genomes. Journal of biomedical informatics. 2011; 44:839–47.
40. Shannon P, Markiel A, Ozier O, Baliga NS, Wang JT, Ramage D, Amin N, Schwikowski B, Ideker T. Cytoscape: a software environment for integrated models of biomolecular interaction networks. Genome Res. 2003; 13:2498–504. doi: 10.1101/gr.1239303.