
INTRODUCTION
As a new system of diallelic genetic marker, insertion/deletion (Indel) polymorphism, also called DIP, has recently been used in forensic sciences and population genetic studies. Due to the simple construction, Indels can be amplified to small amplicons and even degraded DNA samples can be analyzed accurately. Also, Indels have low mutation rates [1, 2]. Additionally, the genotyping method of Indels is similar to that of STRs comprising polymerase chain reaction (PCR) and capillary electrophoresis (CE) and easily achieved in forensic biology laboratories. In our study, InDels are diallelic markers which show 2 different alleles (+ or -), the number of InDel alleles is much less than those of STRs (for instance, D5S818 locus, allele 7, 8, 9, 10, 11, 12, 13 and 14). As a result, the forensic parameters of InDels, like discrimination power (DP), are lower than those of STRs with the calculation formula, [3]. We could infer that the DP values are increased with the more alleles through integral theorem which was employed to make the explanation more comprehensive and objective. Therefore, Indels could be utilized as complement markers to improve the efficiency of existing genetic markers in personal identification and paternity testing. After Weber et al. reported human diallelic Indel polymorphisms for the first time [4], Indels have also drawn much attention in the biogeogarphic field 5–7]. For multiplex amplification of 30 Indel loci plus a sex-determining locus Amelogenin, Qiagen Investigator DIPplex kit (Qiagen, Hilden, Germany) which has recently been made commercially available was employed in our study [8].
According to the 6th nationwide population census of the People’s Republic of China, Bai, with 1,933,510 people, ranks the 15th of the 56 ethnic groups (http://www.stats.gov.cn/tjsj/pcsj/rkpc/6rp/indexce.htm). Approximately 80% of Bai people live in concentrated communities distributed in the Dali Bai Autonomous Prefecture in Yunnan Province, southwest China. Archaeological findings indicated that the history of Bais could be traced back to the Neolithic Age. Bai’s language originated from Sino-Tibetan language family. The language of Bai maintains lots of Han words due to the Bais' long-term cultural contact with Han, the largest Chinese ethnic group. Bai ethnic group became a member of China, preserving their own the science and culture, since the Western Han Dynasty (109 BC) [9].
In this research, we obtained population data and forensic parameters of 30 Indels in the Bai ethnic group, and then analyzed the genetic differentiation between the Bai ethnic group and other populations.
RESULTS
Linkage disequilibrium analysis
The results of LD (linkage disequilibrium) were shown on the form of an inverted triangle (Figure 1). As shown by the red arrow, the pairwise LD between the locus HLD6 and the rest 29 loci were arranged in the left bottom (29 square grids). The others were performed so on. No red color area embraced with thick black curve was observed in the linkage disequilibrium graph.
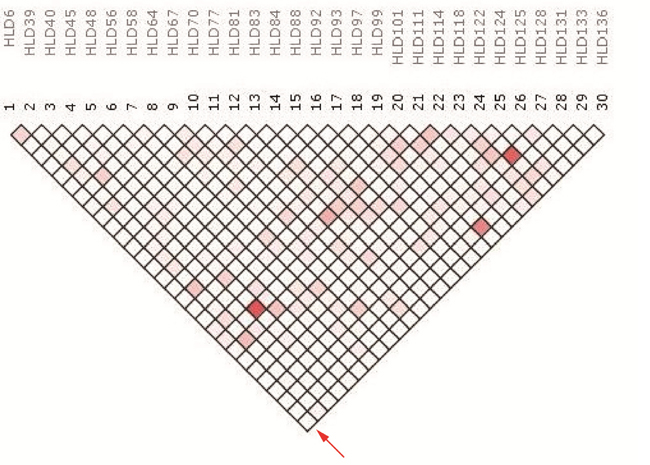
Figure 1: The LD analysis schema between the 30 Indel loci utilizing the SNPAnalyzer 2.0 program.
Forensic parameters
The allele frequencies and forensic statistical parameters of the 30 Indel loci in Chinese Bai ethnic group were exhibited in Table 1, and the detailed Indel genotypes were shown in Supplementary Table 1. The HWE (Hardy-Weinberg equilibrium) tests showed the p value below 0.05 at HLD56 (Table 1). Therefore we used the validation analysis by program HWE (version 1.10) [10] observed three p values below 0.05 at HLD56, HLD81, and HLD118 loci, respectively. And these two independent analysts with high efficiency analyzed the HWE tests of 30 InDels in Bai ethnic group. After the Bonferroni correction (significance level, 0.0017), no deviations from HWE tests were observed at the 30 Indel loci of the Bai group. The observed heterozygosity (Ho) values ranged from 0.1520 at HLD118 locus to 0.5680 at HLD131 locus, while the expected heterozygosity (He) ranged from 0.1927 at HLD118 locus to 0.4997 at HLD136 locus, and the polymorphic information content (PIC) ranged from 0.1741 at HLD118 locus to 0.3749 at HLD136 locus. We found the highest power of exclusion (PE) (0.2542) at HLD131 locus and the lowest PE (0.0181) at HLD118 locus. The DP values of selected loci were in the range from 0.3100 (HLD118) to 0.6533 (HLD56). The highest value of typical paternity index (TPI) was 1.1574 (HLD131) and the lowest was 0.5896 (HLD118).
Table 1: Allele frequency distribution and forensic statistical parameters of the 30 Indel loci in Chinese Bai ethnic group (n=125)
HLD |
rs# |
DIP- |
DIP+ |
Ho |
He |
p |
TPI |
PIC |
PE |
DP |
|---|---|---|---|---|---|---|---|---|---|---|
6 |
1610905 |
0.5200 |
0.4800 |
0.4640 |
0.4992 |
0.4054 |
0.9328 |
0.3746 |
0.1579 |
0.6403 |
39 |
17878444 |
0.8320 |
0.1680 |
0.3040 |
0.2796 |
0.5617 |
0.7184 |
0.2405 |
0.0652 |
0.4449 |
40 |
2307956 |
0.3840 |
0.6160 |
0.4000 |
0.4731 |
0.0932 |
0.8333 |
0.3612 |
0.1139 |
0.6331 |
45 |
2307959 |
0.3920 |
0.6080 |
0.4640 |
0.4767 |
0.7441 |
0.9328 |
0.3631 |
0.1579 |
0.6177 |
48 |
28369942 |
0.6360 |
0.3640 |
0.4560 |
0.4630 |
0.8424 |
0.9191 |
0.3558 |
0.1518 |
0.6071 |
56 |
2308292 |
0.4360 |
0.5640 |
0.3920 |
0.4918 |
0.0228 |
0.8224 |
0.3709 |
0.1091 |
0.6533 |
58 |
1610937 |
0.6160 |
0.3840 |
0.4800 |
0.4731 |
0.9107 |
0.9615 |
0.3612 |
0.1706 |
0.6075 |
64 |
1610935 |
0.1320 |
0.8680 |
0.2160 |
0.2292 |
0.7085 |
0.6378 |
0.2029 |
0.0343 |
0.3752 |
67 |
1305056 |
0.3280 |
0.6720 |
0.4320 |
0.4408 |
0.8114 |
0.8803 |
0.3437 |
0.1346 |
0.5929 |
70 |
2307652 |
0.3560 |
0.6440 |
0.4560 |
0.4585 |
0.9219 |
0.9191 |
0.3534 |
0.1518 |
0.6026 |
77 |
1611048 |
0.5600 |
0.4400 |
0.5280 |
0.4928 |
0.4576 |
1.0593 |
0.3714 |
0.2132 |
0.6026 |
81 |
17879936 |
0.1400 |
0.8600 |
0.1840 |
0.2408 |
0.1314 |
0.6127 |
0.2118 |
0.0256 |
0.3740 |
83 |
2308072 |
0.6200 |
0.3800 |
0.5520 |
0.4712 |
0.0772 |
1.1161 |
0.3602 |
0.2372 |
0.5661 |
84 |
3081400 |
0.3000 |
0.7000 |
0.3760 |
0.4200 |
0.3010 |
0.8013 |
0.3318 |
0.1000 |
0.5839 |
88 |
8190570 |
0.4720 |
0.5280 |
0.5120 |
0.4984 |
0.7959 |
1.0246 |
0.3742 |
0.1982 |
0.6172 |
92 |
17174476 |
0.5360 |
0.4640 |
0.4480 |
0.4974 |
0.2504 |
0.9058 |
0.3737 |
0.1459 |
0.6444 |
93 |
2307570 |
0.4600 |
0.5400 |
0.4240 |
0.4968 |
0.0944 |
0.8681 |
0.3734 |
0.1292 |
0.6511 |
97 |
17238892 |
0.6840 |
0.3160 |
0.3920 |
0.4323 |
0.3431 |
0.8224 |
0.3389 |
0.1091 |
0.5938 |
99 |
2308163 |
0.2000 |
0.8000 |
0.3040 |
0.3200 |
0.6790 |
0.7184 |
0.2688 |
0.0652 |
0.4854 |
101 |
2307433 |
0.5520 |
0.4480 |
0.4480 |
0.4946 |
0.2774 |
0.9058 |
0.3723 |
0.1459 |
0.6415 |
111 |
1305047 |
0.8880 |
0.1120 |
0.1920 |
0.1989 |
0.8293 |
0.6188 |
0.1791 |
0.0276 |
0.3356 |
114 |
2307581 |
0.8160 |
0.1840 |
0.3200 |
0.3003 |
0.6521 |
0.7353 |
0.2552 |
0.0721 |
0.4667 |
118 |
16438 |
0.1080 |
0.8920 |
0.1520 |
0.1927 |
0.2408 |
0.5896 |
0.1741 |
0.0181 |
0.3100 |
122 |
8178524 |
0.7600 |
0.2400 |
0.3680 |
0.3648 |
0.9679 |
0.7911 |
0.2983 |
0.0956 |
0.5297 |
124 |
6481 |
0.4640 |
0.5360 |
0.4800 |
0.4974 |
0.6643 |
0.9615 |
0.3737 |
0.1706 |
0.6318 |
125 |
16388 |
0.5480 |
0.4520 |
0.5360 |
0.4954 |
0.3878 |
1.0776 |
0.3727 |
0.2210 |
0.6004 |
128 |
2307924 |
0.7480 |
0.2520 |
0.3600 |
0.3770 |
0.6697 |
0.7813 |
0.3059 |
0.0914 |
0.5426 |
131 |
1611001 |
0.5720 |
0.4280 |
0.5680 |
0.4896 |
0.0875 |
1.1574 |
0.3698 |
0.2542 |
0.5737 |
133 |
2067235 |
0.6120 |
0.3880 |
0.5040 |
0.4749 |
0.5429 |
1.0081 |
0.3621 |
0.1910 |
0.5979 |
136 |
16363 |
0.4880 |
0.5120 |
0.4480 |
0.4997 |
0.2297 |
0.9058 |
0.3749 |
0.1459 |
0.6467 |
HLD, human locus deletion/insertion polymorphism; DIP-, frequency of short allele; DIP+, frequency of long allele; Ho, observed heterozygosity; He, expected heterozygosity; p, p-value for Hardy-Weinberg equilibrium; TPI, typical paternity index; PIC, polymorphic information content; PE, power of exclusion; DP, discrimination power.
Population structure
Together with 25 referenced populations i.e. Guangdong Han [11], Shanghai Han [12], Yi [13], Xibe [14], South Korean [15], She [16], Beijing Han, Tibetan, Kazak, Uyghur [17], Dane [18], Hungarian [19], Basque, Central Spanish [20], Uruguayan [21], Uyghur1, Zhuang, Dong, Miao, Chengdu Han, Tibetan1 [22], Henan Han, Beijing Han1, Uyghur2, Tibetan2 [23], the population structure of Bai ethnic group was performed by the structure program. In the determination of K value (Supplementary Figure 1), the results of L(K) showed that K=3, 4 depicted a plateau obviously. As the maximum value of Delta K was observed at K=3, it demonstrated that K=3 met the requirements as mentioned by Porras [24]. At K=3, the 26 populations were clarified into 3 geographic patterns clearly as shown in Figure 2. The 4 Eurasian groups (Uyghur, Uyghur1, Uyghur2, and Kazak), Uruguayan and 4 European populations were composed of nearly entire red component, by contrast, the 17 East Asian populations were composed of yellow, green, and red components by different proportions.
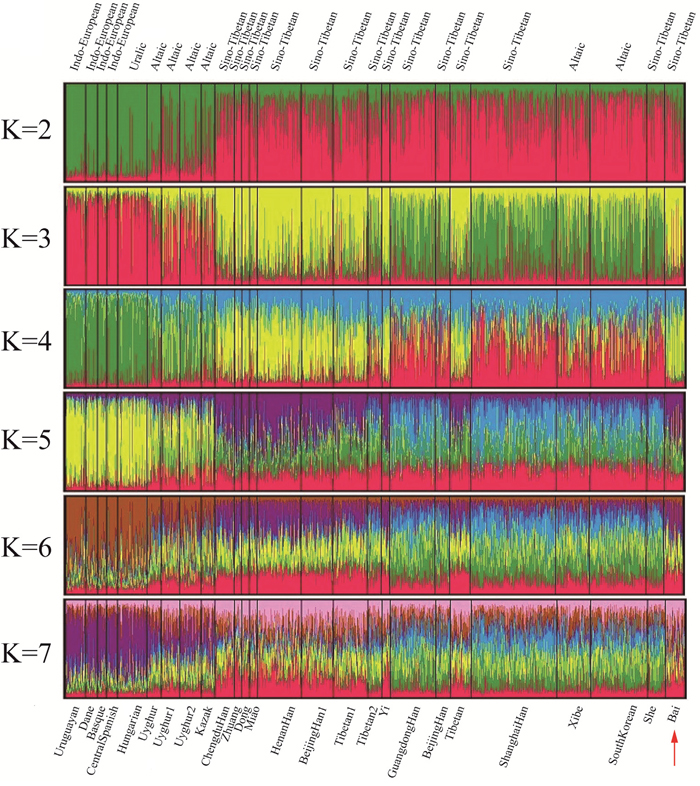
Figure 2: Clustering structure for the full-loci dataset assuming K= 2-7 of the Bai group with other groups. Population names were labeled beneath while language names on top.
Principal component analysis
In Figure 3, the allele frequencies of 30 Indel loci of the Bai ethnic group in the study along with referenced 25 populations were utilized to perform a PCA plot. As shown in Figure 3, the first component accounted for 55.40% and the second 22.19%. After aggregation, the two principle components occupied the 77.59% of total variance.
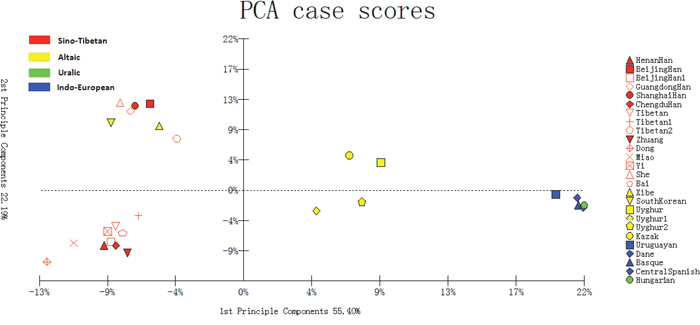
Figure 3: PCA analysis based on 30 Indel loci of the studied Bai group and referenced 25 groups.
Population differentiations
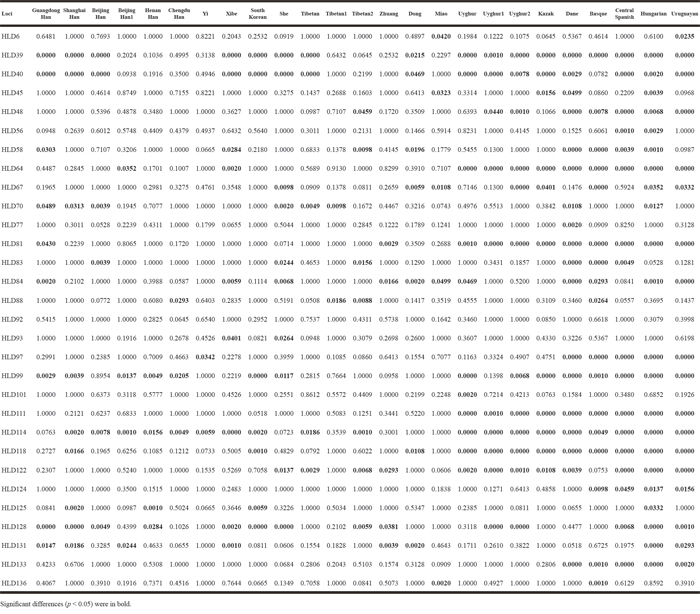
We employed the Analysis of molecular variance method to compare the studied Bai group with 25 reported populations mentioned above. The p values of Fst distances were shown in Table 2. The minimum and maximum numbers of significant difference observed at 30 loci were 2 (Bai and Yi, Bai and Tibetan1), and 22 (Bai and Hungarian), respectively. In Supplementary Table 2, we calculated the DA values among 26 populations, ranging from 0.0006 (Guangdong Han and Shanghai Han, Henan Han and Beijing Han1) to 0.0358 (Dong and Hungarian). Among Bai and other 25 reported populations, the minimum was 0.0012 (Bai and Tibetan1) whereas the maximum was 0.0238 (Bai and Basque).
Table 2: The p values of pairwise InDel loci between Chinese Bai group and referenced populations at 30 Indel loci
Phylogenetic reconstruction
To analyze the genetic background of Bai group, we drew a Neighbor Joining (NJ) Tree [25] based on the DA genetic distances (Supplementary Table 2). The NJ tree showed two main clusters (Figure 4). One comprised the Uyghur1 and 17 East Asian populations (She, Guangdong Han, Shanghai Han, Beijing Han, South Korean, Xibe, Tibetan, Tibetan2, Tibetan1, Bai, Yi, Henan Han, Beijing Han1, Chengdu Han, Zhuang, Miao and Dong populations). And the other was composed of the Kazak, Uyghur2, Uyghur, Uruguayan and other European groups (Dane, Hungarian, Basque, and Central Spanish).
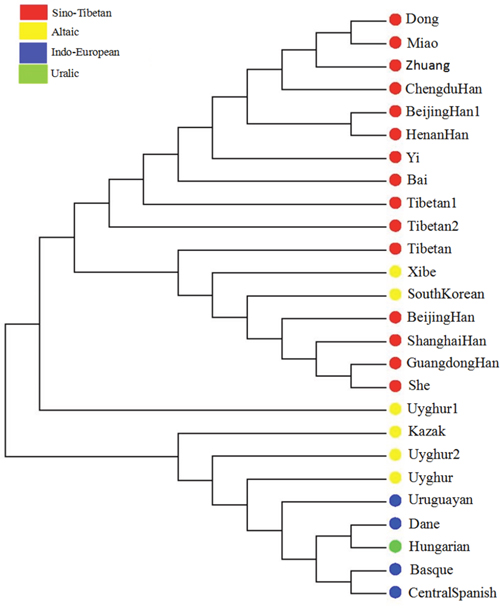
Figure 4: Phylogenetic tree constructed by the agglomerative clustering (Neighbor Joining) method based on the DA distances between the 26 groups.
DISCUSSION
Linkage disequilibrium analysis
If no relevance exists between two loci from the same chromosome or two random chromosomes, in other words, they are suitable for forensic applications as independent loci [26]. The LD analysis indicated no significant LD (r2< 0.8) among the 30 loci. We observed the LD analysis of studied Bai group and Chinese Yi group previously reported [27], those two studies obviously verified no linkage among 30 Indel loci, therefore, those loci could be used as independent markers for forensic and population genetic analysis.
Forensic parameters
In this research, the cumulative probability of exclusion (CPE) and combined discrimination power (CDP) were 0.9859 and 0.9999999999887, respectively. The CPE values were 0.9861, 0.9968, 0.9957, 0.9975, 0.9884, 0.9900 in the previously published Dong, Uyghur1 [22], Tibetan, Uyghur [17], Taiwanese, Poles [28], respectively. And we could observe that the CPE of 30 Indel loci in various populations changed within a narrow scope. Collectively, the CPE values using the kit were relatively lower and could not reach a high level of exclusion in forensic paternity cases compared to STR genetic markers [29, 30]. Nonetheless, the CDP values had the ability to provide considerable level of discrimination when the kit came to forensic identification cases. According to the formula calculating PIC [31], we established the PIC calculation model of diallelic markers: PIC=2p-4p2+4p3-2p4, p represented the frequency of random InDel allele (+ or -). PIC value was expected to range from 0 to 0.5. Accordingly, it indicated that the forensic parameter PIC would be less than 0.5 for diallelic genetic markers, for example InDels and SNPs [32], much lower than STRs [33]. To be concluded, we could utilize the kit as supplementary mean for forensic cases tested by autosomal STRs.
Population structure
Individuals of different populations far from each other (for example, Asian and European) always had diverse membership coefficient in deductive clusters. In the present study, at K=3, the 10 East Asian groups (Chengdu Han, Zhuang, Dong, Miao, Henan Han, Beijing Han1, Tibetan1, Yi, Tibetan, and Bai) were all constituted of different components by an uniform proportion, which indicated the Bai group’s similar membership to East Asian populations. Compared to the 17 East Asian groups, constructions of the 4 Eurasian groups (Uyghur, Uyghur1, Uyghur2, and Kazak) were more semblable with the Uruguayan and European groups [34]. Based on the instruction of structure program [35], the populations sharing similar structure were close in memberships. Therefore, through structure analysis on raw data of 30 Indel loci, the Bai ethnic group was homogeneous with other Asian groups.
Principal component analysis
As shown in Figure 3, the European groups and Uruguayan distributed in the right; Chinese 16 populations and South Korean in the left; Uyghur1, Kazak, Uyghur2, and Uyghur groups from China in the middle of them. The result of PCA corresponded with structure analysis and geographic location. The studied Bai group, together with Henan Han, Beijing Han1, Chengdu Han, Dong, Miao, Zhuang, Yi, Tibetan1 and Tibetan groups clustered in the lower left quadrant, which indicated their close genetic relationships.
Population differentiations
The values of DA genetic distance were consistent with the geographic locations of these populations. Supposing threshold value was 0.05, we could observe the significant differences between the Bai group and 25 referenced groups. Compared with East Asian groups and Eurasian groups, Central Spanish, Uruguayan, Dane, Basque and Hungarian groups were found had more differences with Bai group. Significant differences between the Bai group and all East Asian and Eurasian groups were found at less than 12 loci, whereas the Bai group and Uruguayan as well as European groups were more than 17 loci. For geographical concerns, the results corresponded with the geographic distribution of the 26 groups.
In the aspects of 30 loci, the highest ethnic diversity was found at HLD114 locus which reflected significant differences between the studied Bai group and other 19 groups. By contrast, no significant differences were observed at HLD92 locus between the Bai group and other 25 groups. Similar to STRs [36, 37], the ability of Indels to distinguish ethnic groups was at various levels. Along with more typing data of different populations at novel Indel loci, evolution in human history would be investigated comprehensively and detailedly.
Phylogenetic reconstruction
The results of the phylogenetic reconstruction were roughly in line with population differentiation. Previously, we had reported that Bai ethnic group was close to Southern Chinese Han, Changsha Han, and Guangdong Han populations within the scope of mitochondrial DNA [38]. It demonstrated that Bai ethnic group in Chinese Yunnan Province had multi origins, for example, Chinese Han groups, Yi group and Tibetan group, etc. In history, descents of different ethnic groups integrated into Yunnan Bai group including Diqiang system from Northern China, Pu system from Southern China and Chinese Han [39] (http://www.china.org.cn/e-groups/shaoshu/shao-2-bai.htm). Diqiang and Pu systems were both ancient nations in China dating back to 1000 BC. Ancient Diqiang was the origin of Tibetan, and ancient Pu was the origin of Dai, Blang, De’ang and Va ethnic minorities [40]. Hence, our study illustrated Bai ethnic group in Yunnan province was not only close to Chinese Han in relationship, but also integrated into the Tibetan and other ethnic groups. In summary, the inference focusing on the association between studied Bai group and Chinese Han population nationwide, Yi, Tibetan group and other ethnic groups was supported by the studies of population structure, principal component analysis, population differentiations, and phylogenetic reconstruction, which was consistent with population migration and cultural exchange in history. Studies on Bai ethnic group utilizing STR as genetic markers [41, 42] also indicated a close relationship between Bai group and Han populations nationwide.
MATERIALS AND METHODS
Samples and DNA extraction
We collected bloodstain samples from 125 unrelated healthy Bai individuals living in Dali Bai Autonomous Prefecture in Yunnan province with informed consent. In this study, donors should have ancestors living in Dali for over three generations and have no significant migration in their family history. The collection process follows the human and ethical research principles of Xi’an Jiaotong University Health Science Center, China. The Chelex-100 method was used to extract genomic DNA from bloodstain samples as described by Walsh [43].
PCR amplification and genotyping for InDels
In this study, we employed Investigator DIPplex kit for InDels genotyping including 30 InDel loci plus a sex-determining locus Amelogenin, which has been validated before [8, 44]. The PCR amplification conducted in a GeneAmp PCR System 9700 Thermal Cycler (Applied Biosystems, Foster City, CA, USA) in accordance with the manufacturer’s instruction. After that, the ABI 3130 Genetic Analyzer (Applied Biosystems, Foster City, CA, USA) was utilized to perform electrophoresis in the conditions described in the manufacturer’s recommendations. With the BTO 550 (Qiagen, Hilden, Germany) as internal lane standard, we could determine the fragment sizing. We used the GeneMapperID software v3.2 (Applied Biosystems, Foster City, CA, USA) to identify the alleles.
Quality control
The study was conducted following ISFG recommendations as Schneider described in the aspects of DNA polymorphisms [45].
Statistical analyses
The modified PowerStates (version 1.2) spreadsheet (Promega, Madison, WI, USA) was used to calculate the allele frequencies, forensic parameters and the exact chi-square test for the HWE of 30 InDels. The forensic parameters included Ho, PE, PIC, DP, and TPI. He values were calculated by the formula, [46]. We utilized the SNP Analyzer version 2.0 (Istech, South Korea) [47] to perform LD analysis. We estimated Fst and p values between pairwise populations by Arlequin (version 3.0) [48] to embody the variances in allele frequencies of different populations. To analyze the population structure, we used the Structure program (version 2.2) [49] to estimate the membership coefficients. The Ln Pr(X|K) [50] and Delta K [51] were calculated to determine the most appropriate K value. On the basis of allele frequencies, principal component analysis (PCA) was carried out in MATLAB 2007a (MathWorks Inc., USA). For phylogenetic reconstruction, we utilized the DA distance and employed phylogenetic analysis (DISPAN) program [52].
CONCLUSION
In conclusion, the combination of 30 Indel loci provided a relatively low level CPE (0.9859) and a high level of CDP (0.9999999999887). Research of population genetics on population structure, principal component analysis, population differentiations, and phylogenetic reconstruction of Bai group based on 30 Indel loci supplementally supported that the Bai group had close relationships with certain ethnic groups from China, for example Tibetan and Yi group, consistent with the analysis by STR markers and history migration. With more genotyping profiles of various ethnic groups, we could have a comprehensive understanding of population migration and ancestry origin in China.
ACKNOWLEDGMENTS
This project was supported by the National Natural Science Foundation of China (NSFC, No. 81525015, 81471824, 81373248). The authors are grateful to O. Garcia, H. Pamjav and M. Saiz for they provided their raw genotyping data.
CONFLICTS OF INTERESTS
No competing financial interests exist.
REFERENCES
1. Fondevila M, Phillips C, Santos C, Pereira R, Gusmao L, Carracedo A, Butler JM, Lareu MV, Vallone PM. Forensic performance of two insertion-deletion marker assays. International journal of legal medicine. 2012; 126:725-737.
2. LaRue BL, Lagace R, Chang CW, Holt A, Hennessy L, Ge J, King JL, Chakraborty R, Budowle B. Characterization of 114 insertion/deletion (INDEL) polymorphisms, and selection for a global INDEL panel for human identification. Legal medicine. 2014; 16:26-32.
3. Fisher RA. Standard calculations for evaluating a blood-group system. Heredity. 1951; 5:95-102.
4. Weber JL, David D, Heil J, Fan Y, Zhao C, Marth G. Human diallelic insertion/deletion polymorphisms. American journal of human genetics. 2002; 71:854-862.
5. Zaumsegel D, Rothschild MA, Schneider PM. A 21 marker insertion deletion polymorphism panel to study biogeographic ancestry. Forensic Sci Int-Gen. 2013; 7:305-312.
6. Pereira R, Phillips C, Pinto N, Santos C, dos Santos SEB, Amorim A, Carracedo A, Gusmao L. Straightforward Inference of Ancestry and Admixture Proportions through Ancestry-Informative Insertion Deletion Multiplexing. Plos One. 2012; 7:e29684.
7. Yang N, Li HZ, Criswell LA, Gregersen PK, Alarcon-Riquelme ME, Kittles R, Shigeta R, Silva G, Patel PI, Belmont JW, Seldin MF. Examination of ancestry and ethnic affiliation using highly informative diallelic DNA markers: application to diverse and admixed populations and implications for clinical epidemiology and forensic medicine. Hum Genet. 2005; 118:382-392.
8. LaRue BL, Ge J, King JL, Budowle B. A validation study of the Qiagen Investigator DIPplex(R) kit; an INDEL-based assay for human identification. International journal of legal medicine. 2012; 126:533-540.
9. Jin L, Chu, JY. The Genetic Diversity Study of the Chinese Nation. Shanghai Scientific & Technical Publishers. 2006; 4-5.
10. Ott J. Utility programs for analysis of genetic linkage, Program, HWE version 1.10. New York: Columbia University. 1988.
11. Hong L, Wang XG, Liu SJ, Zhang YM, Ou XL, Chen Y, Chen WH, Sun HY. Genetic polymorphisms of 30 indel loci in guangdong han population. J Sun Yat-sen Univ (Med Sci). 2013; 34.
12. Wang Z, Zhang S, Zhao S, Hu Z, Sun K, Li C. Population genetics of 30 insertion-deletion polymorphisms in two Chinese populations using Qiagen Investigator(R) DIPplex kit. Forensic science international Genetics. 2014; 11:e12-14.
13. Liang W, Zaumsegel D, Rothschild MA, Lv M, Zhang L, Li J, Liu F, Xiang J, Schneider PM. Genetic data for 30 insertion/deletion polymorphisms in six Chinese populations with Qiagen Investigator DIPplex Kit. Forensic Sci Int Genet Supplement. 2013; 4:2.
14. Meng HT, Zhang YD, Shen CM, Yuan GL, Yang CH, Jin R, Yan JW, Wang HD, Liu WJ, Jing H, Zhu BF. Genetic polymorphism analyses of 30 InDels in Chinese Xibe ethnic group and its population genetic differentiations with other groups. Scientific reports. 2015; 5:8260.
15. Seong KM, Park JH, Hyun YS, Kang PW, Choi DH, Han MS, Park KW, Chung KW. Population genetics of insertion-deletion polymorphisms in South Koreans using Investigator DIPplex kit. Forensic Sci Int Genet. 2014; 8:80–3.
16. Hu Z, Wang Z, Zhang SH, Zhao SM, Zhu RX, Sun K, Li CT. [Forensic application of 30 InDel loci in Han and She nationalities of Eastern China]. [Article in Chinese]. Fa Yi Xue Za Zhi. 2014; 30:337–41, 345.
17. Wei YL, Qin CJ, Dong H, Jia J, Li CX. A validation study of a multiplex INDEL assay for forensic use in four Chinese populations. Forensic science international Genetics. 2014; 9:e22-25.
18. Friis SL, Borsting C, Rockenbauer E, Poulsen L, Fredslund SF, Tomas C, Morling N. Typing of 30 insertion/deletions in Danes using the first commercial indel kit—Mentype(R) DIPplex. Forensic science international Genetics. 2012; 6:e72-74.
19. Kis Z, Zalan A, Volgyi A, Kozma Z, Domjan L, Pamjav H. Genome deletion and insertion polymorphisms (DIPs) in the Hungarian population. Forensic science international Genetics. 2012; 6:e125-126.
20. Martin P, Garcia O, Heinrichs B, Yurrebaso I, Aguirre A, Alonso A. Population genetic data of 30 autosomal indels in Central Spain and the Basque Country populations. Forensic science international Genetics. 2013; 7:e27-30.
21. Saiz M, Andre F, Pisano N, Sandberg N, Bertoni B, Pagano S. Allelic frequencies and statistical data from 30 INDEL loci in Uruguayan population. Forensic science international Genetics. 2014; 9:e27-29.
22. Wang L, Lv M, Zaumsegel D, Zhang L, Liu F, Xiang J, Li J, Schneider PM, Liang W, Zhang L. A comparative study of insertion/deletion polymorphisms applied among Southwest, South and Northwest Chinese populations using Investigator((R)) DIPplex. Forensic science international Genetics. 2016; 21:10-14.
23. Shi M, Liu Y, Bai R, Jiang L, Lv X, Ma S. Population data of 30 insertion-deletion markers in four Chinese populations. International journal of legal medicine. 2015; 129:53-56.
24. Porras-Hurtado L, Ruiz Y, Santos C, Phillips C, Carracedo A, Lareu MV. An overview of STRUCTURE: applications, parameter settings, and supporting software. Frontiers in genetics. 2013; 4:98.
25. Saitou N, Nei M. The neighbor-joining method: a new method for reconstructing phylogenetic trees. Molecular biology and evolution. 1987; 4:406-425.
26. Ott J. Analysis of Human Genetic Linkage, 3rd edition. Johns Hopkins University Press, Baltimore, MD, USA. 1999.
27. Zhang YD, Shen CM, Jin R, Li YN, Wang B, Ma LX, Meng HT, Yan JW, Dan Wang H, Yang ZL, Zhu BF. Forensic evaluation and population genetic study of 30 insertion/deletion polymorphisms in a Chinese Yi group. Electrophoresis. 2015; 36:1196-1201.
28. Pepinski W, Abreu-Glowacka M, Koralewska-Kordel M, Michalak E, Kordel K, Niemcunowicz-Janica A, Szeremeta M, Konarzewska M. Population genetics of 30 INDELs in populations of Poland and Taiwan. Mol Biol Rep. 2013; 40:4333-4338.
29. Faris JS, Tanzillo-Swarts A. Allele frequencies of 15 autosomal STR loci in the Caymanian population. International journal of legal medicine. 2015; 129:465-466.
30. Huang YM, Wang J, Jiao Z, Yang L, Zhang X, Tang H, Liu Y. Assessment of application value of 19 autosomal short tandem repeat loci of GoldenEye 20A kit in forensic paternity testing. International journal of legal medicine. 2013; 127:587-590.
31. Botstein D, White RL, Skolnick M, Davis RW. Construction of a genetic linkage map in man using restriction fragment length polymorphisms. American journal of human genetics. 1980; 32:314–31.
32. Gimode D, Odeny DA, de Villiers EP, Wanyonyi S, Dida MM, Mneney EE, Muchugi A, Machuka J, de Villiers SM. Identification of SNP and SSR Markers in Finger Millet Using Next Generation Sequencing Technologies. PLoS One. 2016; 11:e0159437.
33. Li XZ, Liu J, Shi YF, Ju D, Zhang Y, Yue TF. Genetic polymorphisms of loci D18S53, D18S59, and D18S488 in fetuses from a Chinese Tianjin Han population. Genet Mol Res. 2016; 15.
34. Jia J, Wei YL, Qin CJ, Hu L, Wan LH, Li CX. Developing a novel panel of genome-wide ancestry informative markers for bio-geographical ancestry estimates. Forensic science international Genetics. 2014; 8:187-194.
35. Pritchard JK, Wen X, Falush D. Documentation for structure software: Version 2. 2003.
36. Bai R, Zhang Z, Liang Q, Lu D, Yuan L, Yang X, Shi M. Haplotype diversity of 17 Y-STR loci in a Chinese Han population sample from Shanxi Province, Northern China. Forensic science international Genetics. 2013; 7:214-216.
37. Liu WJ, Pu HW, Yang CH, Meng HT, Zhang YD, Zhang LP, Yan JW, Wang HD, Ren JW, Sun JY, Liu C, Wang H, Zhu BF. 24 Y-chromosomal STR haplotypic polymorphisms for Chinese Uygur ethnic group and its phylogenic analysis with other Chinese groups. Electrophoresis. 2015; 36:626-632.
38. Chen F, Yin CY, Qian XQ, Fan HT, Deng YJ, Zhang YD, Meng HT, Shen CM, Yang CH, Jin R, Zhu BF, Xu P. Single nucleotide polymorphisms of mitochondrial DNA HVS-I and HVS-II in Chinese Bai ethnic group. Electrophoresis. 2015; 36:930-936.
39. Liu J, Wang Z. Brief On the Origin, Deposits and Changes of the Three Great Clans: Di Qiang, Bai Yue and Bai Pu (From the Pre-Qin Days to the Northern and Southern Dynasties A.D.420-589). Journal of Yunnan Agricultural University. 2007; 1:3.
40. He GY. Di qiang origins of history. Jiangxi Education Press, Nanchang, Jiangxi, China. 2000.
41. Li Y, Hong Y, Li X, Yang J, Li L, Huang Y, Wang C, Li H, Xu B. Allele frequency of 19 autosomal STR loci in the Bai population from the southwestern region of mainland China. Electrophoresis. 2015; 36:2498-2503.
42. Shen CM, Wang HD, Liu WJ, Fan SL, Yang G, Qin HX, Xie T, Li SB, Yan JW, Zhu BF. Allelic polymorphic investigation of 21 autosomal short tandem repeat loci in a Chinese Bai ethnic group. Legal medicine. 2013; 15:109-113.
43. Walsh PS, Metzger DA, Higuchi R. Chelex 100 as a medium for simple extraction of DNA for PCR-based typing from forensic material. Biotechniques. 1991; 10:8.
44. Klein R, Neumann C, Roy R. Detection of insertion/deletion polymorphisms from challenged samples using the Investigator DIPplex(R) kit. Forensic science international Genetics. 2015; 16:29-37.
45. Schneider PM. Scientific standards for studies in forensic genetics. Forensic science international. 2007; 165:238-243.
46. Nei M. Estimation Of Average Heterozygosity And Genetic Distance From a Small Number Of Individuals. Genetics. 1978; 89:583-590.
47. Yoo J, Lee Y, Kim Y, Rha SY, Kim Y. SNPAnalyzer 2.0: a web-based integrated workbench for linkage disequilibrium analysis and association analysis. BMC bioinformatics. 2008; 9:290.
48. Excoffier L, Laval G, Schneider S. Arlequin (version 3.0): An integrated software package for population genetics data analysis. Evol Bioinform. 2005; 1:47-50.
49. Pritchard JK, Stephens M, Donnelly P. Inference of population structure using multilocus genotype data. Genetics. 2000; 155:945-959.
50. Earl DA, Vonholdt BM. STRUCTURE HARVESTER: a website and program for visualizing STRUCTURE output and implementing the Evanno method. Conservation Genetics Resources. 2012; 4:3.
51. Evanno G, Regnaut S, Goudet J. Detecting the number of clusters of individuals using the software STRUCTURE: a simulation study. Mol Ecol. 2005; 14:2611-2620.
52. Ota T. DISPAN: genetic distance and phylogenetic analysis. Pennsylvania State Univ. 1993.