
INTRODUCTION
Post-transcriptional modifications (PTCM) of RNA plays a paramount role for the metabolism processes of RNAs, such as for their splicing export, immune tolerance, and transcription [1–3]. So far, more than 100 distinct PTCMs have been identified in tRNAs, rRNAs, Mt-tRNAs, miRNAs, lincRNAs, miscRNAs, protein-coding genes, pseudogenes, etc. [1]. Among these modifications, the methylation of the 5-methylcytosine (m5C) is an epigenetic one [4] formed by the action of RNA methyltransferases [5] (Figure 1). The m5C modification is well investigated in DNA, but the corresponding studies in cellular RNA were mainly confined to tRNA and rRNA [6].
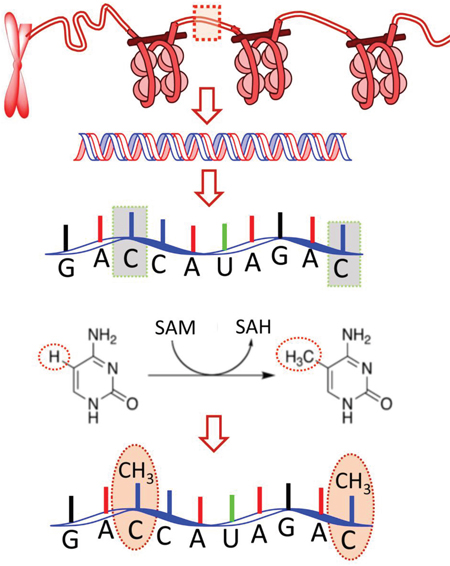
Figure 1: Schematic drawing to show the m5C modification in RNA: an important post-transcriptional modification (PTCM) in RNA [4, 5]. During the modification process, a methyl group is attached to the 5th atom of the 6-atom ring. SAM and SAH are the abbreviations of S-adenosylmethionine and S-adenosylhomocysteine, respectively. The former is the source of the methyl group; while the latter, the byproduct.
Actually, the m5C modification site in RNA has various biological functions, including the one that can regulate RNA metabolism in both eukaryotes and prokaryotes [7]. Furthermore, it plays a key role in yeast cell fate decision [4]. It is also significant for animal (such as mouse) and human embryonic development [1].
Although many efforts have been made by using biological experiments to determine the m5C sites in RNA (see, e.g. [2, 3]), it is time-consuming and expensive to completely rely on the experimental approaches alone. Facing today’s explosive growth of uncharacterized RNA sequences, it is highly demanded to develop computational approach to help getting the information.
Very recently, in a pioneering study, Feng et al. [8] proposed an interesting method to identify RNA m5C sites via the powerful PseKNC approach [9–11]. But no web-server has been provided for their method, and hence its practical application value is quite limited. In view of this, the present study was initiated to fill such an empty area.
RESULTS AND DISCUSSION
A predictor called “iRNAm5C-PseDNC” has been established. The success rates achieved by it on the benchmark dataset constructed based on experimental servations (Supplementary Information 1) are
(1)
where the definitions for the metrics Sn, Sp, Acc, and MCC are given in Eq.13 of the MATERIALS AND DISCUSSION section later.
Since it is the first web-server predictor ever developed for identifying the m5C sites in RNA sequences, it is not possible to demonstrate its power by comparing with its counterparts for exactly the same purpose. Nevertheless, we can indirectly show its power via a cohort of the anticipated success rates (Table 1) reported from the five powerful web-server predictors in genome and proteome analyses [12] [13–16]. As we can see from the table, the iRNAm5C-PseDNC is with the highest score for Acc (see column 3), and the same is true for MCC (column 4), indicating the proposed predictor is not only high in overall accuracy but also quite stable.
Table 1: A cohort comparison with some existing web-server predictors for different purposes
Predictor’s name |
Purpose |
Acca |
MCCa |
Sna |
Spa |
|---|---|---|---|---|---|
iRSpot-PseDNCb |
DNA recombination spot |
0.8204 |
0.6380 |
0.7306 |
0.8949 |
iSNO-PseAACc |
Cysteine S-nitrosylation site |
0.6762 |
0.3515 |
0.6701 |
0.6815 |
iPro54-PseKNCd |
Sigma-54 promoter |
0.8043 |
0.6101 |
0.7702 |
0.8385 |
iRSpot-TNCPseAACe |
DNA recombination spot |
0.8372 |
0.6710 |
0.8714 |
0.7959 |
iNitro-Tyrf |
Nitrotyrosine site |
0.8452 |
0.4905 |
0.8176 |
0.8598 |
iRNAm5C-PseDNCg |
RNA 5-methylcytosine site |
0.9237 |
0.7935 |
0.6989 |
0.9986 |
a See Eq.13 for the definition.
b See ref. [12].
c See ref. [13].
d See ref. [14].
e See ref. [15].
f See ref. [16].
g The web-server predictor developed in this paper.
Also, it is instructive to point out that, among the four metrics in Eq.13, the most important are the Acc and MCC. The metrics Sn and Sp are used to measure a predictor from two completely opposite angles, and they are actually constrained with each other [17]. Therefore, it is meaningless to use only one of the two for comparison [18]. When, and only when, both Sn and Sp of the predictor A are higher than those of the predictor B, can we say A is better than B. In other words, a meaningful comparison in this regard should count the scores of both Sn and Sp, or even better, the rate of their combination that is none but the score of MCC [19, 20].
Now, let us use graphic analysis to further show the proposed predictor’s quality. Graphs are a useful vehicle for studying complicated biological systems because they can provide intuitive insights, as demonstrated by a series of previous studies (see, e.g., [21–28]). To provide an intuitive illustration, the graph of Receiver Operating Characteristic (ROC) [29, 30] was adopted as given in Figure 2, where the green line is the ROC for iRNAm5C-PseDNC. The area under the ROC curve is called the AUC (area under the curve). Being within the region of 0 and 1, the greater the AUC is, the better the predictor would be. For the current predictor, the AUC is 0.9626, which is very close to 1, the value for a perfect predictor.
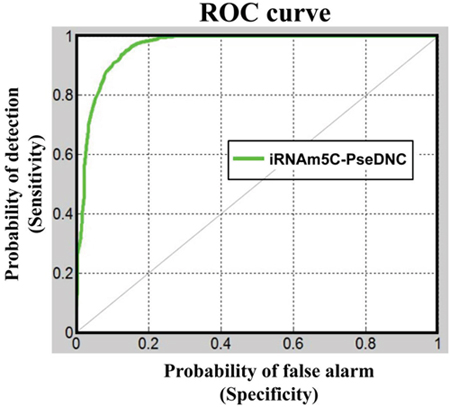
Figure 2: A graphical illustration to show the proposed predictor’s performances via the ROC (receiver operating characteristic) curves [29, 30]. The area under the ROC curve is called AUC (area under the curve). The greater the AUC value is, the better the performance will be. See the text for further explanation.
As shown in a series of recent publications (see, e.g., [18, 19, 31–43]), papers with a user-friendly and publicly accessible web-server will significantly enhance their impacts; this is particularly true for those papers that were aimed at developing various prediction methods [44, 45]. In view of this, the web-server for iRNAm5C-PseDNC has been established at http://www.jci-bioinfo.cn/iRNAm5C-PseDNC. Furthermore, to maximize users’ convenience, a step-to-step guide of how to use it is given in Supplementary Information 2.
MATERIALS AND METHODS
As practiced in a series of recent studies [19, 20, 35-37, 39-41, 46-53] in complying with the 5-step rule proposed in [54], to establish a really useful sequence-based predictor for a biological system, one should make the following five steps very clear: (1) how to construct or select a valid benchmark dataset to train and test the predictor; (2) how to formulate the biological sequence samples with an effective mathematical expression that can truly reflect their essential correlation with the target concerned; (3) how to introduce or develop a powerful algorithm (or engine) to run the prediction; (4) how to properly conduct cross-validation tests to objectively evaluate the anticipated accuracy; (5>) how to provide a web-server and user guide to make people very easily to get their desired results. In the rest of this paper, we are to address these point-by-point.
Benchmark dataset
To make the description simpler and cleaner, the Chou’s sequential scheme, which had been used by many previous investigators for analyzing the enzyme specificity [55], signal peptide cleavage sites [56], nitrotyrosine sites [16, 57], hydroxyproline or hydroxylysine sites [50, 58], methylation sites [34, 39, 59], protein-protein interaction [32], protein-protein binding sites [60, 61], carbonylation sites [48], and phosphorylation sites [51], was adopted in this study. According to Chou’s scheme, a potential RNA m5C modificationsite sample can be generally expressed by
(2)
where the center symbol denotes the single nucleic acid code cytosine (C), the subscript is an integer, represents the -th upstream nucleotide from the center, the denotes the -th downstream nucleotide, and so forth. The -tuple RNA sample can be further classified into the following two categories:
(3)
where represents a true sample with C at its center, a false one with C at its center, and the symbol means “a member of” in the set theory.
In literature the benchmark dataset usually consists of a training dataset and a testing dataset: the former is for training a model, while the latter for testing it. But as elucidated in a comprehensive review [62], there is no need to artificially separate a benchmark dataset into the two parts if the prediction model is tested by the jackknife or subsampling (K-fold) cross-validation because the outcome thus obtained is actually from a combination of many different independent dataset tests. Thus, the benchmark dataset for the current study can be formulated as
(4)
where the positive and negative subsets, and , only contain the true and false m5C samples, and , respectively (see Eq.3); while denotes the symbol of “union” in the set theory [62].
The benchmark dataset used in this study was derived from RMBase [1], which is a resource for decoding the landscape of RNA modifications from high-throughput sequencing data. The detailed procedures are as follows. (1) The genomic sequences downloaded from RMBase [63] are in the form of DNA; to make the entire description of this paper in a coherent manner, we first change the code T to U for all the genomic sequences taken from RMBase and make them become RNA sequences. (2) As done in [64], by sliding the -tuple nucleotide window along each of the RNA sequences thus obtained, collected were only those RNA segments with at the center. (3) If the upstream or downstream in a RNA sequence was less than ξ or greater than where L is the length of the RNA sequence concerned, the lacking code was filled with the same code of its nearest neighbor. (4) The RNA segment samples thus obtained were put into the positive subset if their centers were experimentally annotated as the sites; otherwise, into the negative subset . (5) To reduce redundancy and bias, none of included RNA segments had pairwise sequence identity with any other in a same subset. By strictly following the above procedures, we obtained an array of benchmark datasets with different values, and hence different lengths of RNA samples as well (see Eq.2), as illustrated below
(5)
But it was observed via preliminary tests that when (i.e., the RNA samples formed by 41 nucleotides), the corresponding results were most promising. In other words, we observed a turning point for the success rates at . After this point, the success rates would become going down with the increase of such parameter. Accordingly, hereafter we only consider the 41-tuple nucleotide samples without explicitly mentioning the parameter any more.
The benchmark dataset thus obtained is given in Supplementary Information 1, which can also be downloaded at http://www.jci-bioinfo.cn/iRNAm5C/Supp-S1.pdf. It contains 1,900 RNA samples, of which 475 belong to the positive subset and 1,425 to the negative subset .
Sample formulation
An RNA samples in the aforementioned benchmark dataset can be generally expressed as
(6)
where represents the 1st nucleotide of the RNA sample at its sequence position 1, the 2nd nucleotide at its position 2, and so forth. Except for , they can be any of the four nucleotides; i.e.,
(7)
Based on the sequential model of Eq.6, one could directly utilize BLAST to perform statistical analysis. Unfortunately, this kind of straightforward and intuitive approach failed to work when a query RNA sample did not have significant similarity to any of the character-known RNA sequences. To overcome this problem, investigators have shifted their focus to the discrete or vector model. The reason of doing so is also due to the fact that nearly all the existing machine-learning aorithms can be directly used to handle vector models but not sequences, as elaborated in [45].
One of the well-known vector models for DNA/RNA sequences is the k-tuple nucleotide (or k-mers) composition; i.e.,
(8)
where represents the normalized occurrence frequency of the i-th k-mer, and the symbol T is the transpose operator.
When , Eq.8 reduces to
(9)
where , , and are the normalized occurrence frequencies of adenine, cytosine, thymine, and uracil in the RNA sequence, respectively.
When , Eq.8 reduces to
(10)
where is the normalized occurrence frequencies of AA in the RNA sequence, is that AC, is that AG, is that AU, and so forth.
As we can see from above, the vector’s dimension will rapidly increase with the k value, causing the so-called “high-dimension disaster” [65] or overfitting problem. This will significantly reduce the deviation tolerance or cluster-tolerant capacity [66], and make the prediction model contain a lot of noise and very unstable.
Therefore, the k-mers approach is useful only when the value of k is very small. In other words, it can only be used to incorporate the local or short-range or local sequence-order information, but certainly not the long-range or global sequence-order information. To approximately cover the long-range sequence-order effects, one popular and well-known method is to use the pseudo components that were originally introduced in dealing with protein/peptide sequences [67–73] and recently extended to deal with DNA/RNA sequences [9-11, 34, 74-80].
According to the concept of pseudo components, the RNA sequence can be generally formulated by [11, 54]
(11)
where the subscript is integer and its value as well as the components will depend on how to extract the desired information from the RNA sequence of Eq.6.
In this study, we used the approach called “physical-chemical property matrix combined with auto/cross-covariance” proposed by Liu et al. [39] to define the components in Eq.7. According to that approach, the vector components in Eq.7 are given by
(12)
where is an integer within the range from 0 to 39. Using exactly the same calculation approach as elaborated in [39], we found that was optimal choice for the current study. As for how to calculate the concrete values in Eq.12, see ref. [39] where a crystal clear description had been given and hence there is no need to repeat here.
Random forest algorithm
Being a powerful algorithm, the random forest (RF) has been increasingly used to analyze various different problems in computational biology (see, e.g. [32, 36, 37, 40, 48, 50-52, 60, 61, 81-84]). The essence of RF is to compare each individual classifier as a tree, and the combination of many such classifiers as a forest. In this study, 100 trees were used for the forest, and dimension of the random subspace was 22. Each tree in the forest is trained with different part of the benchmark dataset, and hence may yield a different result. The final outcome is determined via a vote from all the trees. For more information about RF, see [85] where a very detailed description has been given, and hence there is no need to repeat here.
The final predictor obtained via the aforementioned procedures is called as iRNAm5C-PseDNC, where “i” stands for “identify”, and “RNAm5C” for “RNA 5-methylcytosine modification sites”, and “PseDNC” for “pseudo dinucleotide composition”.
Test procedure
One of the important procedures [54] in developing a new prediction method is how to objectively evaluate its anticipated success rate [54]. To address this, we need to consider two issues. (1) What metrics should be used to quantitatively reflect the predictor’s quality? (2) What kind of test approach should be utilized to score the metrics?
Metrics formulation
The following metrics are generally used to measure the prediction quality from four different angles: (1) Acc for measuring the overall accuracy of a predictor, (2) MCC for its stability, (3) Sn for its sensitivity, and (4) Sp for its specificity [86]. Unfortunately, their conventional formulations as given in [86] lack intuitiveness and most experimental scientists feel difficult to understand them, particularly for the MCC. Interestingly, using the Chou’s symbols introduced in studying signal peptides [56], Xu et al. [13] and Chen et al. [12] converted them into a set of four intuitive equations, as given by
(13)
where represents the total number of the true m5C sites investigated, while is the number of the true m5C sites incorrectly predicted to be of false m5C site; is the total number of the false m5C sites investigated, while is the number of the false m5C sites incorrectly predicted to be of true m5C site.
According to Eq.13, it is crystal clear to see the following. When meaning none of the true m5C sites are incorrectly predicted to be of false m5C site, we have the sensitivity . When meaning that all the true m5C sites are incorrectly predicted to be of false m5C site, we have the sensitivity . Likewise, when meaning none of the false m5C sites are incorrectly predicted to be of m5C site, we have the specificity ; whereas meaning that all the false m5C sites are incorrectly predicted to be of true m5C sites, we have the specificity . When meaning that none of true m5C sites in the positive dataset and none of the false m5C sites in the negative dataset are incorrectly predicted, we have the overall accuracy and ; when and meaning that all the true m5C sites in the positive dataset and all the false m5C sites in the negative dataset are incorrectly predicted, we have the overall accuracy and ; whereas when and we have and meaning no better than random guess. Therefore, Eq.13 has made the meanings of sensitivity, specificity, overall accuracy, and stability much more intuitive and easier-to-understand, particularly for the meaning of MCC, as concurred recently by many investigators (see, e.g., [18, 20, 31-35, 47-52, 60, 75-77, 84, 87-92]).
Note that, however, the set of equations defined in Eq.13 is valid only for the single-label systems. For the multi-label systems whose emergence has become more frequent in system biology [93–95] and system medicine [96] or biomedicine [40], a completely different set of metrics are needed as elaborated in [97].
Test method
Now let us discuss what kind of test method should be used to score the four metrics in Eq.13. In statistical analysis, the following three methods are often used to test a predictor: (1) independent dataset test, (2) subsampling (or K-fold cross-validation) test, and (3) jackknife test [98]. Of these three, however, the jackknife test is deemed the least arbitrary that can always yield a unique outcome for a given benchmark dataset as elucidated in [54]. Accordingly, the jackknife test has been widely recognized and increasingly used by investigators to examine the quality of various predictors (see, e.g., [15, 99–108]).
Accordingly, here we also used the jackknife test to check the quality of iRNAm5C-PseDNC predictor. During the jackknifing process, both the training dataset and testing dataset are actually open, and each sample will be in turn moved between the two. The jackknife test can exclude the “memory” effect. Also, the arbitrariness problem [54] rooted in the independent dataset and subsampling tests can be completely avoided because the outcome obtained by the jackknife cross-validation is always unique for a given benchmark dataset.
ACKNOWLEDGMENTS
The authors wish to thank the five anonymous reviewers for their constructive comments, which were very helpful for strengthening the presentation of this study. This work was partially supported by the National Nature Science Foundation of China (Nos. 61261027, 61300139, 31560316), the scholarship award of the State Scholarship Fund (No.201508360047), the Graduated Innovation Fund of the Jingdezhen Ceramic Institute (JYC201521). The funders had no role in study design, data collection and analysis, decision to publish, or preparation of the manuscript.
CONFLICTS OF INTEREST
The authors declare no conflicts of interest.
REFERENCES
1. Sun WJ, Li JH, Liu S, Wu J, Zhou H, Qu LH, Yang JH. RMBase: a resource for decoding the landscape of RNA modifications from high-throughput sequencing data. Nucleic Acids Research. 2015; 44:D259-D265.
2. Gu XR, Gustafsson C, Ku J, Yu M, Santi DV. Identification of the 16S rRNA m5C967 methyltransferase from Escherichia coli. Biochemistry. 1999; 38:4053-4057.
3. Liu Y, Santi DV. m5C RNA and m5C DNA methyl transferases use different cysteine residues as catalysts. Proceedings of the National Academy of Sciences of the United States of America. 2000; 97:8263-8265.
4. Motorin Y, Grosjean H. Multisite-specific tRNA:m5C-methyltransferase (Trm4) in yeast Saccharomyces cerevisiae: identification of the gene and substrate specificity of the enzyme. RNA. 1999; 5:1105-1118.
5. Motorin Y, Lyko F, Helm M. 5-methylcytosine in RNA: detection, enzymatic formation and biological functions. Nucleic Acids Res. 2010; 38:1415-1430.
6. Squires JE, Patel HR, Nousch M, Sibbritt T, Humphreys DT, Parker BJ, Suter CM, Preiss T. Widespread occurrence of 5-methylcytosine in human coding and non-coding RNA. Nucleic Acids Res. 2012; 40:5023-5033.
7. Burgess AL, David R, Searle IR. Conservation of tRNA and rRNA 5-methylcytosine in the kingdom Plantae. Bmc Plant Biology. 2015; 15:1-17.
8. Feng P, Ding H, Chen W, Lin H. Identifying RNA 5-methylcytosine sites via pseudo nucleotide compositions. Mol Biosyst. 2016; 12:3307-3311.
9. Chen W, Lei TY, Jin DC, Lin H. PseKNC: a flexible web-server for generating pseudo K-tuple nucleotide composition. Anal Biochem. 2014; 456:53-60.
10. Chen W, Zhang X, Brooker J, Lin H. PseKNC-General: a cross-platform package for generating various modes of pseudo nucleotide compositions. Bioinformatics. 2015; 31:119-120.
11. Chen W, Lin H, Chou KC. Pseudo nucleotide composition or PseKNC: an effective formulation for analyzing genomic sequences. Mol BioSyst. 2015; 11:2620-2634.
12. Chen W, Feng PM, Lin H, Chou KC. iRSpot-PseDNC: identify recombination spots with pseudo dinucleotide composition. Nucleic Acids Res. 2013; 41:e68.
13. Xu Y, Ding J, Wu LY. iSNO-PseAAC: Predict cysteine S-nitrosylation sites in proteins by incorporating position specific amino acid propensity into pseudo amino acid composition. PLoS ONE. 2013; 8:e55844.
14. Lin H, Deng EZ, Ding H, Chen W, Chou KC. iPro54-PseKNC: a sequence-based predictor for identifying sigma-54 promoters in prokaryote with pseudo k-tuple nucleotide composition. Nucleic Acids Res. 2014; 42:12961-12972.
15. Qiu WR, Xiao X. iRSpot-TNCPseAAC: Identify recombination spots with trinucleotide composition and pseudo amino acid components. Int J Mol Sci. 2014; 15:1746-1766.
16. Xu Y, Wen X, Wen LS, Wu LY. iNitro-Tyr: Prediction of nitrotyrosine sites in proteins with general pseudo amino acid composition. PLoS ONE. 2014; 9:e105018.
17. Chou KC. A vectorized sequence-coupling model for predicting HIV protease cleavage sites in proteins. J Biol Chem. 1993; 268:16938-16948.
18. Liu B, Wang S, Long R. iRSpot-EL: identify recombination spots with an ensemble learning approach. Bioinformatics. 2017; 33:35-41.
19. Jia J, Zhang L, Liu Z, Xiao X. pSumo-CD: Predicting sumoylation sites in proteins with covariance discriminant algorithm by incorporating sequence-coupled effects into general PseAAC. Bioinformatics. 2016; 32:3133-3141.
20. Liu B, Long R. iDHS-EL: Identifying DNase I hypersensi-tivesites by fusing three different modes of pseudo nucleotide composition into an en-semble learning framework. Bioinformatics. 2016; 32:2411-2418.
21. Forsen S. Graphical rules for enzyme-catalyzed rate laws. Biochem J. 1980; 187:829-835.
22. Zhou GP, Deng MH. An extension of Chou's graphic rules for deriving enzyme kinetic equations to systems involving parallel reaction pathways. Biochem J. 1984; 222:169-176.
23. Chou KC. Graphic rules in steady and non-steady enzyme kinetics. J Biol Chem. 1989; 264:12074-12079.
24. Althaus IW, Gonzales AJ, Chou JJ, Kezdy FJ, Romero DL, Aristoff PA, Tarpley WG, Reusser F. The quinoline U-78036 is a potent inhibitor of HIV-1 reverse transcriptase. J Biol Chem. 1993; 268:14875-14880.
25. Althaus IW, Diebel MR, Romero DL, Aristoff PA, Tarpley WG, Reusser F. Kinetic studies with the nonnucleoside HIV-1 reverse transcriptase inhibitor U-88204E. Biochemistry. 1993; 32:6548-6554.
26. Wu ZC, Xiao X. 2D-MH: A web-server for generating graphic representation of protein sequences based on the physicochemical properties of their constituent amino acids. J Theor Biol. 2010; 267:29-34.
27. Lin WZ, Xiao X. Wenxiang: a web-server for drawing wenxiang diagrams. Natural Science. 2011; 3:862-865.
28. Zhou GP. The disposition of the LZCC protein residues in wenxiang diagram provides new insights into the protein-protein interaction mechanism. J Theor Biol. 2011; 284:142-148.
29. Fawcett JA. An Introduction to ROC Analysis. Pattern Recognition Letters. 2005; 27:861-874.
30. Davis J, Goadrich M. The relationship between Precision-Recall and ROC curves. Proceedings of the 23rd international conference on Machine learning. 2006; 233-240.
31. Chen W, Feng P, Ding H, Lin H. iRNA-Methyl: Identifying N6-methyladenosine sites using pseudo nucleotide composition. Anal Biochem. 2015; 490:26-33. doi: 10.1016/j.ab.2015.08.021.
32. Jia J, Liu Z, Xiao X. iPPI-Esml: an ensemble classifier for identifying the interactions of proteins by incorporating their physicochemical properties and wavelet transforms into PseAAC. J Theor Biol. 2015; 377:47-56.
33. Liu B, Fang L, Wang S, Wang X. Identification of microRNA precursor with the degenerate K-tuple or Kmer strategy. Journal of Theoretical Biology. 2015; 385:153-159.
34. Liu Z, Xiao X, Qiu WR. iDNA-Methyl: Identifying DNA methylation sites via pseudo trinucleotide composition. Anal Biochem. 2015; 474:69-77. doi: 10.1016/j.ab.2014.12.009.
35. Chen W, Tang H, Ye J, Lin H. iRNA-PseU: Identifying RNA pseudouridine sites. Molecular Therapy-Nucleic Acids. 2016; 5:e332.
36. Jia J, Liu Z, Xiao X, Liu B. iSuc-PseOpt: Identifying lysine succinylation sites in proteins by incorporating sequence-coupling effects into pseudo components and optimizing imbalanced training dataset. Anal Biochem. 2016; 497:48-56.
37. Jia J, Liu Z, Xiao X. pSuc-Lys: Predict lysine succinylation sites in proteins with PseAAC and ensemble random forest approach. J Theor Biol. 2016; 394:223-230.
38. Zhang CJ, Tang H, Li WC, Lin H. iOri-Human: identify human origin of replication by incorporating dinucleotide physicochemical properties into pseudo nucleotide composition. Oncotarget. 2016; 7:69783-69793. doi: 10.18632/oncotarget.11975.
39. Liu Z, Xiao X, Yu DJ, Jia J. pRNAm-PC: Predicting N-methyladenosine sites in RNA sequences via physical-chemical properties. Anal Biochem. 2016; 497:60-67.
40. Qiu WR, Sun BQ, Xu ZC. iPTM-mLys: identifying multiple lysine PTM sites and their different types. Bioinformatics. 2016; 32:3116-3123.
41. Meher PK, Sahu TK, Saini V, Rao AR. Predicting antimicrobial peptides with improved accuracy by incorporating the compositional, physico-chemical and structural features into Chou's general PseAAC. Sci Rep. 2017; 7:42362.
42. Chen W, Feng P, Yang H, Ding H. iRNA-AI: identifying the adenosine to inosine editing sites in RNA sequences. Oncotarget. 2017; 8:4208-4217. doi: 10.18632/oncotarget.13758.
43. Liu B, Wu H, Zhang D, Wang X. Pse-Analysis: a python package for DNA/RNA and protein/peptide sequence analysis based on pseudo components and kernel methods. Oncotarget. 2017; 8:13338-13343. doi: 10.18632/oncotarget.14524.
44. Chou KC, Shen HB. Review: recent advances in developing web-servers for predicting protein attributes. Natural Science. 2009; 1:63-92.
45. Chou KC. Impacts of bioinformatics to medicinal chemistry. Medicinal Chemistry. 2015; 11:218-234.
46. Chen J, Long R, Wang XL, Liu B. dRHP-PseRA: detecting remote homology proteins using profile-based pseudo protein sequence and rank aggregation. Scientific Reports. 2016:6:32333.
47. Chen W, Ding H, Feng P, Lin H. iACP: a sequence-based tool for identifying anticancer peptides. Oncotarget. 2016; 7:16895-16909. doi: 10.18632/oncotarget.7815.
48. Jia J, Liu Z, Xiao X, Liu B. iCar-PseCp: identify carbonylation sites in proteins by Monto Carlo sampling and incorporating sequence coupled effects into general PseAAC. Oncotarget. 2016; 7:34558-34570. doi: 10.18632/oncotarget.9148.
49. Liu B, Fang L, Long R. iEnhancer-2L: a two-layer predictor for identifying enhancers and their strength by pseudo k-tuple nucleotide composition. Bioinformatics. 2016; 32:362-369.
50. Qiu WR, Sun BQ, Xiao X, Xu ZC. iHyd-PseCp: Identify hydroxyproline and hydroxylysine in proteins by incorporating sequence-coupled effects into general PseAAC. Oncotarget. 2016; 7:44310-44321. doi: 10.18632/oncotarget.10027.
51. Qiu WR, Xiao X, Xu ZH. iPhos-PseEn: identifying phosphorylation sites in proteins by fusing different pseudo components into an ensemble classifier. Oncotarget. 2016; 7:51270-51283. doi: 10.18632/oncotarget.9987.
52. Xiao X, Ye HX, Liu Z. iROS-gPseKNC: predicting replication origin sites in DNA by incorporating dinucleotide position-specific propensity into general pseudo nucleotide composition. Oncotarget. 2016; 7:34180-34189. doi: 10.18632/oncotarget.9057.
53. Khan M, Hayat M, Khan SA, Iqbal N. Unb-DPC: Identify mycobacterial membrane protein types by incorporating un-biased dipeptide composition into Chou's general PseAAC. J Theor Biol. 2017; 415:13-19.
54. Chou KC. Some remarks on protein attribute prediction and pseudo amino acid composition (50th Anniversary Year Review). J Theor Biol. 2011; 273:236-247.
55. Chou KC. A sequence-coupled vector-projection model for predicting the specificity of GalNAc-transferase. Protein Science. 1995; 4:1365-1383.
56. Chou KC. Using subsite coupling to predict signal peptides. Protein Eng. 2001; 14:75-79.
57. Xu Y, Shao XJ, Wu LY, Deng NY. iSNO-AAPair: incorporating amino acid pairwise coupling into PseAAC for predicting cysteine S-nitrosylation sites in proteins. PeerJ. 2013; 1:e171.
58. Xu Y, Wen X, Shao XJ. iHyd-PseAAC: Predicting hydroxyproline and hydroxylysine in proteins by incorporating dipeptide position-specific propensity into pseudo amino acid composition. Int J Mol Sci. 2014; 15:7594-7610.
59. Qiu WR, Xiao X, Lin WZ. iMethyl-PseAAC: Identification of Protein Methylation Sites via a Pseudo Amino Acid Composition Approach. Biomed Res Int. 2014; 2014:947416.
60. Jia J, Liu Z, Xiao X, Liu B. Identification of protein-protein binding sites by incorporating the physicochemical properties and stationary wavelet transforms into pseudo amino acid composition (iPPBS-PseAAC). J Biomol Struct Dyn. 2016; 34:1946-1961.
61. Jia J, Liu Z, Xiao X, Liu B. iPPBS-Opt: A Sequence-Based Ensemble Classifier for Identifying Protein-Protein Binding Sites by Optimizing Imbalanced Training Datasets. Molecules. 2016; 21:95.
62. Chou KC, Shen HB. Review: Recent progresses in protein subcellular location prediction. Anal Biochem. 2007; 370:1-16.
63. Sun WJ, Li JH, Liu S, Wu J, Zhou H, Qu LH, Yang JH. RMBase: a resource for decoding the landscape of RNA modifications from high-throughput sequencing data. Nucleic Acids Res. 2016; 44:D259-265.
64. Chou KC. Prediction of signal peptides using scaled window. Peptides. 2001; 22:1973-1979.
65. Wang T, Yang J, Shen HB. Predicting membrane protein types by the LLDA algorithm. Protein & Peptide Letters. 2008; 15:915-921.
66. Chou KC. A key driving force in determination of protein structural classes. Biochem Biophys Res Commun. 1999; 264:216-224.
67. Chou KC. Prediction of protein cellular attributes using pseudo amino acid composition. PROTEINS: Structure, Function, and Genetics (Erratum: ibid, 2001, Vol44, 60). 2001; 43:246-255.
68. Chou KC. Using amphiphilic pseudo amino acid composition to predict enzyme subfamily classes. Bioinformatics. 2005; 21:10-19.
69. Chou KC. Pseudo amino acid composition and its applications in bioinformatics, proteomics and system biology. Current Proteomics. 2009; 6: 262-274.
70. Hayat M, Khan A. Discriminating Outer Membrane Proteins with Fuzzy K-Nearest Neighbor Algorithms Based on the General Form of Chou's PseAAC. Protein & Peptide Letters. 2012; 19:411-421.
71. Hayat M, Iqbal N. Discriminating protein structure classes by incorporating Pseudo Average Chemical Shift to Chou's general PseAAC and Support Vector Machine. Computer methods and programs in biomedicine. 2014; 116:184-192.
72. Jiao YS, Du PF. Predicting protein submitochondrial locations by incorporating the positional-specific physicochemical properties into Chou's general pseudo-amino acid compositions. J Theor Biol. 2017; 416:81-87.
73. Rahimi M, Bakhtiarizadeh MR, Mohammadi-Sangcheshmeh A. OOgenesis_Pred: A sequence-based method for predicting oogenesis proteins by six different modes of Chou's pseudo amino acid composition. J Theor Biol. 2017; 414:128-136.
74. Liu B, Liu F, Fang L. repDNA: a Python package to generate various modes of feature vectors for DNA sequences by incorporating user-defined physicochemical properties and sequence-order effects. Bioinformatics. 2015; 31:1307-1309.
75. Chen W, Feng PM, Deng EZ. iTIS-PseTNC: a sequence-based predictor for identifying translation initiation site in human genes using pseudo trinucleotide composition. Anal Biochem. 2014; 462:76-83.
76. Chen W, Feng PM, Lin H. iSS-PseDNC: identifying splicing sites using pseudo dinucleotide composition. Biomed Research International (BMRI). 2014; 2014:623149.
77. Liu B, Liu F, Fang L, Wang X. repRNA: a web server for generating various feature vectors of RNA sequences. Molecular Genetics and Genomics. 2016; 291:473-481.
78. Liu B, Liu F, Wang X, Chen J. Pse-in-One: a web server for generating various modes of pseudo components of DNA, RNA, and protein sequences. Nucleic Acids Res. 2015; 43:W65-W71.
79. Kabir M, Hayat M. iRSpot-GAEnsC: identifing recombination spots via ensemble classifier and extending the concept of Chou's PseAAC to formulate DNA samples. Molecular Genetics and Genomics. 2016; 291:285-296.
80. Qiu WR, Jiang SY, Sun BQ. iRNA-2methyl: An ensemble classifier for identifying RNA 2'-O-methylation modification sites by incorporating sequence-coupled effects into general PseKNC. Medicinal Chemistry. 2017. [Epub ahead of print].
81. Kandaswamy KK, Moller S, Suganthan PN, Sridharan S, Pugalenthi G. AFP-Pred: A random forest approach for predicting antifreeze proteins from sequence-derived properties. J Theor Biol. 2011; 270:56-62.
82. Lin WZ, Fang JA, Xiao X. iDNA-Prot: Identification of DNA Binding Proteins Using Random Forest with Grey Model. PLoS ONE. 2011; 6:e24756.
83. Pugalenthi G, Kandaswamy KK, Kolatkar P. RSARF: Prediction of Residue Solvent Accessibility from Protein Sequence Using Random Forest Method. Protein & Peptide Letters. 2012; 19:50-56.
84. Qiu WR, Sun BQ, Xiao X, Xu D. iPhos-PseEvo: Identifying human phosphorylated proteins by incorporating evolutionary information into general PseAAC via grey system theory. Molecular Informatics. 2016; 36:5-6. doi:10.1002/minf.201600010.
85. Breiman L. Random forests. Machine learning. 2001; 45:5-32.
86. Chen J, Liu H, Yang J. Prediction of linear B-cell epitopes using amino acid pair antigenicity scale. Amino Acids. 2007; 33: 423-428.
87. Ding H, Deng EZ, Yuan LF, Liu L, Lin H. iCTX-Type: A sequence-based predictor for identifying the types of conotoxins in targeting ion channels. BioMed Research International (BMRI). 2014; 2014:286419.
88. Liu B, Fang L, Liu F, Wang X. Identification of real microRNA precursors with a pseudo structure status composition approach. PLoS ONE. 2015; 10:e0121501.
89. Xiao X, Min JL, Lin WZ, Liu Z. iDrug-Target: predicting the interactions between drug compounds and target proteins in cellular networking via the benchmark dataset optimization approach. J Biomol Struct Dyn (JBSD). 2015; 33:2221-2233.
90. Chen W, Feng P, Ding H. Using deformation energy to analyze nucleosome positioning in genomes. Genomics. 2016; 107:69-75.
91. Liu LM, Xu Y. iPGK-PseAAC: identify lysine phosphoglycerylation sites in proteins by incorporating four different tiers of amino acid pairwise coupling information into the general PseAAC. Medicinal Chemistry. 2017 May 15. [Epub ahead of print].
92. Xu Y, Li C. iPreny-PseAAC: identify C-terminal cysteine prenylation sites in proteins by incorporating two tiers of sequence couplings into PseAAC. Medicinal Chemistry. 2017 Apr 19. [Epub ahead of print].
93. Wu ZC, Xiao X. iLoc-Hum: Using accumulation-label scale to predict subcellular locations of human proteins with both single and multiple sites. Molecular Biosystems. 2012; 8:629-641.
94. Lin WZ, Fang JA, Xiao X. iLoc-Animal: A multi-label learning classifier for predicting subcellular localization of animal proteins Molecular BioSystems. 2013; 9:634-644.
95. Xiao X, Wu ZC. iLoc-Virus: A multi-label learning classifier for identifying the subcellular localization of virus proteins with both single and multiple sites. J Theor Biol. 2011; 284:42-51.
96. Xiao X, Wang P, Lin WZ, Jia JH. iAMP-2L: A two-level multi-label classifier for identifying antimicrobial peptides and their functional types. Anal Biochem. 2013; 436:168-177.
97. Chou KC. Some Remarks on Predicting Multi-Label Attributes in Molecular Biosystems. Molecular Biosystems. 2013; 9:1092-1100.
98. Chou KC, Zhang CT. Review: Prediction of protein structural classes. Crit Rev Biochem Mol Biol. 1995; 30:275-349.
99. Zhou GP, Doctor K. Subcellular location prediction of apoptosis proteins. Proteins. 2003; 50:44-48.
100. Mondal S, Pai PP. Chou's pseudo amino acid composition improves sequence-based antifreeze protein prediction. J Theor Biol. 2014; 356:30-35.
101. Feng KY, Cai YD. Boosting classifier for predicting protein domain structural class. Biochemical & Biophysical Research Communications. 2005; 334:213-217.
102. Nanni L, Brahnam S, Lumini A. Prediction of protein structure classes by incorporating different protein descriptors into general Chou's pseudo amino acid composition. J Theor Biol. 2014; 360:109-116.
103. Shen HB, Yang J. Euk-PLoc: an ensemble classifier for large-scale eukaryotic protein subcellular location prediction. Amino Acids. 2007; 33:57-67.
104. Ali F, Hayat M. Classification of membrane protein types using Voting Feature Interval in combination with Chou's Pseudo Amino Acid Composition. J Theor Biol. 2015; 384:78-83.
105. Wu ZC, Xiao X. iLoc-Plant: a multi-label classifier for predicting the subcellular localization of plant proteins with both single and multiple sites. Molecular BioSystems. 2011; 7:3287-3297.
106. Dehzangi A, Heffernan R, Sharma A, Lyons J, Paliwal K, Sattar A. Gram-positive and Gram-negative protein subcellular localization by incorporating evolutionary-based descriptors into Chou's general PseAAC. J Theor Biol. 2015; 364:284-294.
107. Kumar R, Srivastava A, Kumari B, Kumar M. Prediction of beta-lactamase and its class by Chou's pseudo amino acid composition and support vector machine. J Theor Biol. 2015; 365:96-103.
108. Ahmad K, Waris M, Hayat M. Prediction of Protein Submitochondrial Locations by Incorporating Dipeptide Composition into Chou's General Pseudo Amino Acid Composition. J Membr Biol. 2016; 249:293-304.